Review
. 2023 Mar;53(3):595-613.
doi: 10.1007/s40279-022-01805-w. Epub 2023 Jan 9.

Interaction of Factors Determining Critical Power

Affiliations
Review

Interaction of Factors Determining Critical Power

Richie P Goulding et al. Sports Med. 2023 Mar.

Abstract

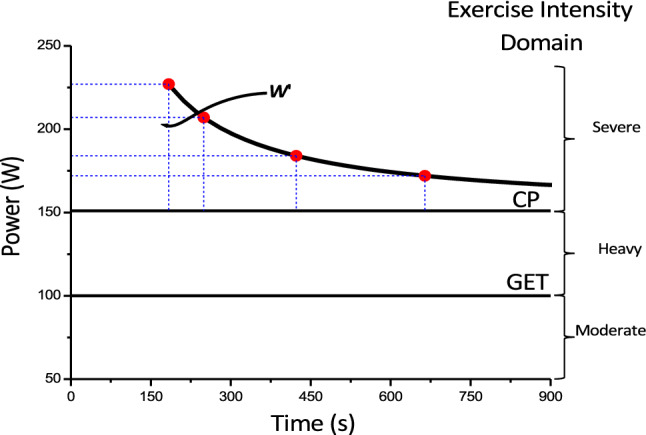
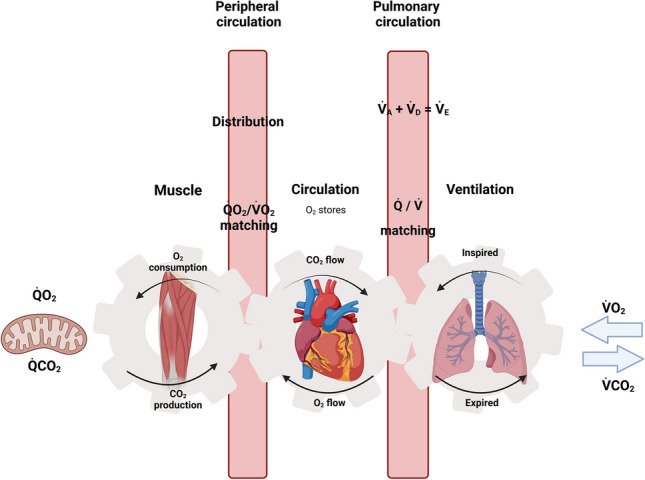
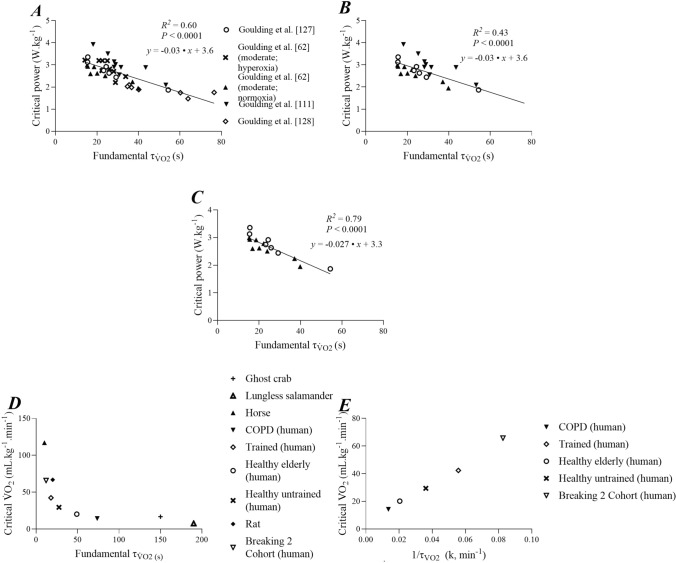
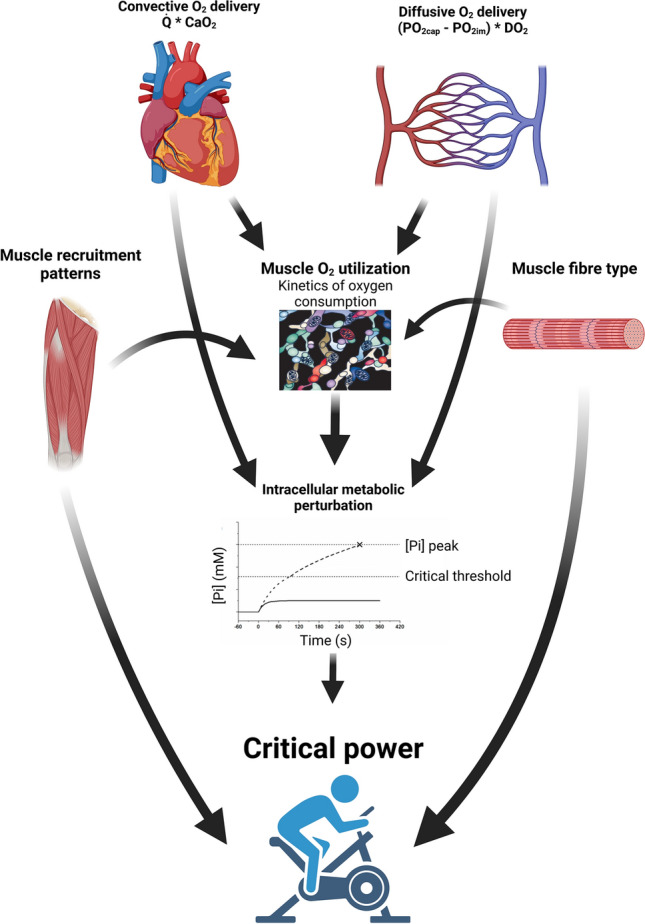
The physiological determinants of high-intensity exercise tolerance are important for both elite human performance and morbidity, mortality and disease in clinical settings. The asymptote of the hyperbolic relation between external power and time to task failure, critical power, represents the threshold intensity above which systemic and intramuscular metabolic homeostasis can no longer be maintained. After ~ 60 years of research into the phenomenon of critical power, a clear understanding of its physiological determinants has emerged. The purpose of the present review is to critically examine this contemporary evidence in order to explain the physiological underpinnings of critical power. Evidence demonstrating that alterations in convective and diffusive oxygen delivery can impact upon critical power is first addressed. Subsequently, evidence is considered that shows that rates of muscle oxygen utilisation, inferred via the kinetics of pulmonary oxygen consumption, can influence critical power. The data reveal a clear picture that alterations in the rates of flux along every step of the oxygen transport and utilisation pathways influence critical power. It is also clear that critical power is influenced by motor unit recruitment patterns. On this basis, it is proposed that convective and diffusive oxygen delivery act in concert with muscle oxygen utilisation rates to determine the intracellular metabolic milieu and state of fatigue within the myocytes. This interacts with exercising muscle mass and motor unit recruitment patterns to ultimately determine critical power.


Conflict of interest statement

Richie P. Goulding and Simon Marwood have no conflicts of interest that are directly relevant to the content of this review.

Figures

Fig. 1
Fig. 1
Hyperbolic power-duration curve that defines the sustainable duration of exercise in the severe-intensity domain. This hyperbolic relationship is defined by two parameters: the power asymptote, known as the critical power (CP), and the curvature constant W′ (denoted by the rectangular dashed blue lines above CP and expressed in kilojoules). Critical power defines the boundary between the heavy- and severe-intensity exercise domains and represents the highest power output for which a metabolic steady state may be attained. The W' comprises a fixed and finite volume of work that is expendable above CP. During severe-intensity exercise, task failure occurs when W′ = 0. GET gas exchange threshold
Fig. 2
Fig. 2
Schematic illustrating an adaptation of Wasserman’s classic “Gears” diagram. It demonstrates Wasserman’s conception of how the respiratory, cardiovascular and neuromuscular systems conflate to enable exercise to be sustained. O2 flows from the atmosphere through the lungs, pulmonary and peripheral circulation to the muscle mitochondria where it is ultimately consumed. CO2 produced by the contracting muscle flows along the same pathway in reverse. Muscle work leads to increased cardiac output and redistribution of blood flow, and increased ventilation in response to both the increased metabolism and evolution of CO2 from the blood as the result of lactic acid buffering. The efficacy of these processes determines the ability to sustain muscular exercise. These concepts are reconsidered in this review within the context of critical power. This figure was created with BioRender.com and was exported under a paid subscription. Q˙CO2 cellular carbon dioxide production, Q˙O2/V˙O2 matching matching of oxygen delivery to local oxygen consumption, Q˙ O2 cellular oxygen consumption, Q˙/V˙ matching matching of ventilation to perfusion, V˙A alveolar ventilation, V˙CO2 Pulmonary carbon dioxide production, V˙D dead space ventilation, V˙E minute ventilation, V˙O2 pulmonary oxygen consumption. Adapted from Wasserman et al. [156], with permission
Fig. 3
Fig. 3
Panels A–C show the relationship between the fundamental phase time constant of pulmonary oxygen uptake kinetics (τV˙O2) and critical power normalized by body mass across a series of four experiments performed by Goulding et al. [65, 114, 130, 131]. Panel A displays all conditions from these studies in which τV˙O2 was characterised with a high degree of confidence, including both moderate- and heavy-intensity exercise, normoxia and hyperoxia (fraction of inspired O2 = 0.5), and in patients with type 1 diabetes mellitus. Panel B displays the same relationship with removal of data points where τV˙O2 was characterised in hyperoxic conditions and in type 1 diabetes (see “Sect. 2” for discussion). Panel C displays the relationship when only normoxic moderate-intensity exercise transitions in healthy participants are utilised. Note the increase in the R2 value as the conditions become more uniform with respect to exercise intensity, population and fraction of inspired O2. Panel D shows the relationship between τV˙O2 and critical V˙O2 across various human populations; elite athletes [157], young trained, active young, healthy elderly, and patients with chronic obstructive pulmonary disease (COPD) and other species where measurements of τV˙O2 and critical power have both been conducted (i.e. the thoroughbred racehorse, rat, ghost crab and lungless salamander). The figure is derived from values reported in the literature of 28 papers published between 1982 and 2010; human populations were originally reported by Rossiter [104], with groups which were approximately matched for age, V˙O2max and health status. Table S1 of the Electronic Supplementary Material should be consulted for details regarding derivation of critical V˙O2 in different species. Panel E shows human-only data from panel D of critical power (CP) [mL kg−1 min−1] plotted as a function of 1/τV˙O2 (i.e. the rate constant, k). There is a notable linear relationship across what can be regarded as the complete range of human fitness, indicating that the relationship between τV˙O2 and CP is hyperbolic, with previously published linear relationships likely being a function of participant homogeneity, and thus reflecting only a truncated portion of the hyperbolic relationship
Fig. 4
Fig. 4
Schematic illustrating each of the factors that has been demonstrated to impact upon critical power. Convective and diffusive O2 delivery act in concert with muscle O2 utilisation to determine the degree of intracellular metabolic perturbation and fatigue induction incurred during the rest-to-exercise transition. The extent of such metabolic perturbations, in turn, determines whether an exercise bout can be met in a metabolic steady state within a given myocyte. Within a given individual, whether an extant power output is met in a whole-body steady state will depend on the muscle fibre-type composition of the individual, the muscle recruitment patterns employed during the task, and the extent of metabolic derangement and fatigue induction incurred in the recruited fibres during the rest-to-exercise transition. This figure was created with BioRender.com and was exported under a paid subscription. CaO2 arterial oxygen content, DO2 muscle diffusive capacity, PO2im intra-myocyte O2 pressure, PO2cap capillary O2 pressure, Q˙, cardiac output

References

    1. Burnley M, Jones AM. Oxygen uptake kinetics as a determinant of sports performance. Eur J Sport Sci. 2007;7:63–79. doi: 10.1080/17461390701456148. - DOI
    1. Joyner MJ, Coyle EF. Endurance exercise performance: the physiology of champions. J Physiol. 2008;586:35–44. doi: 10.1113/jphysiol.2007.143834. - DOI - PMC - PubMed
    1. Myers J, Prakash M, Froelicher V, Do D, Partington S, Atwood JE. Exercise capacity and mortality among men referred for exercise testing. N Engl J Med. 2002;346:793–801. doi: 10.1056/NEJMoa011858. - DOI - PubMed
    1. Myers J, Kaykha A, George S, Abella J, Zaheer N, Lear S, et al. Fitness versus physical activity patterns in predicting mortality in men. Am J Med. 2004;117:912–918. doi: 10.1016/j.amjmed.2004.06.047. - DOI - PubMed
    1. Black MI, Jones AM, Blackwell JR, Bailey SJ, Wylie LJ, McDonagh STJ, et al. Muscle metabolic and neuromuscular determinants of fatigue during cycling in different exercise intensity domains. J Appl Physiol. 2017;122:446–459. doi: 10.1152/japplphysiol.00942.2016. - DOI - PMC - PubMed