. 2023 Dec;16(6):1251-1266.
doi: 10.1007/s12265-022-10347-5. Epub 2023 Jan 9.

Phenotypic and Genetic Factors Associated with Absence of Cardiomyopathy Symptoms in PLN:c.40_42delAGA Carriers

Collaborators, Affiliations

Phenotypic and Genetic Factors Associated with Absence of Cardiomyopathy Symptoms in PLN:c.40_42delAGA Carriers

Esteban A Lopera-Maya et al. J Cardiovasc Transl Res. 2023 Dec.

Abstract

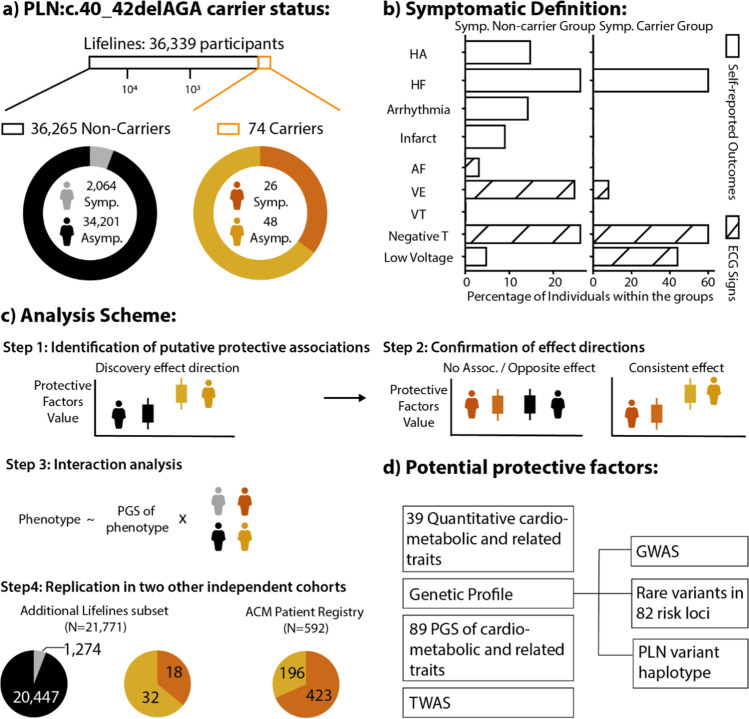
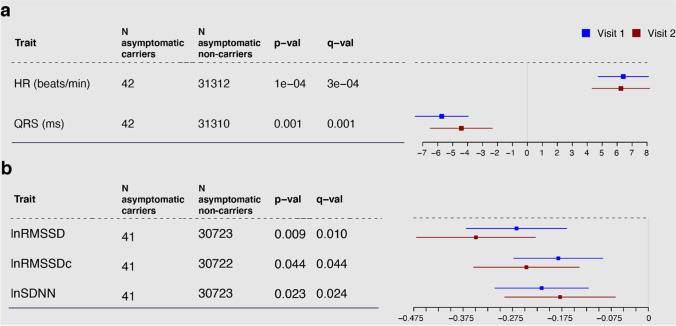
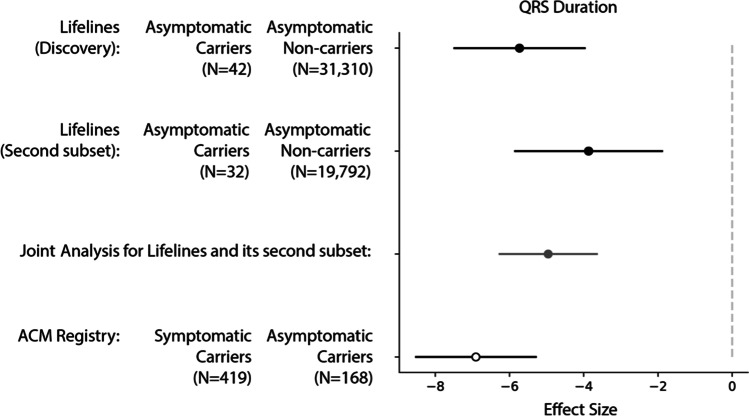
The c.40_42delAGA variant in the phospholamban gene (PLN) has been associated with dilated and arrhythmogenic cardiomyopathy, with up to 70% of carriers experiencing a major cardiac event by age 70. However, there are carriers who remain asymptomatic at older ages. To understand the mechanisms behind this incomplete penetrance, we evaluated potential phenotypic and genetic modifiers in 74 PLN:c.40_42delAGA carriers identified in 36,339 participants of the Lifelines population cohort. Asymptomatic carriers (N = 48) showed shorter QRS duration (- 5.73 ms, q value = 0.001) compared to asymptomatic non-carriers, an effect we could replicate in two different independent cohorts. Furthermore, symptomatic carriers showed a higher correlation (rPearson = 0.17) between polygenic predisposition to higher QRS (PGSQRS) and QRS (p value = 1.98 × 10⁻⁸), suggesting that the effect of the genetic variation on cardiac rhythm might be increased in symptomatic carriers. Our results allow for improved clinical interpretation for asymptomatic carriers, while our approach could guide future studies on genetic diseases with incomplete penetrance.

Keywords: Cardiomyopathy; Genome-wide association study; Incomplete penetrance; Modifiers of Mendelian disorders; Polygenic score.


Conflict of interest statement

The authors declare no competing interests.

Figures

Fig. 1
Fig. 1
Graphic summary. a Distribution of the PLN:c.40_42delAGA carriers and non-carriers and ratio of the symptomatic and asymptomatic group in the subset of the Lifelines cohort. b Definition of symptomatic status and relative proportions of people showing each clinical outcome or abnormal ECG signs. c Analysis scheme used in this study. Briefly, we screen for potential protective factors by comparing them between asymptomatic non-carriers and asymptomatic carriers and then confirm them by comparing with the other groups (see “Methods”). Furthermore, we assessed whether there is an interaction effect between the symptoms and carrier status and the predictability of PGS for the phenotype that shows potential protective effects. d Potential protective factors analyzed in this study. GWAS, genome-wide association study; HA, heart attack; HF, heart failure; Infarct, infarction; AF, atrial fibrillation; TWAS, transcriptome-wide association study; VE, ventricular ectopic beats; VT, ventricular tachycardia
Fig. 2
Fig. 2
Forest plot of effect sizes for significant quantitative phenotypes. Squares represent the effect size (beta). Lines represent standard error. Blue squares and the numbers in the columns correspond to analysis results for the baseline visit (visit 1). Red squares correspond to the second visit approximately 5 years later (visit 2). Phenotypes are separated by the scale in panels a and b. N asymptomatic carriers (or non-carriers) refer to participants with non-null information at visit 1; p val, p value for the independent association; q val, false discovery rate for conjoined analysis of all the traits that takes into account 1000 permutations for each of the 38 traits; lnRMSSD, natural logarithm of the root mean square of successive differences; lnRMSSDc, RMSSD corrected by heart rate; lnSSDN, natural logarithm of the normal-to-normal intervals
Fig. 3
Fig. 3
Distribution of HR and QRS with carrier status and symptom manifestation. For each phenotype, the distribution within groups is represented in two forms: the truncated violin plots in gray display the density, while the boxplots display the median (center horizontal line), the first and third quartiles (box hinges) and the values up to 1.5 interquartile ranges (IQR) away from the respective hinges (upper and lower whiskers). Values above or below these extremes are represented as individual points. a HR. b QRS duration. The different distribution for asymptomatic carriers compared to all the other groups is visually apparent for both these traits but is more variable in the HR variability-related traits (Supplementary Fig. 3). P values correspond to the regression coefficient of the adjusted trait (Y-axis) in the model described in Eq. 1, comparing the groups indicated by the ticks; only significant p values are shown. The distribution of unadjusted traits can be observed in Supplementary Fig. 3. Asympt, asymptomatic; sympt, symptomatic
Fig. 4
Fig. 4
Comparison of the effect sizes for HR and QRS duration in the two replication datasets and the discovery dataset. The figure shows the effect sizes from the Lifelines discovery cohort and the two replication cohorts: an additional subset of Lifelines participants and the ACM/PLN registry. Note that the effect in the Lifelines cohorts reflects the difference between the asymptomatic carriers and asymptomatic non-carriers, whereas replication in the ACM/PLN registry compares symptomatic carriers to asymptomatic carriers
Fig. 5
Fig. 5
Genotype distribution of SNPs in chromosomes 3 and 6 according to carrier status and symptom manifestation. Frequency bar plots depicting the genotypes for a SNP rs6768326 in chromosome 3 and b SNP rs112525682 in chromosome 16. Stacked bars are used to represent the relative counts of individuals with 2 (red), 1 (green), or 0 (blue) alternative alleles. Discrete genotypes were derived by rounding the allele dosage to the nearest integer value or setting it to missing if their value was more than 0.3 away. p values are derived from linear models adjusted for age, sex, and the first PC
Fig. 6
Fig. 6
Interaction of PGSQRS with symptomatic carrier status. a Schematic overview of the interaction. PLN:c.40_42delAGA carriers show an increased risk of developing cardiac symptoms. In turn, symptomatic carriers show a higher correlation between PGSQRS and QRS compared to asymptomatic non-carriers. b Scatter plot and regression line for the partial correlation between PGSQRS and QRS for each group studied (colors according to the legend)

References

    1. Elliott P, et al. Classification of the cardiomyopathies: a position statement from the European Society Of Cardiology Working Group on Myocardial and Pericardial Diseases. Eur Heart J. 2008;29:270–276. - PubMed
    1. McKenna WJ, Judge DP. Epidemiology of the inherited cardiomyopathies. Nat Rev Cardiol. 2021;18:22–36. - PubMed
    1. Jordan, Elizabeth ,et al. Evidence-Based Assessment of Genes in Dilated Cardiomyopathy. Circulation. 2021;144:7–19. - PMC - PubMed
    1. MacLennan DH, Kranias EG. Phospholamban: a crucial regulator of cardiac contractility. Nat Rev Mol Cell Biol. 2003;4:566–577. - PubMed
    1. van der Zwaag PA, et al. Recurrent and founder mutations in the Netherlands-Phospholamban p.Arg14del mutation causes arrhythmogenic cardiomyopathy. Neth. Heart J. Mon. J. Neth. Soc. Cardiol. Neth. Heart Found. 2013;21:286–293. - PMC - PubMed

Publication types