. 2023 Jul;19(7):1952-1981.
doi: 10.1080/15548627.2023.2165313. Epub 2023 Jan 20.

Microglial phagocytosis dysfunction in stroke is driven by energy depletion and induction of autophagy

Affiliations

Microglial phagocytosis dysfunction in stroke is driven by energy depletion and induction of autophagy

Sol Beccari et al. Autophagy. 2023 Jul.

Abstract

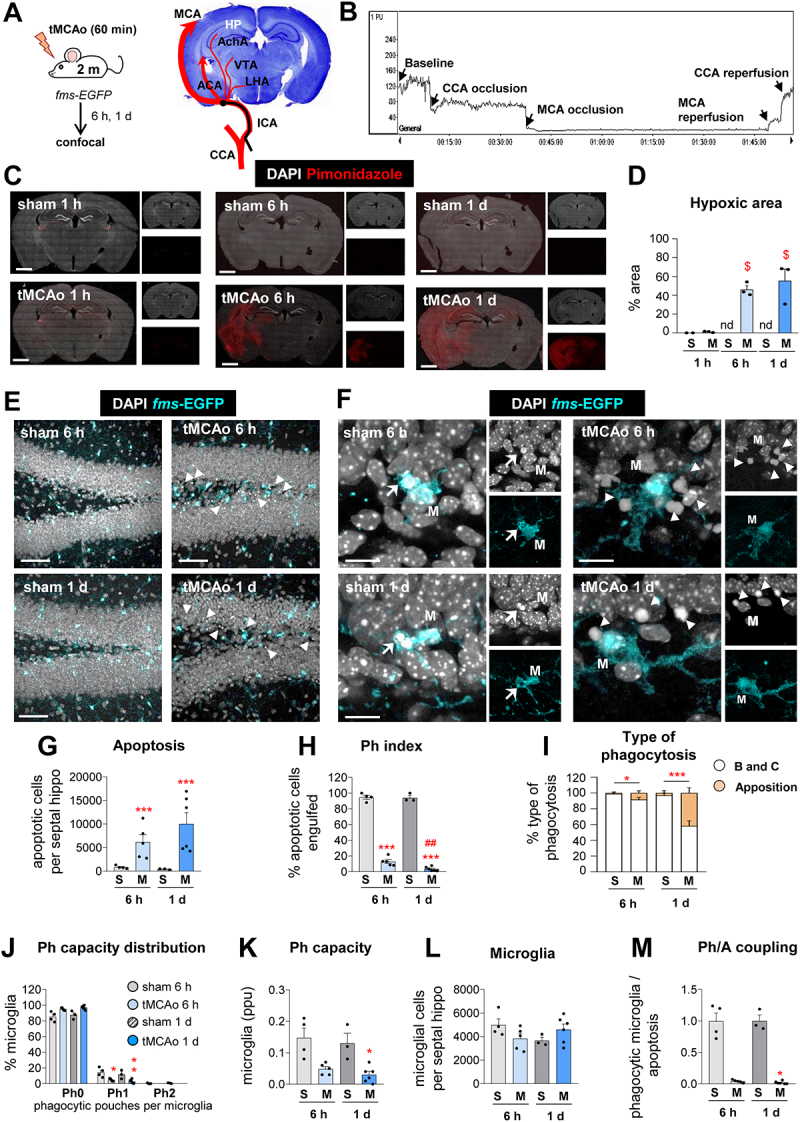
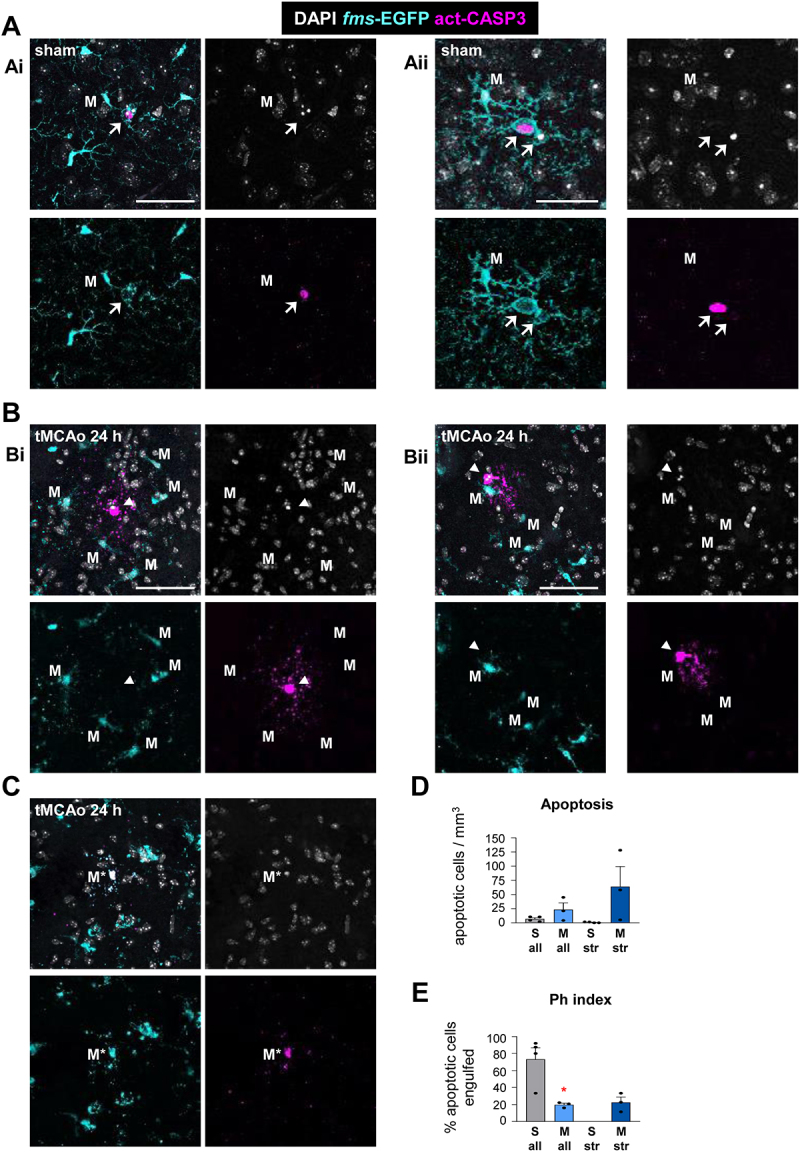
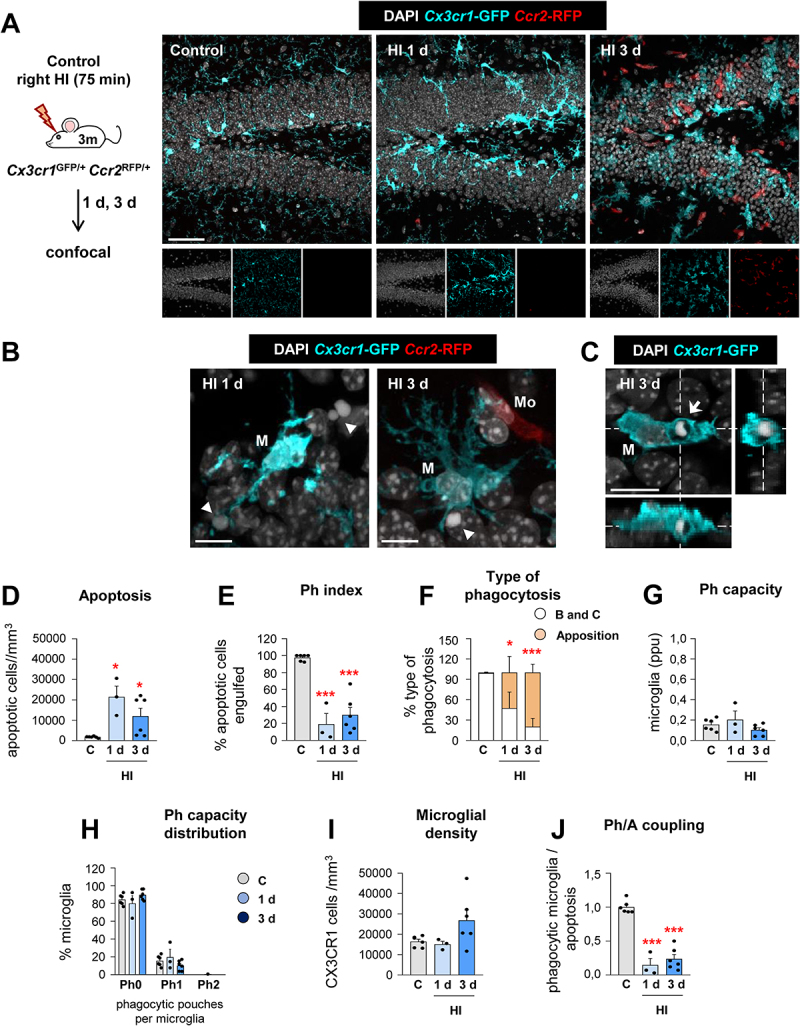
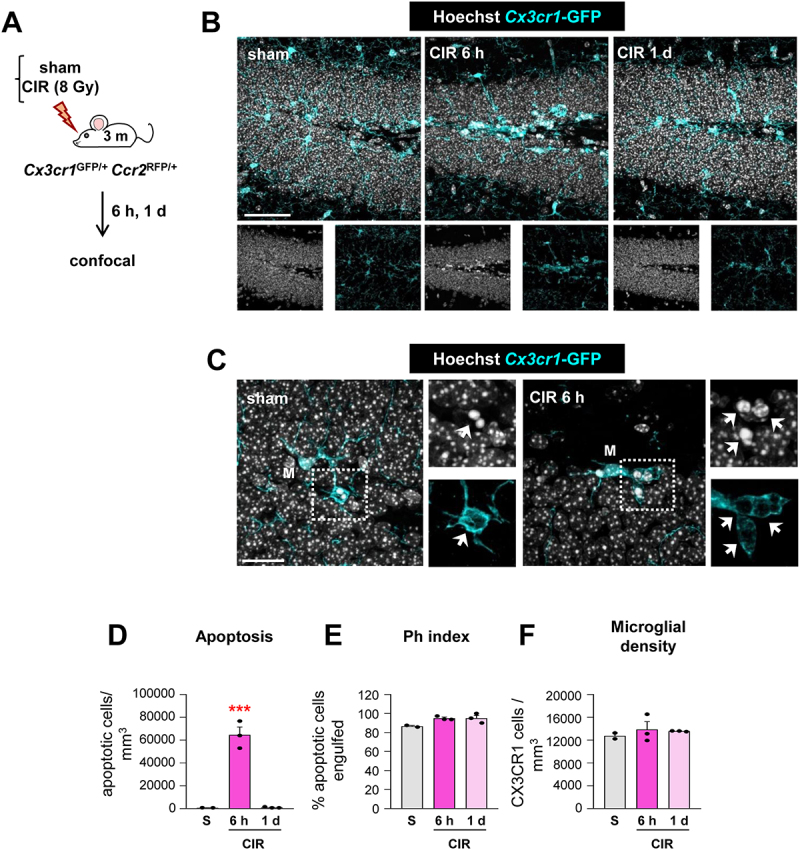
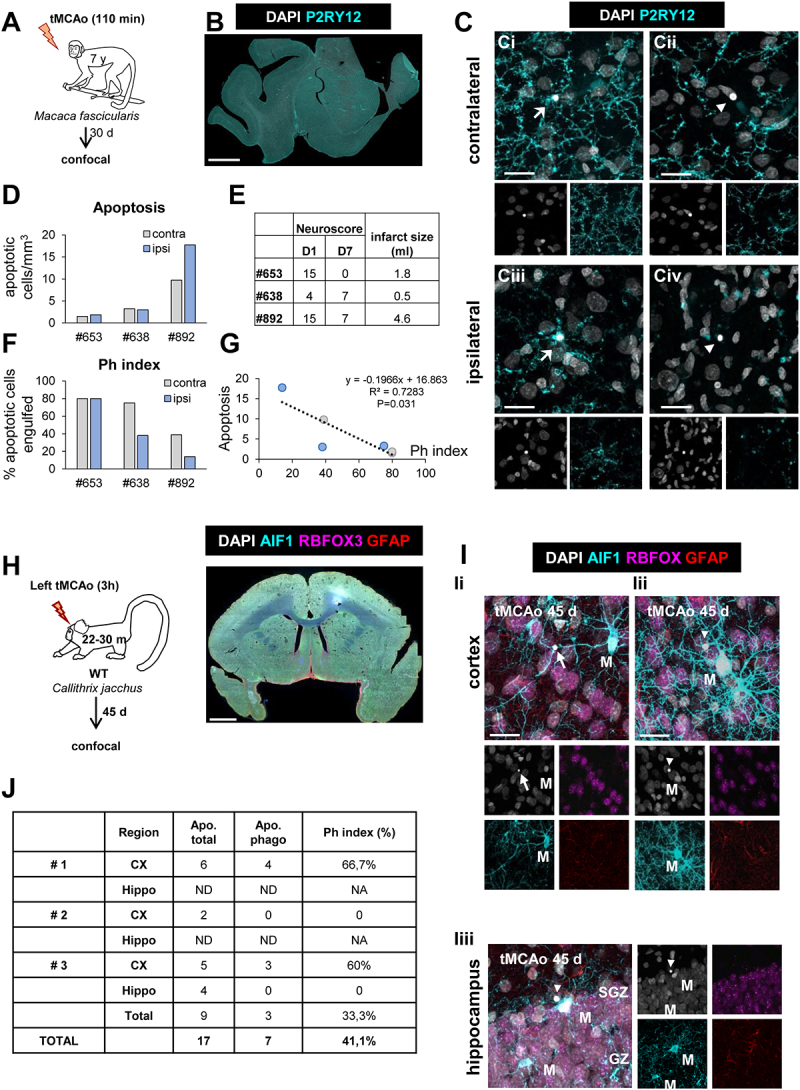
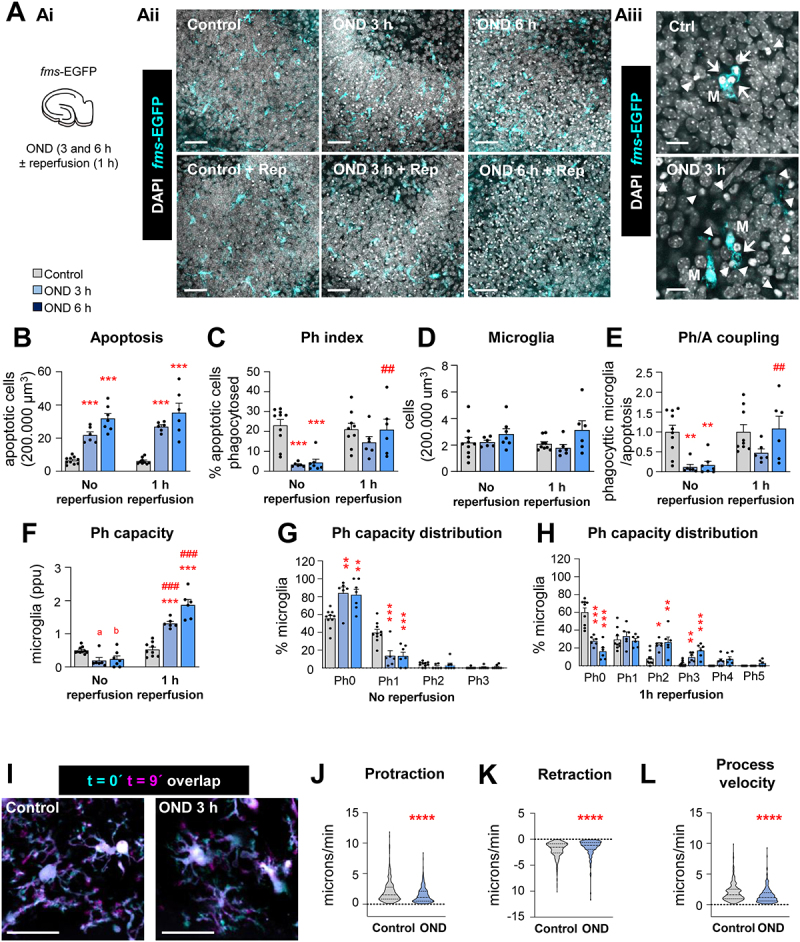
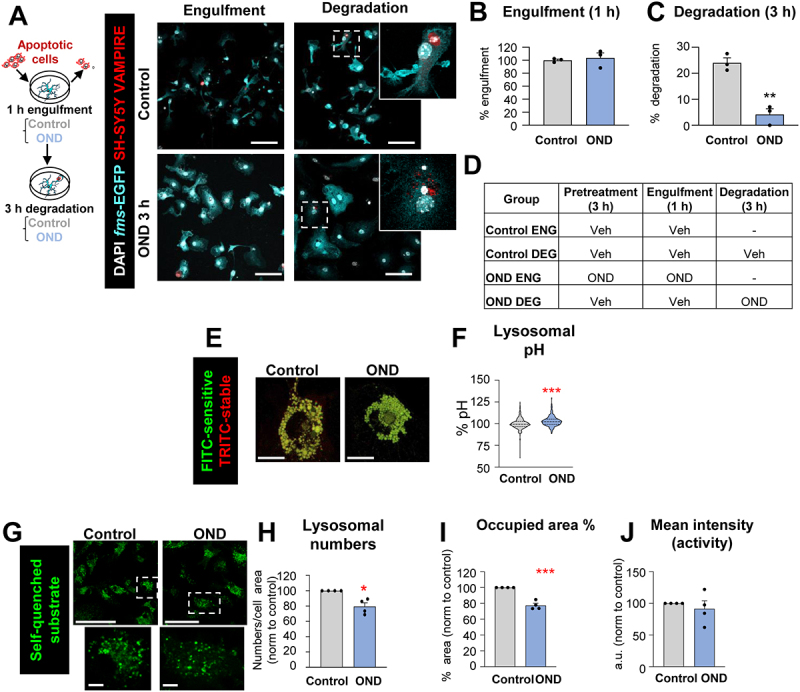
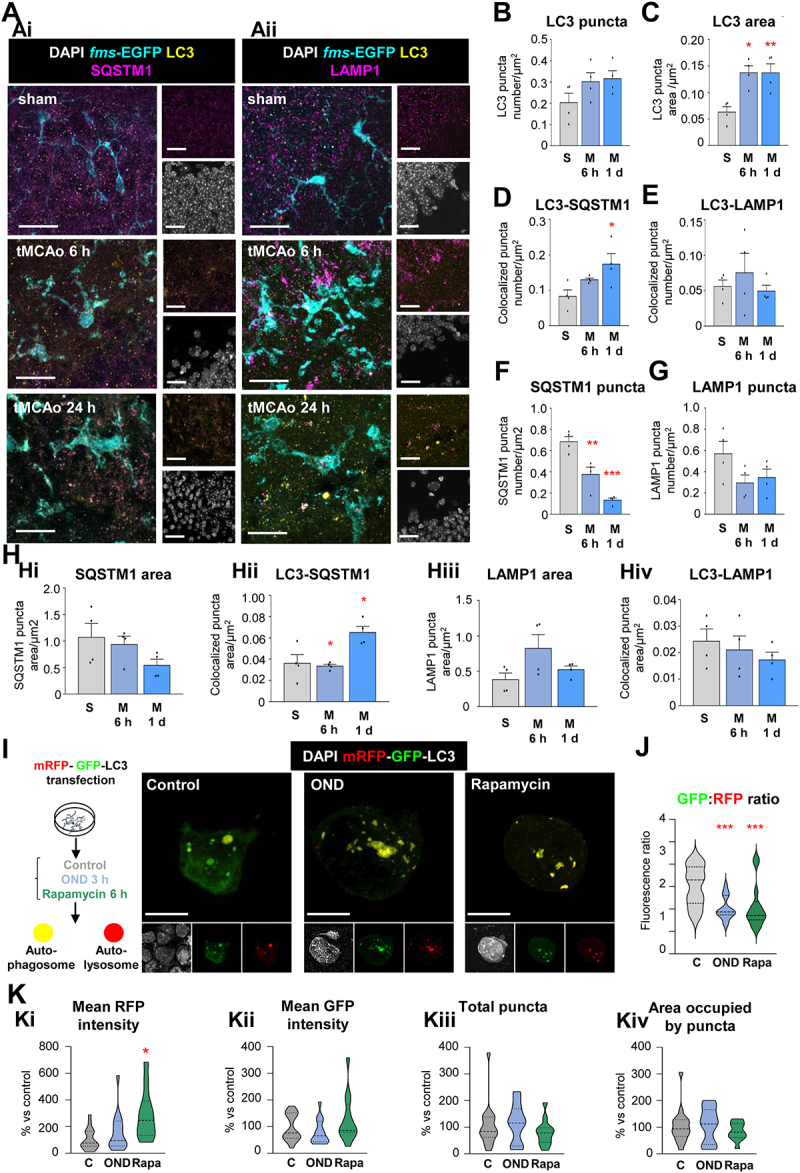
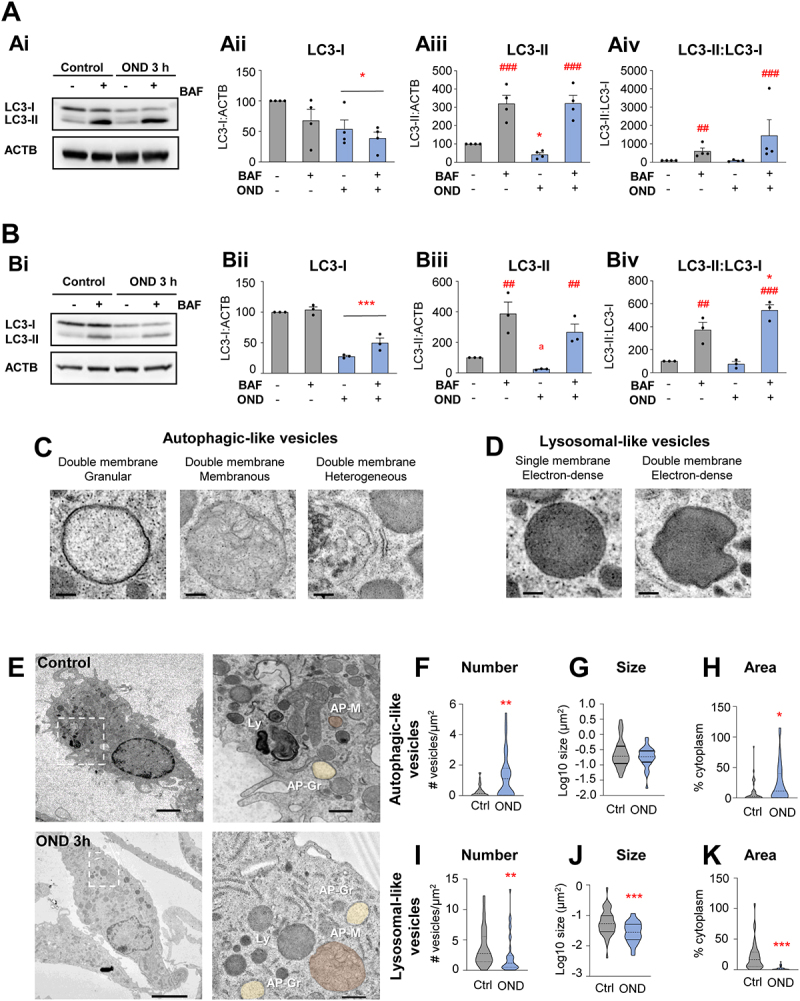
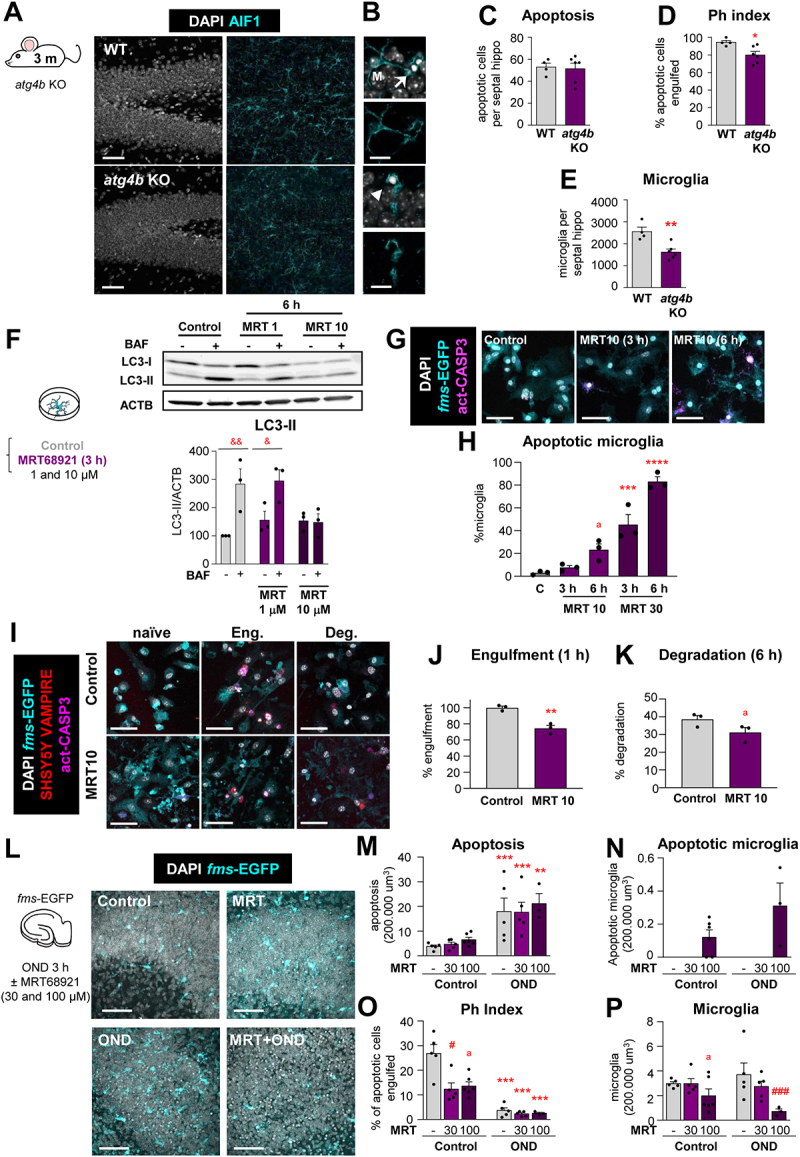
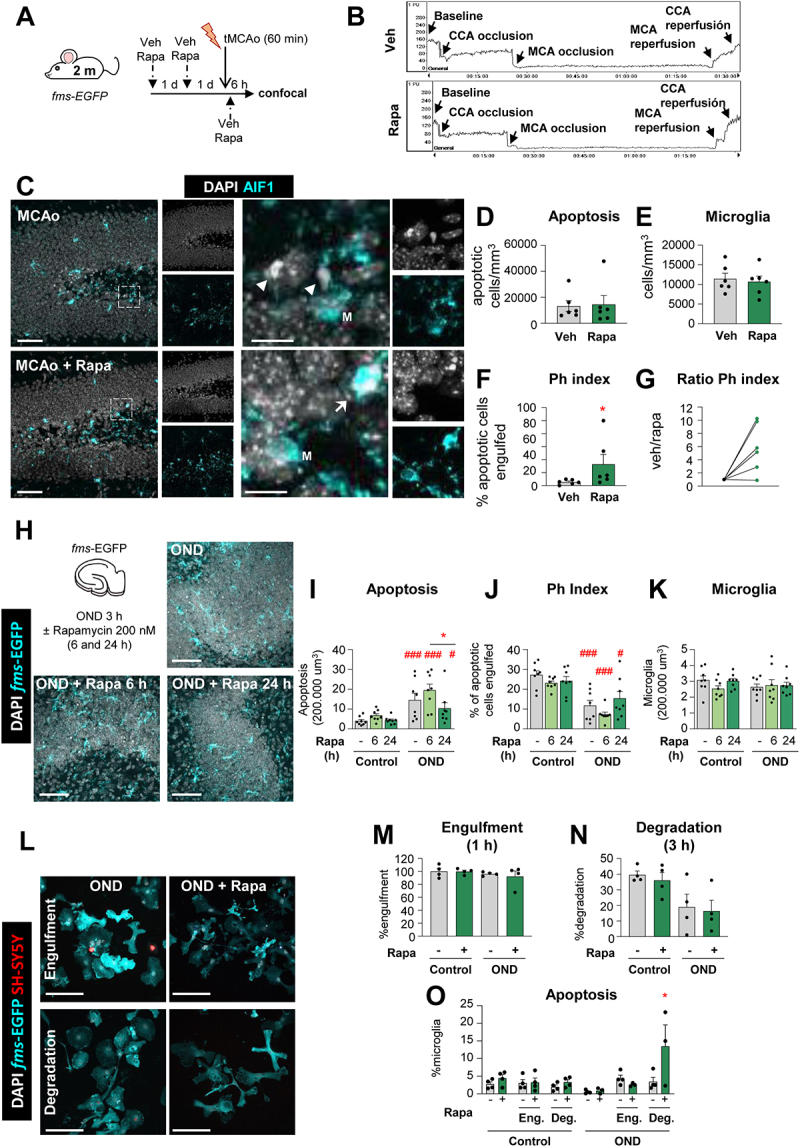
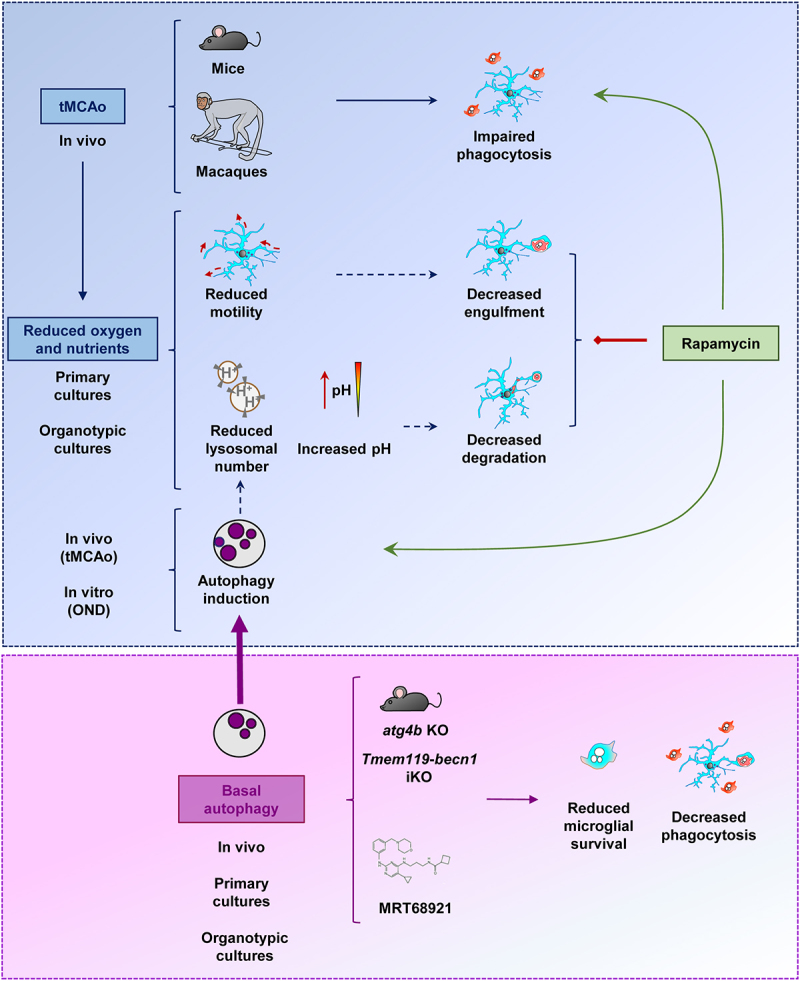
Microglial phagocytosis of apoptotic debris prevents buildup damage of neighbor neurons and inflammatory responses. Whereas microglia are very competent phagocytes under physiological conditions, we report their dysfunction in mouse and preclinical monkey models of stroke (macaques and marmosets) by transient occlusion of the medial cerebral artery (tMCAo). By analyzing recently published bulk and single cell RNA sequencing databases, we show that the phagocytosis dysfunction was not explained by transcriptional changes. In contrast, we demonstrate that the impairment of both engulfment and degradation was related to energy depletion triggered by oxygen and nutrient deprivation (OND), which led to reduced process motility, lysosomal exhaustion, and the induction of a protective macroautophagy/autophagy response in microglia. Basal autophagy, in charge of removing and recycling intracellular elements, was critical to maintain microglial physiology, including survival and phagocytosis, as we determined both in vivo and in vitro using pharmacological and transgenic approaches. Notably, the autophagy inducer rapamycin partially prevented the phagocytosis impairment induced by tMCAo in vivo but not by OND in vitro, where it even had a detrimental effect on microglia, suggesting that modulating microglial autophagy to optimal levels may be a hard to achieve goal. Nonetheless, our results show that pharmacological interventions, acting directly on microglia or indirectly on the brain environment, have the potential to recover phagocytosis efficiency in the diseased brain. We propose that phagocytosis is a therapeutic target yet to be explored in stroke and other brain disorders and provide evidence that it can be modulated in vivo using rapamycin.Abbreviations: AIF1/IBA1: allograft inflammatory factor 1; AMBRA1: autophagy/beclin 1 regulator 1; ATG4B: autophagy related 4B, cysteine peptidase; ATP: adenosine triphosphate; BECN1: beclin 1, autophagy related; CASP3: caspase 3; CBF: cerebral blood flow; CCA: common carotid artery; CCR2: chemokine (C-C motif) receptor 2; CIR: cranial irradiation; Csf1r/v-fms: colony stimulating factor 1 receptor; CX3CR1: chemokine (C-X3-C motif) receptor 1; DAPI: 4',6-diamidino-2-phenylindole; DG: dentate gyrus; GO: Gene Ontology; HBSS: Hanks' balanced salt solution; HI: hypoxia-ischemia; LAMP1: lysosomal-associated membrane protein 1; MAP1LC3/LC3: microtubule-associated protein 1 light chain 3; MCA: medial cerebral artery; MTOR: mechanistic target of rapamycin kinase; OND: oxygen and nutrient deprivation; Ph/A coupling: phagocytosis-apoptosis coupling; Ph capacity: phagocytic capacity; Ph index: phagocytic index; SQSTM1: sequestosome 1; RNA-Seq: RNA sequencing; TEM: transmission electron microscopy; tMCAo: transient medial cerebral artery occlusion; ULK1: unc-51 like kinase 1.

Keywords: Autophagy; ischemia; lysosomes; microglia; phagocytosis; rapamycin; stroke; tMCAo.


Conflict of interest statement

Authors declare no competing financial interests.

Figures

Figure 1.
Figure 1.
Microglial phagocytosis is impaired in mice exposed to tMCAo. (A) Experimental design of tMCAo in 2 mo fms-EGFP mice and coronal slice with cresyl violet showing the areas irrigated by the MCA. (B) Laser Doppler signal graph showing CBF in the territory supplied by MCA during baseline, CCA and MCA occlusion, and reperfusion. Successful MCA occlusion, determined by CBF > 70% drop from the baseline, recovers after reperfusion. The values are expressed in arbitrary Perfusion Units (PU). (C) Representative tiled confocal image of coronal hippocampi showing cell nuclei (with DAPI, in white) and hypoxic areas labeled with the hypoxic probe pimonidazole (in red) in 2-mo fms-EGFP mice after sham (S) and tMCAo (M) treatment at 1 h, 6 h and 1 d. (D) Percentage of hypoxic brain area determined by pimonidazole (in red) after tMCAo at 6 h and 1 d. The pimonidazole signal was not detected (nd) in sham animals. (E) Representative confocal z-stacks of the DG of fms-EGFP mice at 6 h and 1 d after tMCAo. Cell nuclei were visualized with DAPI (in white) and microglia by EGFP (in cyan). Apoptotic cells are marked with arrowheads. (F) Representative confocal z-stacks from the septal DG of a sham and tMCAo-treated mice at 6 h and 1 d, showing apoptotic cells non-phagocytosed (arrowheads) or phagocytosed (arrows) by microglia (fms-EGFP+, in cyan; M). (G) Number of apoptotic cells per septal hippocampus in sham and tMCAo. (H) Ph index in the septal hippocampus (% of apoptotic cells engulfed by microglia). (I) Type of microglial phagocytosis (% of “ball and chain” or “apposition” mechanism). (J) Histogram showing the Ph capacity of microglia (% of microglia with phagocytic pouches). (K) Weighted Ph capacity (% of microglia with phagocytic pouches). (L) Number of fms-EGFP+ microglia per septal hippocampus. (M) Ph/A coupling (in fold change) in the septal hippocampus. Bars show mean ± SEM. In (D), n = 2 (sham at 1 h), n = 3 (sham 6 h and 1 d), and n = 3 (tMCAo at 1 h, 6 h, and 1 d); (G-M), n = 3 mice (sham at 6 h), n = 4 mice (sham at 1 d), n = 5 mice (tMCAo at 6 h) and n = 6 mice (tMCAo at 1 d).Data were analyzed using one-way ANOVA using Holm-Sidak post hoc test (D). The effect of sham/tMCAo at 6 h and 1 d on apoptosis (G), Ph index (H), Type of phagocytosis (I), Ph capacity distribution (J), Ph capacity (K), Microglia (L) and Ph/A coupling (M) was analyzed using two-way ANOVA. Significant interactions were found between the two factors (tMCAo treatment x time); therefore, data were split into two one-way ANOVAs to analyze statistical differences due to the time after sham/ tMCAo at each time. Holm-Sidak was used as a post hoc test. To comply with homoscedasticity, some data were Log10 (G, K) or (Log10 + 1) transformed (I, J, M). In case that homoscedasticity was not achieved with the transformation, data were analyzed using a Kruskal-Wallis ranks test, followed by Dunn method as a post hoc test (I, J, M). (* and #) represent significance compared to sham and/or tMCAo at 6 h respectively. One symbol represents p < 0.05, two p < 0.01, and three p < 0.001. Only significant effects are shown. Scale bars: 500 μm (C); 50 μm, z = 18.9 μm (E); 14 μm, z = 16 μm (F).
Figure 2.
Figure 2.
Microglial phagocytosis after tMCAO in the striatum, cortex, and subventricular zone. (A) Representative confocal z-stacks of the cortex of sham-operated 2 mo fms-EGFP mice. Normal or apoptotic (pyknotic-karyorrhectic) nuclear morphology was visualized with DAPI (white), microglia b EGFP (cyan), and apoptosis was confirmed by activated CASP3 staining (magenta). Images show apoptotic cells (pyknotic-karyorrhectic and act-CASP3+) engulfed (arrows) by microglia (M) (EGFP+) (Ai, Aii). (B, C) Representative confocal z-stacks of the striatum of tMCAo-exposed 2 mo fms-EGFP mice after 24 h. Normal or apoptotic (pyknotic-karyorrhectic) nuclear morphology was visualized with DAPI (white), microglia by EGFP (cyan), and apoptosis was confirmed by act-CASP3 staining (magenta). Images show apoptotic cells (pyknotic-karyorrhectic and act-CASP3+) not-engulfed (arrowheads) by microglia (M) (EGFP+) (Bi, Bii) and apoptotic microglia (M*) (pyknotic-karyorrhectic, act-CASP3+, EGFP+) (C). (D, E) Quantification of microglial phagocytosis in the striatum and cortex. Apoptotic cells were scarce in the striatum and cortex in sham-operated control mice. To establish a baseline level of microglial phagocytosis in these regions, apoptotic cells from the striatum and cortex were combined with apoptotic cells from the subventricular zone, which were more abundant. (D) Number of apoptotic cells per mm3 analyzed in the striatum (str) and the combination of striatum, cortex and subventricular zone (all). (E) Ph index (% of apoptotic cells engulfed by microglia) in the striatum (str) or the combination of striatum, cortex and subventricular zone (all). Bars show mean ± SEM (D, E). n = 3–4 mice per group (D, E). Data were analyzed by Student’s t-test (D, E). * represents significance between tMCAo and sham (p < 0.05). Scale bars: 50 µm, z = 9 µm (Ai), 10 µm, z = 7 µm (Aii), 50 µm, z = 25 µm (Bi), 50 µm, z = 10 µm (Bii), 50 µm, z = 9 µm (C).
Figure 3.
Figure 3.
Microglial phagocytosis is impaired during HI. (A) Experimental design and representative confocal z-stack of the DG of 3 mo Cx3cr1-GFP Ccr2-RFP mice at 1 and 3 d under HI. Cell nuclei were visualized with DAPI (in white), microglia (Cx3cr1-GFP+, in cyan) and monocytes (Ccr2-RFP+, in red). (B) Representative confocal z-stack from the DG of a HI-treated mouse at 1 and 3 d showing apoptotic cells (arrowheads) non-phagocytosed by microglia (Cx3cr1-GFP+, in cyan; M), close to monocytes (Ccr2-RFP+, in red; Mo). (C) Orthogonal projection of a confocal z-stack from the septal DG of a HI-treated mouse at 3 d showing an apoptotic cell (arrow) phagocytosed by microglia (Cx3cr1-GFP+, in cyan; M). (D) Density of apoptotic cells (cells/mm3) in the septal DG under control and HI treatment. (E) Ph index in the septal DG (in % of apoptotic cells engulfed by microglia). (F) Type of microglial phagocytosis (% of “ball and chain” or “apposition” mechanism). (G) Weighted Ph capacity under control and HI conditions. (H) Histogram showing the Ph capacity of microglia (% of microglia with pouches). (I) Density of Cx3cr1-GFP+ microglia (cells/mm3) in the septal DG. (J) Ph/A coupling (in fold change) in the septal DG. Bars represent mean ± SEM. n = 5 (control), n = 3 (at 1 d) and n = 6 (at 3 d). Data were analyzed by one-way ANOVA, using Holm-Sidak as post hoc test. To comply with homoscedasticity, some data were Log10 (D, H) and/or Log10 + 1 (G) transformed. In the case that homoscedasticity was not achieved with a logarithmic transformation data were analyzed using a Kruskal-Wallis rank test, followed by Dunn method as a post hoc test (D, G). One (*) symbol indicates p < 0.05, and three p < 0.001 (vs control). Scale bars: 50 μm, z = 16 μm (A); 20 μm, z = 15 μm (B); 10 μm, z = 14 μm (C).
Figure 4.
Figure 4.
Microglial phagocytosis increases after CIR exposure. (A, B) Experimental design and representative confocal z-stacks of the DG of 3 mo Cx3cr1-GFP/Ccr2-RFP mice at 6 h and 1 d after CIR (8 Gy). Apoptotic nuclei were detected by pyknosis/karyorrhexis (in white, Hoechst), and microglia and blood-derived macrophages by the transgenic expression of Cx3cr1-GFP (in cyan) and Ccr2-RFP (in red), respectively. (C) Representative confocal z-stack of apoptotic cells (pyknotic-karyorrhectic, Hoechst, in white, arrow) phagocytosed by microglia (Cx3cr1-GFP+, in cyan; M) in the septal DG of sham and CIR-treated mice. (D) Density of apoptotic cells (cells/mm3) in the septal DG. (E) Ph index (% of apoptotic cells engulfed by microglia) in the septal DG. (F) Density of CX3CR1+ microglia (cells/mm3) in the septal DG. Bars represent mean ± SEM. In (C, D, E), n = 2 (sham) and n = 3 (at 6 h and 1 d). Data were analyzed by one-way ANOVA, using Holm-Sidak as a post hoc test. To comply with homoscedasticity some data were Log10 transformed (D). *** indicates p < 0.001 (vs CIR at 1 d). Scale bars: 50 µm, z = 21 µm (sham, 6 h), z = 17.5 µm (1 d) (B); 20 µm, z = 13.3 µm (sham), z = 18.9 µm (6 h) (C).
Figure 5.
Figure 5.
Microglial phagocytosis after tMCAo in Macaca fascicularis and Callithrix jacchus. (A) Experimental design of tMCAo in Macaca fascicularis. Data from these animals were previously published here [80]. (B) Epifluorescent image of the cerebral cortex of Macaca fascicularis showing DAPI (nuclei, white) and P2RY12 (microglia, in cyan). (C) Representative confocal z-stacks of the cortical regions of macaques at 30 d after tMCAo from the contralateral (Ci, Cii) or ipsilateral (Ciii, Civ) hemispheres. Cell nuclei were visualized with DAPI (in white) and microglia with P2RY12 (in cyan). Arrows and arrowheads point to phagocytosed (Ci, Ciii) and non-phagocytosed apoptotic cells (Cii, Civ), respectively. (D) Number of apoptotic cells per mm3 in the ipsi- and contralateral hemispheres. (E) Table summarizing the behavioral impairment (neuroscore; higher numbers indicate more impairment) at days (D) 1 and 7 after the tMCAo, and the infarct size determined by magnetic resonance imaging [80]. (F) Ph index (% of apoptotic cells engulfed by microglia) in the ipsi- and contralateral hemispheres. (G) Correlation between apoptosis and Ph index in the ipsi- (light blue) and contralateral (grey) hemispheres of the three macaques. The regression line, the regression coefficient R2, and the adjusted p-value are shown. (H) Experimental design of tMCAo in Callithrix jacchus and low magnification epifluorescent image of common marmoset brain showing nuclei (DAPI, white), microglia (AIF1/IBA1, in cyan), neurons (RBFOX3/NeuN, in magenta), and astrocytes (GFAP, in red). (I) Representative confocal z-stacks of the cortical regions (Ii, Iii) and hippocampus (Iiii) of marmosets at 45 d after tMCAo showing phagocytosed (arrow) and non-phagocytosed (arrowheads) apoptotic cells. M, microglia. (J) Table summarizing the number of apoptotic cells (total and phagocytosed by microglia) in the three marmosets analyzed. ND, not-detected. NA, not applicable. Scale bars: 5 mm (B); 20 μm (C), z = 18.9 μm (Ci), 14.1 μm (Cii), 14.1 μm (Ciii), 15.4 μm (Civ); 1 mm (H); 20 μm, z = 19.6 μm (Ii, Iii); 20 μm, z = 23.8 μm (Iiii). RBFOX3/NeuN: RNA-binding fox homolog 3; GFAP: glial fibrillary acidic protein.
Figure 6.
Figure 6.
Engulfment of apoptotic cells is impaired after OND in hippocampal organotypic slices due to alterations in motility. (A) Experimental design showing the exposure of hippocampal organotypic slices (fms-EGFP) to OND (3 and 6 h) in the presence and absence of 1 h reperfusion (Ai). Representative confocal images of the DG after OND (Aii). Normal or apoptotic (pyknotic-karyorrhectic) nuclear morphology was visualized with DAPI (white) and microglia by the transgenic expression of fms-EGFP (cyan). High magnification images show apoptotic cells (pyknotic-karyorrhectic) engulfed (arrows) or not-engulfed (arrowheads) by microglia (M) (EGFP+) (A3). High magnification images for reperfusion experiments in Aii are shown in Fig. S4A. (B) Number of apoptotic cells in 200,000µm3 of the DG. (C) Ph index (% of apoptotic cells phagocytosed by microglia). (D) Number of microglia in 200,000 µm3 of the DG. (E) Ph/A coupling expressed as fold-change; ratio between net phagocytosis and total levels of apoptosis. (F) Weighted Ph capacity (number of phagocytic pouches containing an apoptotic cell per microglia, in parts per unit (ppu). (G, H) Ph capacity histogram after OND in non-reperfused (G) and reperfused (H) conditions. (I) Representative projections of 2-photon images of microglial cells at t0 (cyan) and t9 (magenta) from hippocampal organotypic slices (Cx3cr1GFP/+) under control and OND conditions. (J, K, L) Microglial process motility: protraction (J), retraction (K), and process velocity (L). Bars show mean ± SEM (B-H). Violin plots show the data distribution including extreme values; lower and upper hinges correspond to the first and third quartile respectively (J-L). n = 6–10 mice per group (B-H); n = 355 processes from 98 cells from 12 animals (control), and n = 222 processes from 57 cells from 9 animals (OND) (J-L). Data were analyzed by two-way ANOVA followed by Holm-Sidak post hoc tests (B, D). When an interaction between factors was found, one-way ANOVA (factor: treatment) was performed followed by Holm-Sidak post hoc tests (C, E, F). To comply with homoscedasticity, some data were Log10 transformed (B) or Ln transformed (F). Other data were analyzed by Kruskal-Wallis rank test (J-L). (* and #) represent significance between control and OND, or no reperfusion vs reperfusion, respectively: one symbol represents p < 0.05, two symbols represent p < 0.01, three symbols represent p < 0.001, and four symbols represent p < 0.0001; (a) represents p = 0.06 and (b) represents p = 0.07 (control vs OND). Scale bars: 50 µm, z = 10.5 µm (Aii); 15 µm, z = 11.9 µm (Aiii), 20 µm, z = 22 μm (I).
Figure 7.
Figure 7.
Degradation of apoptotic cells is impaired after OND in primary microglia due to alterations in lysosomal function. (A) Experimental design of the phagocytosis assay to assess engulfment and degradation of apoptotic cells under control and OND conditions. Representative images of primary microglia fed with apoptotic SH-SY5Y VAMPIRE cells during engulfment and degradation. Nuclei were visualized with DAPI (white), microglia by expression of EGFP (cyan), and SH-SY5Y neurons by expression of the red fluorescent protein VAMPIRE. (B, C) Percentage of phagocytic microglia after engulfment (1 h) and degradation (3 h after engulfment). Only particles fully enclosed by microglia were identified as being phagocytosed. Raw % of phagocytic microglia are shown in Fig. S4B. Phagocytosis under more stringent conditions (shorter incubation, fewer apoptotic cells) is shown in Fig. S4C. (D) Summary of the experimental groups. (E) Representative confocal images of microglia incubated with dextran molecules conjugated to two fluorophores: FITC (pH sensitive) and TRITC (pH stable) located in the lysosomes, whose ratio serves as an indirect measurement of the lysosomal pH. (F) Lysosomal pH expressed as % normalized to control values. Note the truncated Y axis. (G) Representative confocal images of microglia loaded with the self-quenched substrate. (H) Percentage of lysosomal numbers normalized to control values under control and OND conditions. (I) Percentage of the area occupied by lysosomes, referred to control values. (J) Mean intensity (representative of lysosomal activity) represented in arbitrary units and referred to control values. Bars show mean ± SEM (B, C, H-J). Violin plot shows the data distribution including extreme values; lower and upper hinges correspond to the first and third quartile respectively (F); n = 3 independent experiments (B, C); n = 530 cells (control) and 452 cells (OND) from 4 independent experiments (F). n = 4 independent experiments (H-J). Data were analyzed by Student´s t-test (B, C, F, H-J). (*) one symbol represents p < 0.05, two symbols represent p < 0.01, three symbols represent p < 0.001, and four symbols represent p < 0.0001. Scale bars: 5 µm, z = 8.5 μm (A), 7 µm (E); 50 µm low magnification, 5 µm high magnification, z = single plane (G).
Figure 8.
Figure 8.
Autophagy flux is induced in microglia after tMCAo and OND. (A) Representative confocal images of the DG of 2 mo fms-EGFP mice exposed to sham and tMCAo surgery at 6 h and 1 d. LC3 present in autophagosomes was immunostained and observed as puncta (yellow). Microglia were visualized by the transgenic expression of fms-EGFP (cyan) and cellular nuclei were identified by DAPI (white). SQSTM1 (Ai) and LAMP1 (Aii) were immunostained and visualized as puncta (magenta). (B) Number of LC3 puncta normalized to microglial cytoplasmic area (LC3 puncta number/µm2) in sham and tMCAo (6 h and 1 d) mice. (C) Total area of LC3 puncta normalized to microglial cytoplasmic area (LC3 puncta area/µm2) in sham and tMCAo (6 h and 1 d) mice. (D) Number of LC3 and SQSTM1 puncta that colocalize normalized to microglial cytoplasmic area (LC3-SQSTM1 puncta number colocalization/µm2) in sham and tMCAo (6 h and 1 d) mice. (E) Number of LC3 and LAMP1 puncta that colocalize normalized to microglial cytoplasmic area (LC3-LAMP1 puncta number colocalization/µm2) in sham and tMCAo (6 h and 1 d) mice. (F) Number of SQSTM1 puncta normalized to microglial cytoplasmic area (SQSTM1 puncta number/µm2) in sham and tMCAo (6 h and 1 d) mice. (G) Number of LAMP1 puncta normalized to microglial cytoplasmic area (LAMP1 puncta number/µm2) in sham and tMCAo (6 h and 1 d) mice. (H) Quantified total SQSTM1 puncta area normalized by microglial cytoplasmic area (SQSTM1 puncta area/µm2) (Hi), the colocalized area of LC3 and SQSTM1 puncta normalized by microglial cytoplasmic area (colocalized LC3-SQSTM1 puncta area/µm2) (Hii), total LAMP1 puncta area normalized by microglial cytoplasmic area (LAMP1 puncta area/µm2) (Hiii), and the colocalized area of LC3 and LAMP1 puncta normalized by microglial cytoplasmic area (colocalized LC3-LAMP1 puncta area/µm2) (Hiv). (I) Experimental design used to transfect BV2 microglia-like cells with the fluorescent tandem mRFP-GFP-LC3 to assess autophagy flux in control conditions (C) and after OND (3 h) or rapamycin (Rapa, 100 nM, 6 h) treatments. Representative confocal images of control, OND and rapamycin treated microglia. Nuclei are stained with DAPI (white), autophagosomes and autolysosomes are differentiated according to the tandem expression (yellow and red, respectively). (J) GFP:RFP mean fluorescence intensity ratio, indicative of autophagy flux. (K) Mean RFP fluorescence intensity (Ki), mean GFP fluorescence intensity (Kii), total number of puncta (Kiii), and area occupied by puncta (Kiv) per cell and normalized to control conditions (expressed as % change versus control conditions). Bars show mean ± SEM (B-H). Violin plots show the data distribution, including extreme values; lower and upper hinges correspond to the first and third quartile, respectively (J, K). n = 4 mice per experimental condition (B-H); n = 12–17 cells from 3 independent experiments (J, K). Data were analyzed by one-way ANOVA followed by Holm-Sidak post hoc test (B-H), Bonferroni post hoc test (J); by Kruskal-Wallis one- way ANOVA on ranks followed by Dunn’s multiple comparisons (K). * represents significance between sham or control and tMCAo, OND or rapamycin: one symbol represents p < 0.05, two symbols represent p < 0.01 and three symbols represent p < 0.001. Scale bars: 20 µm, z = 20 µm (A); 10 µm, z = 1.9 µm (control), 3.3 µm (OND), and 3.9 µm (rapamycin) (I).
Figure 9.
Figure 9.
Complementary autophagy analysis in microglial cultures after OND. (A) Primary microglia were exposed to OND for 3 h in the presence and absence of bafilomycin A1 (BAF, 100 nM, 3 h) to assess autophagy flux by LC3 turnover assay. Delipidated (~1 KDa) and lipidated (~17 KDa) LC3 levels were analyzed by western blot. ACTB (~42 KDa) was used as a loading control. Representative blots showing LC3-I, LC3-II and ACTB bands (Ai), LC3-I levels normalized to ACTB (Aii), LC3-II levels normalized to ACTB (Aiii), LC3-II levels normalized to LC3-I levels (Aiv). (B) BV2 cells were exposed to OND for 3 h in the presence and absence of bafilomycin A1 (BAF, 100 nM, 3 h) to assess autophagy flux by LC3 turnover assay. Delipidated (~1 KDa) and lipidated (~17 KDa) LC3 levels were analyzed by western blot. ACTB (~42 KDa) was used as loading control. Representative blots showing LC3-I, LC3-II and ACTB bands (Bi), LC3-I levels normalized to ACTB (Bii), LC3-II levels normalized to ACTB (Biii), LC3-II levels normalized to LC3-I levels (Biv). (C) Details of autophagic-like vesicles identified as containing at least a portion of double membrane with different types of cargo (granular, membranous, heterogeneous). (D) Details of lysosomal-like vesicles identified as electron-dense vesicles with single or double membrane. (E) Representative TEM images of primary microglia in control and OND conditions. Ly: lysosomes; AP-Gr: autophagosomes with granular cargo (yellow); AP-M: autophagosomes with membranous cargo (Orange). (F-H) Quantification of autophagic-like vesicle number per µm2 (F), size in µm2 (in logarithmic scale) (G), and percentage of cytoplasm occupied (H). (I-K) Quantification of lysosomal-like vesicle number per µm2 (I), size in µm2 (in logarithmic scale) (J), and percentage of cytoplasm occupied (K). Bars show mean ± SEM (A, B). Violin plots show the data distribution, including extreme values; lower and upper hinges correspond to the first and third quartile, respectively (F-H, I-K). n = 4 independent experiments (A); n = 3 independent experiments (B); n = 36–38 cells from 3 independent experiments (F-H, I-K). Data were analyzed by two-way ANOVA followed by Holm-Sidak post hoc test (A). When a trend for a significant interaction between factors was found (Aiii, OND x BAF interaction: p = 0.08), one-way ANOVA (factor: treatment) was performed followed by Holm-Sidak post hoc test (Aiii). To comply with homoscedasticity some data were square root (Aiii) or Log10 transformed (Aiv). Data were analyzed by two-way ANOVA followed by Holm-Sidak post hoc test (B). When a trend for a significant effect of factors was found (Biii, OND factor: p = 0.067), analysis was followed by Holm-Sidak post-hoc tests (Biii). When an interaction between factors was found, one-way ANOVA (factor: treatment) was performed followed by Holm-Sidak post hoc tests (Biv). Data were analyzed by one-way ANOVA followed by non-parametric Mann-Whitney test (F-H, I-K) (* and #) represent significance: one symbol represents p < 0.05, two symbols represent p < 0.01 and three symbols represent p < 0.001. Scale bars: 500 nm (C, D); 2 µm (control), 5 µm (OND), 500 nm (high magnification) (E).
Figure 10.
Figure 10.
Basal autophagy is essential for microglial survival and function. (A) Representative confocal z-stacks of the DG of 3 mo WT and atg4b KO mice. Healthy or apoptotic nuclei (pyknotic-karyorrhectic) were visualized with DAPI (white) and microglia were stained for AIF1/IBA1 (cyan). A cartoon representing the proteins involved in the autophagic response is shown in Fig. S5A. Phagocytosis in Tmem119-becn1 iKO and Ambra1± mice are shown in in Fig. S5B-E and F-I, respectively. (B) High magnification examples of phagocytosed (arrows) and nonphagocytosed (arrowheads) apoptotic cells. (C) Number of apoptotic cells per septal hippocampus in WT and atg4b KO mice. (D) Ph index in the septal hippocampus (% of apoptotic cells engulfed by microglia). (E) Number of microglial cells per septal hippocampus in WT and atg4b KO mice. (F) Experimental design of the dose-response administration of ULK1-ULK2 inhibitor MRT68921 to primary microglia. Representative blot showing relative levels of LC3-I and LC3-II after 1 and 10 μM MRT68921 administration for 6 h. Quantification of the LC3-II levels (referred to ACTB) after 1 and 10 μM MRT68921 in the presence and absence of the lysosomal inhibitor, bafilomycin A1 (BAF, 100 nM). The quantification of LC3-I is shown in Fig. 6SA, B. The analysis of LC3-I and II after 3 h of MRT68921 (10 and 30 μm) is shown in Fig. S6C. This data is reprinted with permission from Frontiers in Immunology [41]. (G) Representative confocal images of primary fms-EGFP microglia treated with MRT68921 (10 and 30 μM). Nuclei were visualized with DAPI (white), microglia with their constitutive EGFP expression (cyan), and apoptotic cells with activated CASP3 (act-CASP3+, magenta). Images of all experimental groups are shown in Fig. S6D. (H) Percentage of apoptotic microglia assessed by their healthy or apoptotic nuclei (pyknotic-karyorrhectic). (I) Representative confocal images of naïve (non-phagocytic), engulfing and degrading fms-EGFP microglia (cyan), after the addition of apoptotic SH-SY5Y vampire with RFP (red); nuclear morphology (pyknotic-karyorrhectic) was assessed with DAPI (white). A table summarizing the treatments is shown in Fig. S7A. (J, K) Percentage of phagocytic microglia after engulfment (1 h) and degradation (6 h after engulfment). Only particles fully enclosed by microglia were identified as phagocytosis. Raw % of phagocytic microglia is shown in Fig. S7B and the % of apoptotic microglia is shown in Fig. S7C. (L) Experimental design and representative confocal images of the DG after treatment with MRT68921 (100 µM) for 3 h in the presence and absence of OND. Normal or apoptotic (pyknotic-karyorrhectic) nuclear morphology was visualized with DAPI (white) and microglia by the transgenic expression of fms-EGFP (cyan). (M) Number of apoptotic cells in 200,000 µm3 of the DG. (N) Number of apoptotic microglia. Apoptotic microglia were discriminated from apoptotic cells contained in microglial pouches thanks to their expression of EGFP within the nuclei and the lack of a process connecting it to a healthy microglial soma. An example is shown in Fig. S7D. (O) Ph index (% of apoptotic cells phagocytosed by microglia). (P) Number of microglia in 200,000 µm3 of the DG. The weighted Ph capacity and distribution, and the Ph/A coupling are shown in Fig. S7E-G. Bars show mean ± SEM. n = 4–6 mice per group (C-E), n = 3 independent experiments (F, H, J, K), n = 3–6 mice per group (M, N, O, P). Data were analyzed using Student´s t-test analysis (C-E, J-K), by two-way ANOVA followed by Holm-Sidak post hoc tests (F) after logarithmic transformation (M, O, P), or by one-way ANOVA followed by Tukey´s multiple comparisons (H). (&) represents significance between bafilomycin A1 treated and non-treated groups: one symbol represents p < 0.05 and two symbols represent p < 0.01. (* and #) represent significance compared to the control group and between MRT-treated vs MRT-untreated, respectively: one symbol represents p < 0.05, two symbols represent p < 0.01, three symbols represent p < 0.001 and four symbols represent p < 0.0001; (a) represents significance between MRT-treated vs MRT-untreated groups in control conditions; p = 0.051 (H), p = 0.1080 (K), p = 0.055 (O) and p = 0.127 (P). Scale bars = 50 μm, z = 36.4 μm (A); 10 μm (B); 50 μm, z = 8.5 μm (G, I); 50 µm and z = 11.2 µm (L).
Figure 11.
Figure 11.
Rapamycin reverts the tMCAo-induced phagocytic dysfunction in vivo but not in vitro. (A) Experimental design showing the daily administration of rapamycin (10 mg/kg, ip) two days prior to the tMCAo in 2 mo fms-EGFP mice. Mice received a third rapamycin injection right after reperfusion, and were sacrificed 6 h later. (B) Representative laser Doppler signal graph showing the effective MCA occlusion and reperfusion in both vehicle and rapamycin-treated mice. (C) Representative confocal z-stacks of the DG of fms-EGFP mice 6 h after tMCAo, treated with vehicle or rapamycin (10 mg/kg, ip). Cell nuclei were visualized with DAPI (in white) and microglia (fms-EGFP+, in cyan). Arrowheads point to non-phagocytosed apoptotic cells and arrows to phagocytosed apoptotic cells. M labels a microglial soma. (D) Density of apoptotic cells in the septal hippocampus. (E) Density of microglial cells in the septal hippocampus. (F) Ph index in the septal hippocampus (% of apoptotic cells engulfed by microglia). (G) Normalized ratio of Ph index change in each rapamycin-treated mice over its same day vehicle-treated mice. (H) Experimental design and representative confocal images of hippocampal organotypic cultures treated with vehicle or rapamycin (200 nM; 6 and 24 h) exposed to OND (3 h). Normal or apoptotic (pyknotic-karyorrhectic) nuclear morphology was visualized with DAPI (white) and microglia by the transgenic expression of fms-EGFP (cyan). Rapamycin- and vehicle- treated control cultures are shown in Fig. S8A. (I) Number of apoptotic cells in 200,000 µm3 of the DG. (J) Ph index (% of apoptotic cells phagocytosed by microglia). The weighted Ph capacity and the Ph/A coupling are shown in Fig. S8B, C. (K) Number of microglia in 200,000 µm3 of the DG. (L) Representative confocal images of microglia (fms-EGFP+, cyan) engulfing (1 h) and degrading (3 h) apoptotic SH-SY5Y VAMPIRE neurons (red) under OND conditions in the presence of rapamycin. Nuclear morphology was assessed with DAPI (white). Only particles fully enclosed by microglia were identified as phagocytosis. A table summarizing the treatments is shown in Fig. S8D, the effect of rapamycin in LC3 levels is shown in Fig. S8E, and control cells are shown in Fig. S8F. (M, N) Percentage of phagocytic microglia after engulfment (1 h) and degradation (3 h after engulfment). (O) Percentage of apoptotic (pyknotic-karyorrhectic) microglia after the phagocytosis assay and rapamycin treatment in both control and OND. Bars show mean ± SEM. Dot and line plot represents the normalized ratio between rapamycin- and vehicle-treated animals (by pairs). n = 6 mice per group (D-G), n = 8 mice per group (I-K), and n = 4 independent experiments (M-O). Data were analyzed using a Student´s t-test (D-G); by two-way ANOVA followed by Holm-Sidak post hoc tests when appropriate (I-K, M-N); or by one-way ANOVA followed by Tukey´s post hoc test when a significant interaction in two-way ANOVA was found (O). Some data (I) was Log10 transformed to comply with homoscedasticity. Asterisks represent significance between untreated and rapamycin-treated mice or cultures: (*) represents p < 0.05. (#) represent significance between OND and control cultures: # represents p < 0.05, and ### represents p < 0.001. Scale bars = 50 µm, z = 19.6 µm; inserts bar = 10 µm z = 9.8 µm (C); 50 µm, z = 11.2 µm (H); 50 µm, z = 8.5 µm (L).
Figure 12.
Figure 12.
Microglial phagocytosis of apoptotic cells was impaired in mouse and macaque models of stroke induced by tMCAo. This impairment was related to the lack of oxygen and nutrients, which lead to reduced process motility, possibly related to the decreased engulfment; and reduced lysosomal numbers and increased pH, possibly related to the decreased degradation in primary and hippocampal organotypic cultures. In vivo tMCAo and in vitro energetic depletion also induced a protective autophagy response, possibly related to the lysosomal depletion. The maintenance of basal autophagy was critical for microglial survival and phagocytosis, as shown in mice that lacked expression of autophagy genes such as atg4b KO or Tmem119-becn1 iKO mice, or in primary and organotypic cultures treated with the ULK1-ULK2 inhibitor MRT68921. While the autophagy inducer rapamycin did not improve the phagocytosis blockade in vitro, it was effective in preventing the phagocytosis impairment induced by tMCAo, supporting the possibility of pharmacological modulation of microglial phagocytosis in vivo.

Similar articles

Cited by

References

    1. Collaborators GBDS, Nguyen M, Roth GA.. Global, regional, and national burden of stroke, 1990-2016: a systematic analysis for the global burden of disease study 2016. Lancet Neurol. 2019. May;18(5):439–458. - PMC - PubMed
    1. Iadecola C, Buckwalter MS, Anrather J. Immune responses to stroke: mechanisms, modulation, and therapeutic potential. J Clin Invest. 2020. Jun 1;130(6):2777–2788. - PMC - PubMed
    1. Ma Y, Wang J, Wang Y, et al. The biphasic function of microglia in ischemic stroke. Prog Neurobiol. 2017. Oct;157:247–272. - PubMed
    1. Lalancette-Hebert M, Gowing G, Simard A, et al. Selective ablation of proliferating microglial cells exacerbates ischemic injury in the brain. J Neurosci. 2007. Mar 7;27(10):2596–2605. - PMC - PubMed
    1. Jin WN, Shi SX, Li Z, et al. Depletion of microglia exacerbates postischemic inflammation and brain injury. J Cereb Blood Flow Metab. 2017. Jun;37(6):2224–2236. - PMC - PubMed

Publication types