. 2023 Feb;614(7949):659-663.
doi: 10.1038/s41586-022-05677-y. Epub 2023 Jan 9.

Early Release Science of the exoplanet WASP-39b with JWST NIRSpec PRISM

Z Rustamkulov  1 D K Sing  2   3 S Mukherjee  4 E M May  5 J Kirk  6   7 E Schlawin  8 M R Line  9 C Piaulet  10 A L Carter  4 N E Batalha  11 J M Goyal  12 M López-Morales  6 J D Lothringer  13 R J MacDonald  14   15 S E Moran  16 K B Stevenson  5 H R Wakeford  17 N Espinoza  18 J L Bean  19 N M Batalha  4 B Benneke  10 Z K Berta-Thompson  20 I J M Crossfield  21 P Gao  22 L Kreidberg  23 D K Powell  24 P E Cubillos  25 N P Gibson  26 J Leconte  27 K Molaverdikhani  28   29 N K Nikolov  18 V Parmentier  30   31 P Roy  10 J Taylor  32 J D Turner  15 P J Wheatley  33   34 K Aggarwal  35 E Ahrer  33   34 M K Alam  22 L Alderson  17 N H Allen  3 A Banerjee  36 S Barat  37 D Barrado  38 J K Barstow  36 T J Bell  39 J Blecic  40   41 J Brande  21 S Casewell  42 Q Changeat  18   43   44 K L Chubb  45 N Crouzet  46 T Daylan  47 L Decin  48 J Désert  37 T Mikal-Evans  23 A D Feinstein  19   36 L Flagg  15 J J Fortney  4 J Harrington  49 K Heng  28 Y Hong  15 R Hu  50   51 N Iro  52 T Kataria  50 E M-R Kempton  53 J Krick  54 M Lendl  55 J Lillo-Box  38 A Louca  46 J Lustig-Yaeger  5 L Mancini  23   25   56 M Mansfield  8 N J Mayne  57 Y Miguel  46   58 G Morello  59   60   61 K Ohno  4 E Palle  59 D J M Petit Dit de la Roche  55 B V Rackham  62   63 M Radica  10 L Ramos-Rosado  3 S Redfield  64 L K Rogers  65 E L Shkolnik  9 J Southworth  66 J Teske  22 P Tremblin  67 G S Tucker  68 O Venot  69 W C Waalkes  70 L Welbanks  9 X Zhang  71 S Zieba  23   46
Affiliations

Early Release Science of the exoplanet WASP-39b with JWST NIRSpec PRISM

Z Rustamkulov et al. Nature. 2023 Feb.

Abstract

Transmission spectroscopy1-3 of exoplanets has revealed signatures of water vapour, aerosols and alkali metals in a few dozen exoplanet atmospheres4,5. However, these previous inferences with the Hubble and Spitzer Space Telescopes were hindered by the observations' relatively narrow wavelength range and spectral resolving power, which precluded the unambiguous identification of other chemical species-in particular the primary carbon-bearing molecules6,7. Here we report a broad-wavelength 0.5-5.5 µm atmospheric transmission spectrum of WASP-39b8, a 1,200 K, roughly Saturn-mass, Jupiter-radius exoplanet, measured with the JWST NIRSpec's PRISM mode9 as part of the JWST Transiting Exoplanet Community Early Release Science Team Program10-12. We robustly detect several chemical species at high significance, including Na (19σ), H2O (33σ), CO2 (28σ) and CO (7σ). The non-detection of CH4, combined with a strong CO2 feature, favours atmospheric models with a super-solar atmospheric metallicity. An unanticipated absorption feature at 4 µm is best explained by SO2 (2.7σ), which could be a tracer of atmospheric photochemistry. These observations demonstrate JWST's sensitivity to a rich diversity of exoplanet compositions and chemical processes.


Conflict of interest statement

The authors declare no competing interests.

Figures

Fig. 1
Fig. 1. The light curve of WASP-39b observed by JWST NIRSpec PRISM.
a, The normalized white light curve created by integrating over all wavelengths using the FIREFLy reduction. b, The binned time series (with 30 integrations per time bin) of the relative flux for each wavelength. A constant 200 ppm per hour linear trend through time has been removed from the white light curve and each spectral channel for visual clarity.
Fig. 2
Fig. 2. Normalized spectrophotometric light curves for the JWST-PRISM transit of WASP-39b.
The light curves were created by summing over wide wavelength channels (wavelength ranges indicated on the plot). Overplotted on each light curve are their best-fit models, which include a transit model and detector systematics. Light curve systematics have not been removed from the data.
Fig. 3
Fig. 3. WASP-39b transmission spectral measurements.
A comparison of the JWST transmission spectra obtained from the four independent reductions considered in this work (coloured points), which are all in broad agreement. Previous measurements from HST, VLT and Spitzer are also shown (grey) along with our fiducial best-fit spectrum model from the PICASO 3.0 grid (black line). All the transmission spectral data have 1 − σ error bars shown. The saturated region of the detector is indicated (grey bar) with the shading representative of the level of saturation (also Extended Data Fig. 6). Different reductions are presented on slightly different wavelength grids for visual purposes, the original resolution each reduction used is discussed in the Methods.
Fig. 4
Fig. 4. The JWST-PRISM transmission spectrum of WASP-39b with key contributions to the atmospheric spectrum.
The black points with error bars correspond to the measured FIREFLy transit depths of the spectrophotometric light curves at different wavelengths. The best-fitting model spectrum from the PICASO 3.0 grid is shown as the grey line and the coloured regions correspond to the chemical opacity contributions at specific wavelengths. The best-fitting 1D RCTE model corresponds to a super-solar metallicity and super-solar carbon-to-oxygen ratio with moderate cloud opacity (Methods). The PRISM transmission spectrum is explained by contributions from Na (19σ), H2O (33σ), CO2 (28σ), CO (7σ), SO2 (2.7σ) and clouds (21σ). The data do not provide evidence of CH4, H2S and K absorption (Methods). Also, note that the detector was saturated to varying degrees between 0.8 and 1.9 µm. As before, the error bars are 1 − σ standard deviations.
Extended Data Fig. 1
Extended Data Fig. 1. A comparison of the extracted 1D spectrophotometry across the four reductions.
Plotted is the spectrophotometry with time on the x-axis and wavelength on the y-axis, with color indicating the relative flux. The transit is visible as a dark band in the middle of the observation. All four reductions show nearly identical noise properties.
Extended Data Fig. 2
Extended Data Fig. 2. Demonstration of the impact of saturation.
Shown are the group-level median frames from the uncalibrated data products across the entire integration. The dashed blue line represents the empirically derived saturation level, with the orange dotted line representing 85% saturation, the level adopted in the Eureka! reduction. Grey shaded regions represent columns that reach 85% full well in a given group.
Extended Data Fig. 3
Extended Data Fig. 3. The wavelength-dependent central transit time in seconds.
Structure is apparent–the prominent water and carbon dioxide absorption features at 2.7 µm and 4.2 µm, respectively, appear to arrive ∼20 s after the optical continuum. A slope is also apparent from the blue side to the red. The error bars are 1-σ standard deviations.
Extended Data Fig. 4
Extended Data Fig. 4. A summary of the positional shifts of the trace, the wavelength-dependent light curve scatter, and the transit depth noise.
(Top) The X- and Y-shift vectors as measured by 1D cross correlation with FIREFLy. (Middle) The residual spectrophotometric light curves are shown for four representative spectral channels spanning the PRISM wavelength range with no temporal binning. The residual scatter is approximately Gaussian for each, as indicated by the histogram on the right y-axis. We validate this by performing Anderson-Darling tests on the residuals of the spectral and white-light curves, and find that all of the Anderson-Darling test statistics lie below the respective critical values 1% significance level. Therefore, we find that there is not sufficient evidence that the residuals are not normally distributed. (Bottom) The top two purple curves show the expected and measured normalised light curve root mean square (RMS) residuals, with no temporal binning. Longward of 2 µm, the scatter in each light curve matches well with the expected noise as estimated by the jwst pipeline, which is dominated by photon noise. This agreement indicates the majority of the light curves reach near the photon limit. The transit depth uncertainties are also plotted below, including the white noise (blue, σw), red noise (red, σred), and total noise components (grey, σtot). Some wavelength bins have enhanced red noise, but the majority of the transmission spectrum is consistent with minimal red noise from residual systematic errors. The wavelengths affected by detector saturation are indicated by the grey shaded bar, with darker colors corresponding to quicker saturation. The colored dots are the measured RMS values from the light curves shown in the top panel.
Extended Data Fig. 5
Extended Data Fig. 5. Empirically derived stellar limb darkening coefficients fit with a quadratic law.
a, the fit u+ coefficients (black) along with the theoretically predicted values derived from a 3D stellar model (red). The theoretical u+ values with a constant offset of −0.065 ± 0.022 (purple) is also shown. The theoretical models predict the wavelength-to-wavelength shape of u+ well. As u+ is directly related to the intensity of the star at the stellar limb ref. , these findings suggest WASP-39A is 6% brighter at the limb than models predict. b, similar as a, but for the u coefficient. As the shape of the derived coefficients differs from the model prediction, u was left free to vary in the transmission spectral fits. The error bars are 1-σ standard deviations.
Extended Data Fig. 6
Extended Data Fig. 6. Comparison of the JWST NIRSpec PRISM data (black) to HST and VLT data from ref. , and WHT data from ref. , respectively.
The JWST spectrum was derived with the limb darkening fixed to the same 3D stellar model as in to aid comparisons. With fixed limb darkening, the JWST transmission spectrum has lower overall transit depths especially at optical wavelengths. The broadband spectrum from the two space telescopes compares well, including the amplitude of the 1.4 µm water feature first observed by HST/WFC3 and the Na feature near 0.6 µm observed by HST/STIS. The error bars are 1-σ standard deviations.
Extended Data Fig. 7
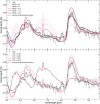
Extended Data Fig. 7. Best-fit models from ScCHIMERA, PICASO 3.0, ATMO, and Phoenix 1D RCTE model grids for WASP-39b.
The FIREFLy reduction is overlaid in the top panel. The top left inset panel shows the data and the models between 0.5—1.2 µm. All these models prefer super-solar atmospheric metallicities and cloudy atmospheres for WASP-39 b. The C/O ratio estimated by these models lies in the range 0.6– 0.7. Additional SO2 was injected in the PICASO 3.0 and ScCHIMERA grids to estimate the abundance of SO2 required to explain the 4.0 µm feature, in a Bayesian framework. The ATMO and PHOENIX models are shown without any additionally injected SO2 to emphasize that RCTE models do not predict such an SO2 feature and chemical disequilibrium effects are required to explain the observed feature. The bottom panel shows the residuals from each best-fit model divided by the noise in the transit depth as a function of wavelength. The error bars are 1-σ standard deviations.
Extended Data Fig. 8
Extended Data Fig. 8. Each panel shows the residual spectrum of a particular gas.
This residual spectrum was obtained by removing one gas at a time from the best-fit model atmosphere and subtracting the recalculated model transmission spectrum without that gas from the data. This residual spectrum was then fitted with a Gaussian distribution (and a Voigt profile for Na) and a constant offset, in a Bayesian framework. The median fit (solid lines) along with the 1σ and 2σ confidence intervals are shown with shaded red and blue regions for the Gaussian fits and the constant offset fits, respectively. The Bayes factor between the two functional fits was used to determine the detection significance of each gas. Note that the wavelength range covered in each panel is different. The error bars are 1-σ standard deviations.
Extended Data Fig. 9
Extended Data Fig. 9. Models of varying metallicity (top) and C/O ratio (bottom) compared to the FIREFLy reduction.
A comparison of cloud-free PICASO 3.0 RCTE models across a span of metallicities with the best-fit C/O ratio (0.68) is shown in the top panel. Each line coloured from faded to deep pink represents models with different metallicities between sub-solar to super-solar values. The simultaneous lack of a prominent CH4 feature at 2.3 and 3.3 µm and the presence of a strong CO2 feature indicate that the observations disfavor a low-metallicity atmosphere. The bottom panel shows transmission spectrum models with different C/O ratios from sub-solar to super-solar values at 10×solar metallicity compared with the observed spectrum. The cloudy best-fit model obtained with the grid retrieval framework also has been shown in both the panels with the grey line. As before, the errorbars are 1σ standard deviations.
Extended Data Fig. 10
Extended Data Fig. 10. The wavelength-dependent contribution function.
The shaded regions highlight the parts of the atmosphere probed by the observed transmission data as a function of wavelength, as calculated from the best-fit model. This shows that the data mostly probe pressure ranges between 0.1 to 2 mbars. The CO2 feature shows contribution at pressures approaching a microbar. The various shaded lines in pink show the volume mixing ratio of CH4 (upper x-axis), from thermochemical equilibrium models, with different atmospheric metallicities at the best-fit C/O ratio of 0.68.

Comment in

  • JWST opens a window on exoplanet skies.
    Seidel JV, Nielsen LD, Sarkar S. Seidel JV, et al. Nature. 2023 Feb;614(7949):632-633. doi: 10.1038/d41586-023-00394-6. Nature. 2023. PMID: 36792896 No abstract available.

References

    1. Seager S, Sasselov DD. Theoretical transmission spectra during extrasolar giant planet transits. Astrophys. J. 2000;537:916–921. doi: 10.1086/309088. - DOI
    1. Brown TM. Transmission spectra as diagnostics of extrasolar giant planet atmospheres. Astrophys. J. 2001;553:1006–1026. doi: 10.1086/320950. - DOI
    1. Hubbard WB, et al. Theory of extrasolar giant planet transits. Astrophys. J. 2001;560:413–419. doi: 10.1086/322490. - DOI
    1. Sing DK, et al. A continuum from clear to cloudy hot-Jupiter exoplanets without primordial water depletion. Nature. 2016;529:59–62. doi: 10.1038/nature16068. - DOI - PubMed
    1. Zhang X. Atmospheric regimes and trends on exoplanets and brown dwarfs. Res. Astron. Astrophys. 2020;20:099. doi: 10.1088/1674-4527/20/7/99. - DOI

Publication types