. 2023 Feb;614(7949):664-669.
doi: 10.1038/s41586-022-05591-3. Epub 2023 Jan 9.

Early Release Science of the exoplanet WASP-39b with JWST NIRSpec G395H

Lili Alderson  1 Hannah R Wakeford  2 Munazza K Alam  3 Natasha E Batalha  4 Joshua D Lothringer  5 Jea Adams Redai  6 Saugata Barat  7 Jonathan Brande  8 Mario Damiano  9 Tansu Daylan  10 Néstor Espinoza  11   12 Laura Flagg  13   14 Jayesh M Goyal  15 David Grant  16 Renyu Hu  9   17 Julie Inglis  17 Elspeth K H Lee  18 Thomas Mikal-Evans  19 Lakeisha Ramos-Rosado  12 Pierre-Alexis Roy  20   21 Nicole L Wallack  3   17 Natalie M Batalha  22 Jacob L Bean  23 Björn Benneke  20   21 Zachory K Berta-Thompson  24 Aarynn L Carter  22 Quentin Changeat  25   26 Knicole D Colón  27 Ian J M Crossfield  8 Jean-Michel Désert  7 Daniel Foreman-Mackey  28 Neale P Gibson  29 Laura Kreidberg  19 Michael R Line  30 Mercedes López-Morales  6 Karan Molaverdikhani  31   32 Sarah E Moran  33 Giuseppe Morello  34   35   36 Julianne I Moses  37 Sagnick Mukherjee  22 Everett Schlawin  38 David K Sing  12   39 Kevin B Stevenson  40 Jake Taylor  20   21   41 Keshav Aggarwal  42 Eva-Maria Ahrer  43   44 Natalie H Allen  12 Joanna K Barstow  45 Taylor J Bell  46 Jasmina Blecic  47   48 Sarah L Casewell  49 Katy L Chubb  50 Nicolas Crouzet  51 Patricio E Cubillos  52   53 Leen Decin  54 Adina D Feinstein  23 Joanthan J Fortney  22 Joseph Harrington  55   56 Kevin Heng  44   57 Nicolas Iro  58 Eliza M-R Kempton  59 James Kirk  6   60 Heather A Knutson  17 Jessica Krick  61 Jérémy Leconte  62 Monika Lendl  63 Ryan J MacDonald  13   14   64 Luigi Mancini  19   65   66 Megan Mansfield  38 Erin M May  40 Nathan J Mayne  67 Yamila Miguel  51   68 Nikolay K Nikolov  11 Kazumasa Ohno  22 Enric Palle  34 Vivien Parmentier  41   69 Dominique J M Petit Dit de la Roche  63 Caroline Piaulet  20   21 Diana Powell  6 Benjamin V Rackham  70   71 Seth Redfield  72   73 Laura K Rogers  74 Zafar Rustamkulov  12 Xianyu Tan  41 P Tremblin  75 Shang-Min Tsai  41 Jake D Turner  13   14 Miguel de Val-Borro  76 Olivia Venot  77 Luis Welbanks  30 Peter J Wheatley  43   44 Xi Zhang  78
Affiliations

Early Release Science of the exoplanet WASP-39b with JWST NIRSpec G395H

Lili Alderson et al. Nature. 2023 Feb.

Abstract

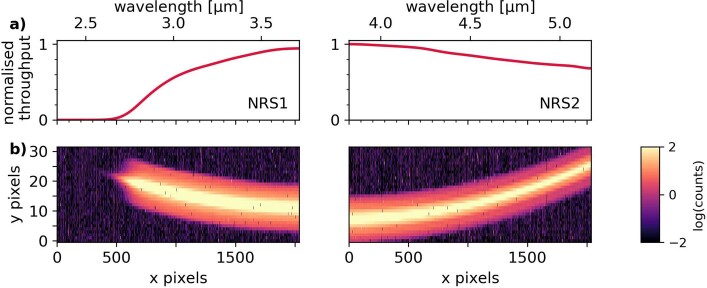
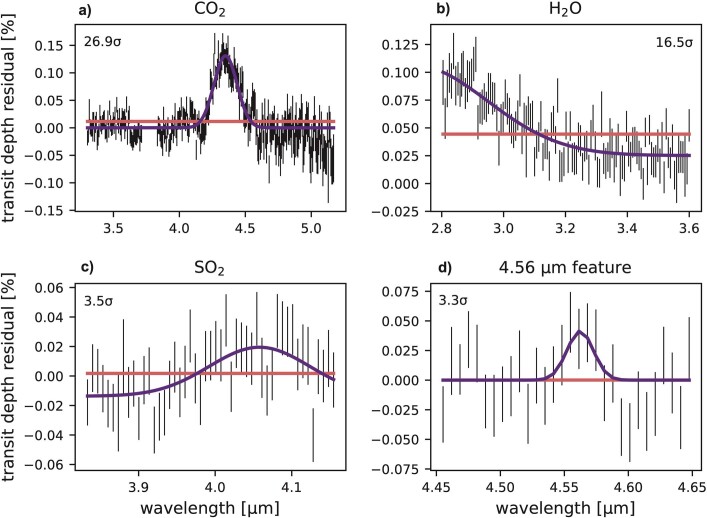
Measuring the abundances of carbon and oxygen in exoplanet atmospheres is considered a crucial avenue for unlocking the formation and evolution of exoplanetary systems1,2. Access to the chemical inventory of an exoplanet requires high-precision observations, often inferred from individual molecular detections with low-resolution space-based3-5 and high-resolution ground-based6-8 facilities. Here we report the medium-resolution (R ≈ 600) transmission spectrum of an exoplanet atmosphere between 3 and 5 μm covering several absorption features for the Saturn-mass exoplanet WASP-39b (ref. 9), obtained with the Near Infrared Spectrograph (NIRSpec) G395H grating of JWST. Our observations achieve 1.46 times photon precision, providing an average transit depth uncertainty of 221 ppm per spectroscopic bin, and present minimal impacts from systematic effects. We detect significant absorption from CO2 (28.5σ) and H2O (21.5σ), and identify SO2 as the source of absorption at 4.1 μm (4.8σ). Best-fit atmospheric models range between 3 and 10 times solar metallicity, with sub-solar to solar C/O ratios. These results, including the detection of SO2, underscore the importance of characterizing the chemistry in exoplanet atmospheres and showcase NIRSpec G395H as an excellent mode for time-series observations over this critical wavelength range10.


Conflict of interest statement

The authors declare no competing interests.

Figures

Fig. 1
Fig. 1. Light-curve precisions achieved for WASP-39b with NIRSpec G395H.
a, Raw, uncorrected broadband light curves from the NRS1 (purple) and NRS2 (red) detectors, demonstrating the lack of dominant systematic trends in the light curves. The inset shows the drop in flux (grey-shaded region) caused by a mirror-tilt event, resulting in a distinct change in flux between NRS1 and NRS2 after the tilt event (see Extended Data Figs. 2 and 3). b, Pixel intensity map of the spectroscopic light curves after correction for the tilt event and further instrument systematics. c, Light-curve precision obtained per spectroscopic bin (black) compared with 1 and 2 times photon noise expectations (grey dashed lines) and the measured precision on the transit depth (blue). The gap between the two detectors (3.72–3.82 μm) is highlighted in the middle and bottom plots. All data shown are from fitting pipeline 1 (see Methods).
Fig. 2
Fig. 2. WASP-39b transmission spectra measured at 10-pixel resolution (≈7-nm-wide bins, R ≈ 600) using several fitting pipelines.
We show the resultant spectra from five out of 11 independent fitting pipelines, which used distinct analysis methods to demonstrate the robust structure of the spectrum (see Methods for details on each fitting pipeline and comparative statistics). The black points show the weighted-average transmission spectrum computed from the transit depth values in each bin weighted by 1/σ2, in which σ is the uncertainty on the data point from each of the 11 fitting pipelines. The error bars were computed from the unweighted mean uncertainty in each bin (see Extended Data Fig. 5). All spectra show consistent broadband absorption short of 3.7 μm, around 4.1 μm and from 4.2 to 4.5 μm.
Fig. 3
Fig. 3. Spectra from three independent 1D RCTE models and their residuals, fit to the weighted-average WASP-39b G395H transmission spectrum.
a, Spectra from the three models. b, Their residuals. The models are dominated by absorption from H2O and CO2 with a grey-cloud-top pressure corresponding to ≈1 mbar. The models find that the data are best explained by 3–10 times solar metallicity (M/H) and sub-solar to solar C/O (C/O = 0.30–0.46). The extra absorption owing to SO2, seen in the spectrum around 4.1 μm, is not included in the RCTE model grids and causes a marked impact on the χ2/N (see Fig. 4).
Fig. 4
Fig. 4. Contribution of opacity sources to the best-fitting model with injected SO2.
a, The lowest χ2/N best-fitting model (PICASO in Fig. 3) with an injected abundance of 10−5.6 (VMR) SO2. We also show this model with a selection of the anticipated absorbing species and the cloud opacity removed to indicate their contributions to the model. The inclusion of SO2 in the model decreases the χ2/N from 1.08 (shown in Fig. 3) to 1.02, resulting in a 4.8σ detection (see Extended Data Table 3). be, The effect of removing the corresponding molecular opacity from the spectrum (shaded region). Our best-fit model is also affected by minor opacities from CO, H2S, OCS and CH4, although their spectral features cannot be robustly detected in the spectrum. We show a model without CO and CH4 in a to demonstrate this, with the minor contribution by CO also highlighted in e.
Extended Data Fig. 1
Extended Data Fig. 1. The throughput and spectral trace for WASP-39 across NRS1 and NRS2.
a, Normalized throughput of NRS1 and NRS2 detectors (as custom produced; see Methods, ‘Limb-darkening’), which shows the cutoff at short wavelengths. b, 2D spectral images of the trace produced from the ExoTiC-JEDI [V1] reduction before cleaning steps. The aspect ratio has been stretched in the y direction to show the structure of the trace over the 32-pixel-wide subarray more clearly. The NRS2 spectral position is slightly offset from that of NRS1, as the NRS2 subarray was moved following commissioning to ensure that the centre of the spectral trace fell fully on the detector and did not fall off the top-right corner.
Extended Data Fig. 2
Extended Data Fig. 2. Time-dependent decorrelation parameters.
a, The change in the FWHM of the spectral trace at selected wavelengths. This change does not correspond to any high-gain antenna movements and is attributed to a large mirror-tilt event. These measurements demonstrate that the mirror-tilt event has a wavelength dependence. Changes to the PSF have a larger impact at short wavelengths, as the PSF of the spectrum increases with wavelength. b,c, The change in the x-pixel and y-pixel position of the spectral trace as functions of time, respectively. Positional shifts are calculated by cross-correlating the spectral trace with a template to measure sub-pixel movement on the detector. The y-position shift clearly shows a link to the mirror-tilt event.
Extended Data Fig. 3
Extended Data Fig. 3. Normalized flux offset of the stellar baseline before and after the tilt event as a function of wavelength for NRS1 and NRS2.
Purple denotes NRS1 and orange denotes NRS2. The normalized flux offset is calculated per pixel by measuring the median flux in the stellar baseline before and after the transit and calculating the difference. These differences are then normalized by the before-transit flux and plotted on a common scale. Overplotted are the data binned to a resolution of 10 pixels to match our presented transmission spectra (Fig. 2). We also show a linear fit to each detector to better quantify the decreasing tilt flux amplitude with increasing wavelength (NRS1 = −0.00073374x + 0.00707344, NRS2 = −0.00067165x + 0.00588128).
Extended Data Fig. 4
Extended Data Fig. 4. Normalized root-mean-squared binning statistic for three of the 11 reductions detailed in Methods.
In each subplot, the red line shows the expected relationship for perfect Gaussian white noise. The black lines show the observed noise from each spectroscopic light curve for pipelines 1, 3 and 5. To compare bins and noise levels, values for all bins in each pipeline are normalized by dividing by the value for a bin width of 1.
Extended Data Fig. 5
Extended Data Fig. 5. Comparison between all fitting pipelines performed on the spectroscopic light curves.
a, The underlying grey data points show the standard deviation between all transmission spectra per spectral bin. The black line shows the unweighted mean uncertainty on the transit depth per bin. Spikes in the uncertainties correspond to spectral bins with higher standard deviations, probably because of differences in pixel-flagging or sigma-clipping at the light-curve level. b, Gaussian PDFs of the normalized transmission spectrum residuals, showing the mean offset and the spread relative to the weighted-average transmission spectrum. c, Histograms of the normalized transmission spectrum residuals aligned to zero by subtracting the mean of the distribution that was used to generate the PDF above. In panels b and c, the coloured lines and numbers correspond to the fitting pipeline used to obtain each transmission spectrum, as summarized in Extended Data Table 1. The dashed lines correspond to the fitting pipeline results presented in Fig. 2, demonstrating that they are drawn from across the distribution.
Extended Data Fig. 6
Extended Data Fig. 6. Gaussian versus flat-line fits to the residual transmission spectrum for CO2, H2O, SO2 and the 4.56-μm feature.
Shown after all other absorption from the best-fit model is subtracted from the data. Each of the Gaussian fits has a higher Bayesian evidence than the flat-line fits, indicating a detection, although to varying degrees of significance.
Extended Data Fig. 7
Extended Data Fig. 7. Model transmission spectra of WASP-39b with PHOENIX and gCMCRT with varying abundances of SO2.
Model transmission spectra compared with the observed spectral feature at 4.1 μm in the G395H data. At wavelengths short of 3.95 μm, which is outside the SO2 band, all models overlap, further suggesting that the data can be explained by the presence of SO2 in the atmosphere. By interpolating these 10 times solar metallicity models, we find a best-fit SO2 abundance of 4.6 ± 0.67 ppm. With the best-fit PICASO 3.0 at 3 times solar metallicity, we find an SO2 abundance of 2.5 ± 0.65 ppm.

Comment in

  • JWST opens a window on exoplanet skies.
    Seidel JV, Nielsen LD, Sarkar S. Seidel JV, et al. Nature. 2023 Feb;614(7949):632-633. doi: 10.1038/d41586-023-00394-6. Nature. 2023. PMID: 36792896 No abstract available.

References

    1. Öberg KI, Murray-Clay R, Bergin EA. The effects of snowlines on C/O in planetary atmospheres. Astrophys. J. Lett. 2011;743:L16. doi: 10.1088/2041-8205/743/1/L16. - DOI
    1. Mordasini C, van Boekel R, Mollière P, Henning T, Benneke B. The imprint of exoplanet formation history on observable present-day spectra of hot Jupiters. Astrophys. J. 2016;832:41. doi: 10.3847/0004-637X/832/1/41. - DOI
    1. Sing DK, et al. A continuum from clear to cloudy hot-Jupiter exoplanets without primordial water depletion. Nature. 2016;529:59–62. doi: 10.1038/nature16068. - DOI - PubMed
    1. Wakeford HR, et al. The complete transmission spectrum of WASP-39b with a precise water constraint. Astron. J. 2018;155:29. doi: 10.3847/1538-3881/aa9e4e. - DOI
    1. Alam MK, et al. The Hubble Space Telescope PanCET program: an optical to infrared transmission spectrum of HAT-P-32Ab. Astron. J. 2020;160:51. doi: 10.3847/1538-3881/ab96cb. - DOI

Publication types