. 2023 Feb;614(7949):653-658.
doi: 10.1038/s41586-022-05590-4. Epub 2023 Jan 9.

Early Release Science of the exoplanet WASP-39b with JWST NIRCam

Eva-Maria Ahrer  1   2 Kevin B Stevenson  3 Megan Mansfield  4 Sarah E Moran  5 Jonathan Brande  6 Giuseppe Morello  7   8   9 Catriona A Murray  10 Nikolay K Nikolov  11 Dominique J M Petit Dit de la Roche  12 Everett Schlawin  4 Peter J Wheatley  13   14 Sebastian Zieba  15   16 Natasha E Batalha  17 Mario Damiano  18 Jayesh M Goyal  19 Monika Lendl  12 Joshua D Lothringer  20 Sagnick Mukherjee  21 Kazumasa Ohno  21 Natalie M Batalha  21   22 Matthew P Battley  13   14 Jacob L Bean  23 Thomas G Beatty  24 Björn Benneke  25 Zachory K Berta-Thompson  10 Aarynn L Carter  21 Patricio E Cubillos  26   27 Tansu Daylan  28 Néstor Espinoza  11   29 Peter Gao  30 Neale P Gibson  31 Samuel Gill  14 Joseph Harrington  32 Renyu Hu  33   34 Laura Kreidberg  15 Nikole K Lewis  35 Michael R Line  36 Mercedes López-Morales  37 Vivien Parmentier  38   39 Diana K Powell  37 David K Sing  29   40 Shang-Min Tsai  38 Hannah R Wakeford  41 Luis Welbanks  36 Munazza K Alam  30 Lili Alderson  41 Natalie H Allen  29 David R Anderson  13   14 Joanna K Barstow  42 Daniel Bayliss  14 Taylor J Bell  43 Jasmina Blecic  44   45 Edward M Bryant  46 Matthew R Burleigh  47 Ludmila Carone  26 S L Casewell  47 Quentin Changeat  11   48   49 Katy L Chubb  50 Ian J M Crossfield  6 Nicolas Crouzet  51 Leen Decin  52 Jean-Michel Désert  53 Adina D Feinstein  23 Laura Flagg  35 Jonathan J Fortney  21 John E Gizis  54 Kevin Heng  14   55   56 Nicolas Iro  57 Eliza M-R Kempton  58 Sarah Kendrew  48 James Kirk  37   59 Heather A Knutson  34 Thaddeus D Komacek  58 Pierre-Olivier Lagage  60 Jérémy Leconte  61 Jacob Lustig-Yaeger  62 Ryan J MacDonald  35   63 Luigi Mancini  15   64   65 E M May  62 N J Mayne  66 Yamila Miguel  16   67 Thomas Mikal-Evans  15 Karan Molaverdikhani  15   55   68 Enric Palle  7 Caroline Piaulet  25 Benjamin V Rackham  69   70 Seth Redfield  71 Laura K Rogers  72 Pierre-Alexis Roy  25 Zafar Rustamkulov  40 Evgenya L Shkolnik  36 Kristin S Sotzen  62   40 Jake Taylor  25   38 P Tremblin  73 Gregory S Tucker  74 Jake D Turner  35 Miguel de Val-Borro  75 Olivia Venot  76 Xi Zhang  77
Affiliations

Early Release Science of the exoplanet WASP-39b with JWST NIRCam

Eva-Maria Ahrer et al. Nature. 2023 Feb.

Abstract

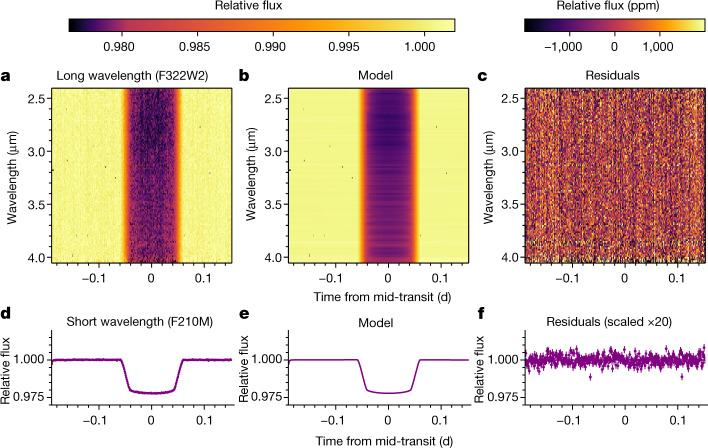
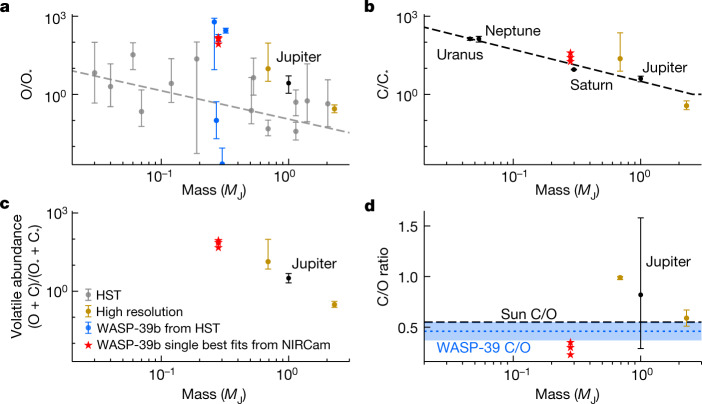
Measuring the metallicity and carbon-to-oxygen (C/O) ratio in exoplanet atmospheres is a fundamental step towards constraining the dominant chemical processes at work and, if in equilibrium, revealing planet formation histories. Transmission spectroscopy (for example, refs. 1,2) provides the necessary means by constraining the abundances of oxygen- and carbon-bearing species; however, this requires broad wavelength coverage, moderate spectral resolution and high precision, which, together, are not achievable with previous observatories. Now that JWST has commenced science operations, we are able to observe exoplanets at previously uncharted wavelengths and spectral resolutions. Here we report time-series observations of the transiting exoplanet WASP-39b using JWST's Near InfraRed Camera (NIRCam). The long-wavelength spectroscopic and short-wavelength photometric light curves span 2.0-4.0 micrometres, exhibit minimal systematics and reveal well defined molecular absorption features in the planet's spectrum. Specifically, we detect gaseous water in the atmosphere and place an upper limit on the abundance of methane. The otherwise prominent carbon dioxide feature at 2.8 micrometres is largely masked by water. The best-fit chemical equilibrium models favour an atmospheric metallicity of 1-100-times solar (that is, an enrichment of elements heavier than helium relative to the Sun) and a substellar C/O ratio. The inferred high metallicity and low C/O ratio may indicate significant accretion of solid materials during planet formation (for example, refs. 3,4,) or disequilibrium processes in the upper atmosphere (for example, refs. 5,6).


Conflict of interest statement

The authors declare no competing interests.

Figures

Fig. 1
Fig. 1. The relative brightness of the WASP-39 planetary system as a function of time and wavelength, as measured by NIRCam.
af, Spectroscopic data (ac) and the photometric (SW) channel (df) for the extracted flux normalized by the median stellar spectrum (a,d), the best-fit transit and systematic models (b,e) and the residuals (c,f). The flux decrease results from the transit of exoplanet WASP-39b in front of its star. The subtle variation in transit depth around 2.8 µm is due primarily to water vapour in the planet’s atmosphere. The vertical striping in the residuals is due to 1/f noise.
Fig. 2
Fig. 2. The transit spectrum of WASP-39b as measured from JWST’s NIRCam instrument.
The coloured points with 1σ uncertainties depict our independent analyses of the spectroscopic LW channel (2.420–4.025 µm) and photometric SW channel (2.0–2.2 µm) with their respective throughputs shown in grey. All analyses agree with the broadband Spitzer point (black circle, 3.2–4.0 µm). The broad feature centred at 2.8 µm spans 2.5 scale heights (∼2,000 km) and is due primarily to water vapour within WASP-39b’s atmosphere. We note the consistency between analyses in the fine structure. Source data
Fig. 3
Fig. 3. Contributions of key absorbers impacting the spectrum.
Top: the best-fit PICASO 3.0 equilibrium model (10× solar, C/O = 0.229, moderate grey clouds with cloud optical depth of 2.5 × 10−3) is shown compared with the Eureka! reduction, along with models with individual molecular species removed to show its contribution to the spectrum. Each model is normalized to the data for illustration by offsetting each model to have the same transit depth at 2.8 µm. Water predominately sets the shape of the spectrum, followed by the influence of clouds. The grey dashed line shows a cloudy solar-metallicity and stellar-C/O atmospheric model, illustrating the lack of a strong CH4 peak seen in the data. Bottom: the opacities of the dominant molecular species at an optical depth (τ) of 1 in the atmosphere. In the single best-fit model shown in the bottom panel, the CH4 peak at 3.3 µm is blended out by water absorption. However, manual scaling of CH4 gives an upper limit of CH4 abundance (blue line) for the single best-fit model shown in the top panel. Source data
Fig. 4
Fig. 4. Trends in elemental abundances and C/O ratio with planet mass.
ac, The abundances of O (a), C (b) and net volatiles (O + C) (c) scaled to stellar values (O* and C*). The grey points in a show HST constraints based on ≥2σ H2O detections, with the grey dashed line showing the best-fit trend from ref. . The blue points show all previous estimates of the metallicity of WASP-39b from HST data, offset in mass for clarity,–. The black points and dashed line in b show a fit based on CH4 abundances of Solar System giant planets. Of the Solar System planets, only Jupiter has a constrained O abundance (from Juno observations of H2O (ref. )). The gold points indicate high-resolution observations of H2O and CO in exoplanets,, and the red stars show the best-fit values for WASP-39b as measured by JWST/NIRCam for each of the three model grids described in this paper. d, The black dashed line depicts the solar C/O ratio of 0.55 (ref. ) and the blue dotted line with a shaded 1σ uncertainty region indicates the measured C/O ratio of the star WASP-39. Our results for WASP-39b favour a super-stellar volatile abundance and substellar C/O ratio. However, we emphasize that a full retrieval will be necessary to determine accurate means and 1σ error bars for the NIRCam results. Source data
Extended Data Fig. 1
Extended Data Fig. 1. Photometric monitoring of WASP-39 (top) and individual transit observations (bottom) using NGTS (magenta) and TESS (dark purple).
The black marks indicate the times of the four JWST ERS transit observations. The monitoring light curve shows evidence for optical variability, but with an RMS amplitude of only 0.06% in NGTS. The times of the individual transit observations are indicated on the top panel, and they are all consistent with transits free of starspot crossings or other features associated with stellar activity.
Extended Data Fig. 2
Extended Data Fig. 2. Raw NIRCam image of the LW (top) and SW (bottom) channels.
The faint horizontal stripes seen in the LW channel originate from neighbouring objects. The SW channel is able to track changes in alignment for individual mirror segments. No impactful tilt events were noted in this observation.
Extended Data Fig. 3
Extended Data Fig. 3. Median NIRCam frame, after curvature correction and background subtraction, shown as the full 2D frame (left) and a vertical slice (right).
Left: curvature-corrected, background-subtracted, median frame. We perform optimal spectral extraction on the pixels in between the green dashed lines. We use the pixels outside of the two orange solid lines for background subtraction. The flux spans −200–1000 electrons, thus drawing attention to the residual background features. Right: vertical slice depicting the flux averaged over detector pixels 855 to 865. The background region clearly demonstrates some low-level residual structure.
Extended Data Fig. 4
Extended Data Fig. 4. Normalized root-mean-square error as a function of bin size for all spectroscopic channels.
The red line shows the expected relationship for perfect Gaussian white noise. The black lines show the observed noise from each spectroscopic channel for the Eureka! long-wavelength reduction. Values for all channels are normalized by dividing by the value for a bin size of 1 in order to compare bins with different noise levels. The black lines closely follow the red line out to large bin sizes of ≈30 (≈0.5-h timescales), which demonstrates that the residuals to the fit are dominated by white Gaussian noise.
Extended Data Fig. 5
Extended Data Fig. 5. The transit spectrum of WSP-39b as determined by our independent analysis using JWST’s NIRCam instrument (top) and the respective differences between our results (bottom).
Top: transmission spectra from our reductions when including additional data on the blue and red edges (now spanning 2.405–4.055 µm). This demonstrates the large error bars and diverging data points near the edges of the NIRCam bandpass in the LW spectroscopic channel. Bottom: the differences in retrieved transmission spectra by subtracting the Eureka! spectrum from the other three reduced spectra shown in the top panel. This shows the strong agreement between the spectra; however, we do note minor disagreements at shorter wavelengths that we attribute to differences in the treatment of limb-darkening effects within the individual fitting methods.
Extended Data Fig. 6
Extended Data Fig. 6. JWST’s NIRCam data of WASP-39 as a function of time and wavelength for each independent reduction (top) and their residuals (bottom).
Top: time-series NIRCam data for the WASP-39b system, from three independent spectral extractions. Colour represents relative brightness at each time and wavelength, normalized by the median stellar spectrum. Bottom: resulting residuals after fitting the time-series NIRCam data.
Extended Data Fig. 7
Extended Data Fig. 7. Measured transmission spectrum compared to atmospheric forward model grids.
Top: the single best fit for each model grid (shown as solid coloured lines; PICASO 3.0, ATMO, PHOENIX), fits the planet spectrum (Eureka! reduction) with χν2 ≤ 1.22. All single best fits prefer at least solar metallicity and substantial cloud cover. Also shown as a grey dashed line is a solar metallicity, stellar C/O ratio atmospheric model, demonstrating the lack of methane absorption seen in the spectrum. Because we can put an upper limit on the CH4 abundance, the preferred C/O ratio found by the model grids is substellar. Bottom: residuals of each best fit, shown as the model spectrum subtracted from the reduced spectrum and divided by the uncertainty in transit depth. The residuals show wavelength-dependent correlations, the origin of which are unknown and left for a future study.
Extended Data Fig. 8
Extended Data Fig. 8. Our JWST/NIRCam spectrum compared with existing HST/WFC3 data.
As in Extended Data Fig. 7, but with the addition of HST/WFC3 data from 0.8 to 1.65 μm, showing the comparable precision and complementary wavelength coverage offered by the combination of NIRCam and HST/WFC3.
Extended Data Fig. 9
Extended Data Fig. 9. Gaussian residual fitting of H2O and CO2.
The blue points show the residual features left after subtracting out the gas in question (CO2, top, and H2O, bottom) from the single best-fit model. The Gaussian model ensemble fit to the residual is shown in red; the best-fit Gaussian ensemble to a flat-line model is shown in blue. We strongly detect H2O at nearly 16σ and show weak evidence for CO2 (small feature at 2.6 µm) at 1.9σ.

Comment in

  • JWST opens a window on exoplanet skies.
    Seidel JV, Nielsen LD, Sarkar S. Seidel JV, et al. Nature. 2023 Feb;614(7949):632-633. doi: 10.1038/d41586-023-00394-6. Nature. 2023. PMID: 36792896 No abstract available.

References

    1. Stevenson, K. B. et al. Transmission spectroscopy of the hot Jupiter WASP-12b from 0.7 to 5 μm. Astron. J.147, 161 (2014).
    1. Sing, D. K. et al. A continuum from clear to cloudy hot-Jupiter exoplanets without primordial water depletion. Nature529, 59–62 (2016). - PubMed
    1. Öberg, K. I., Murray-Clay, R. & Bergin, E. A. The effects of snowlines on C/O in planetary atmospheres. Astrophys. J. Lett.743, L16 (2011).
    1. Espinoza, N., Fortney, J. J., Miguel, Y., Thorngren, D. & Murray-Clay, R. Metal enrichment leads to low atmospheric C/O ratios in transiting giant exoplanets. Astrophys. J. Lett.838, L9 (2017).
    1. Cooper, C. S. & Showman, A. P. Dynamics and disequilibrium carbon chemistry in hot Jupiter atmospheres, with application to HD 209458b. Astrophys. J.649, 1048–1063 (2006).

Publication types