. 2023 Jan 9;14(1):120.
doi: 10.1038/s41467-022-35584-9.

Tumor-intrinsic IRE1α signaling controls protective immunity in lung cancer

Affiliations

Tumor-intrinsic IRE1α signaling controls protective immunity in lung cancer

Michael J P Crowley et al. Nat Commun. .

Abstract

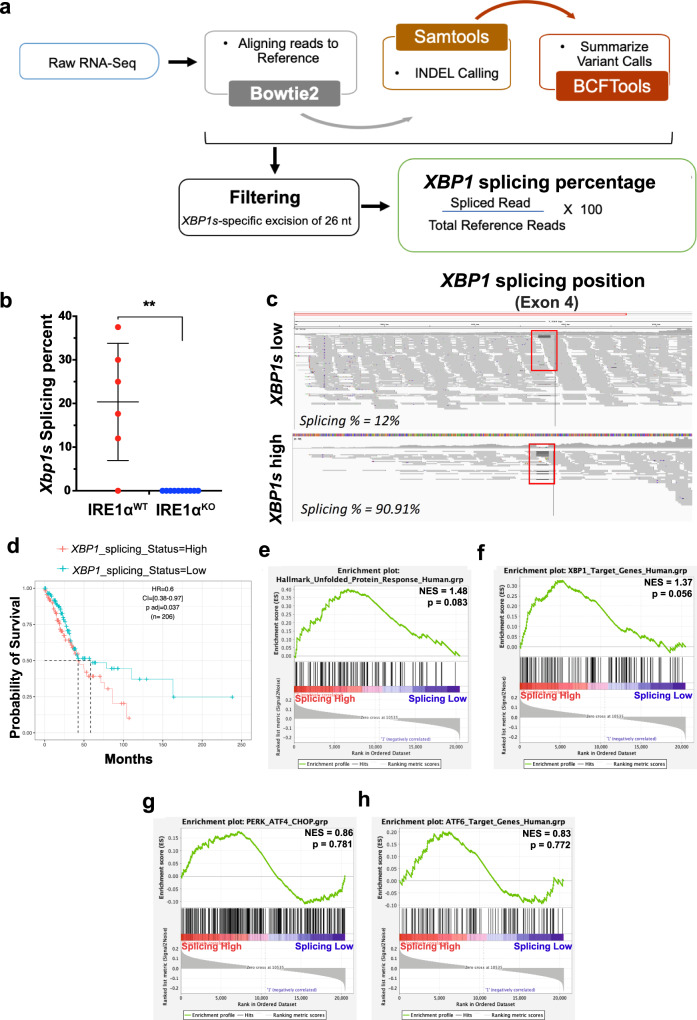
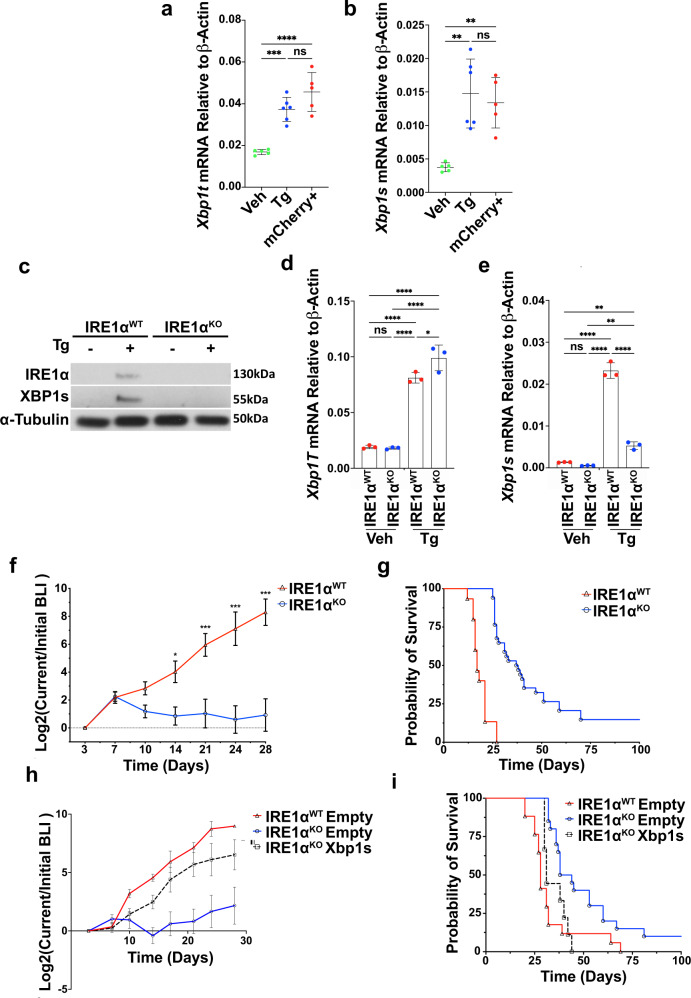
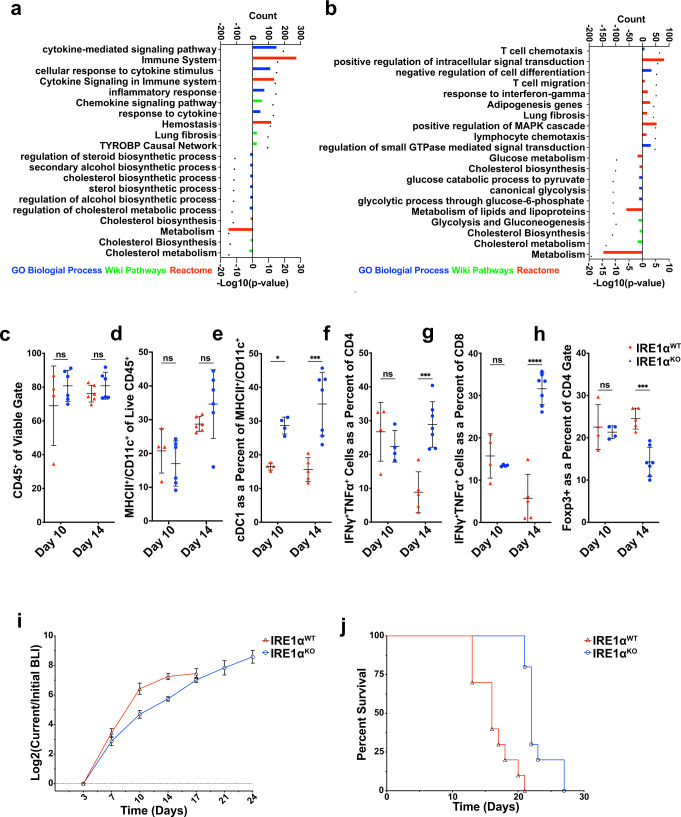
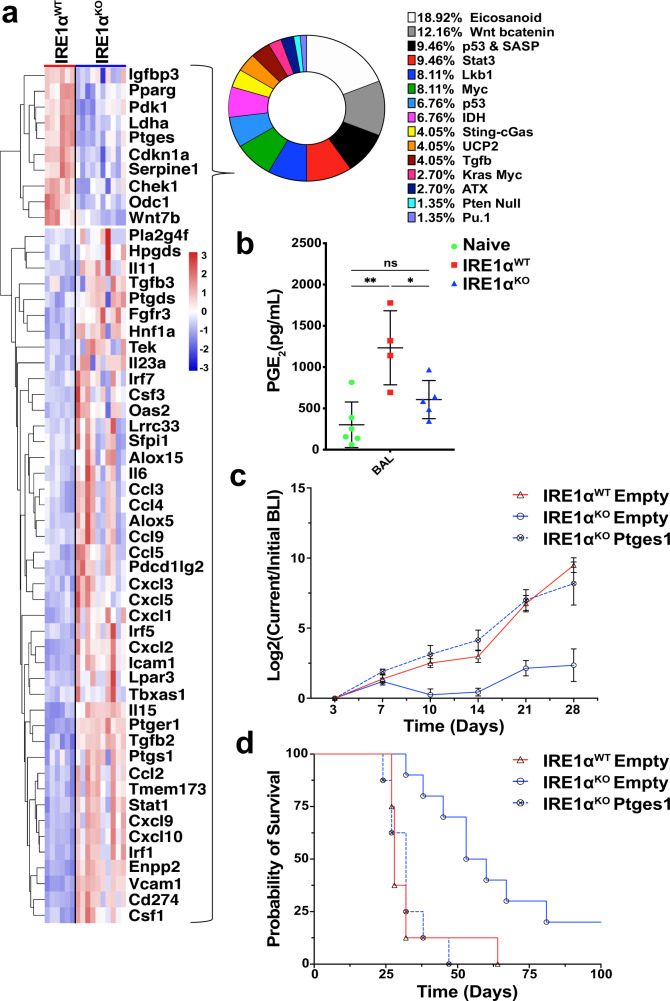
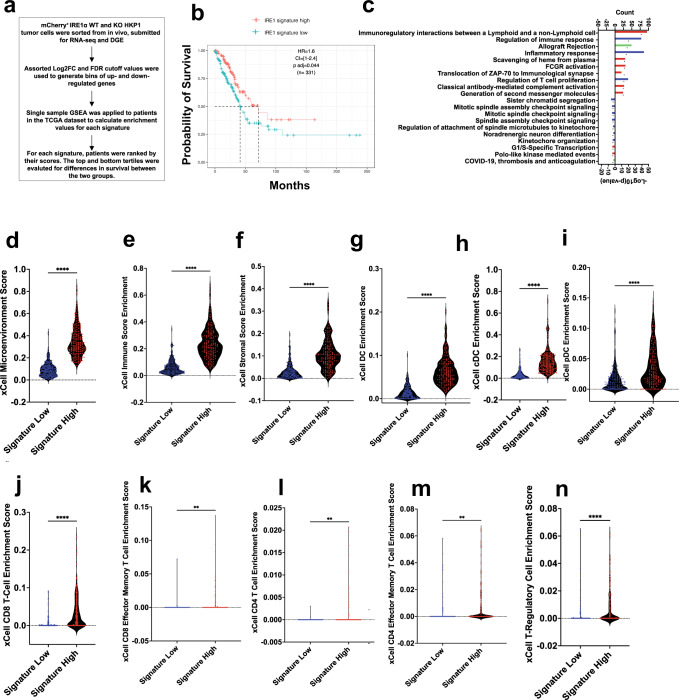
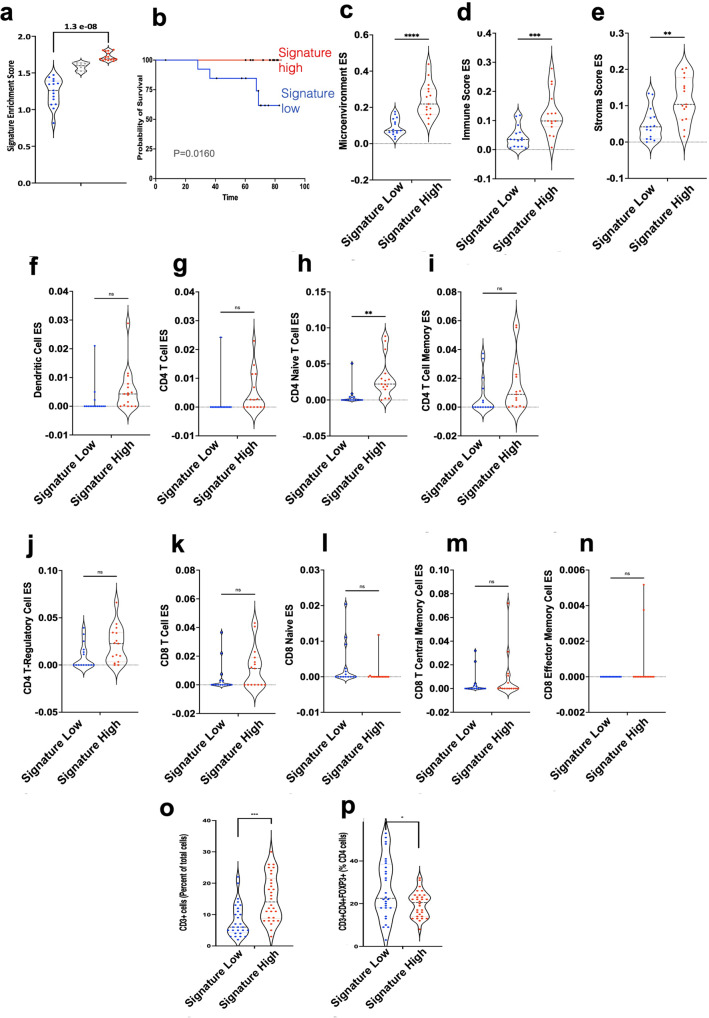
IRE1α-XBP1 signaling is emerging as a central orchestrator of malignant progression and immunosuppression in various cancer types. Employing a computational XBP1s detection method applied to TCGA datasets, we demonstrate that expression of the XBP1s mRNA isoform predicts poor survival in non-small cell lung cancer (NSCLC) patients. Ablation of IRE1α in malignant cells delays tumor progression and extends survival in mouse models of NSCLC. This protective effect is accompanied by alterations in intratumoral immune cell subsets eliciting durable adaptive anti-cancer immunity. Mechanistically, cancer cell-intrinsic IRE1α activation sustains mPGES-1 expression, enabling production of the immunosuppressive lipid mediator prostaglandin E2. Accordingly, restoring mPGES-1 expression in IRE1αKO cancer cells rescues normal tumor progression. We have developed an IRE1α gene signature that predicts immune cell infiltration and overall survival in human NSCLC. Our study unveils an immunoregulatory role for cancer cell-intrinsic IRE1α activation and suggests that targeting this pathway may help enhance anti-tumor immunity in NSCLC.


Conflict of interest statement

J.R.C.-R. is a scientific consultant for NextRNA Therapeutics, Inc. and Autoimmunity Biologic Solutions, Inc, and holds patents on IRE1α modulation for the treatment of disease. O.E. is supported by Janssen, J&J, Astra-Zeneca, Volastra, and Eli Lilly research grants. He is a scientific advisor and equity holder in Freenome, Owkin, Volastra Therapeutics, and One Three Biotech and a paid scientific advisor to Champions Oncology and Pionyr Immunotherapeutics. The remaining authors declare no competing interests.

Figures

Fig. 1
Fig. 1. XBP1s is associated with decreased overall survival in human NSCLC.
a Schematic of the RNA-seq based XBP1s detection pipeline. b Box and whisker plot of computationally evaluated Xbp1 splicing in isogenic IRE1αWT (red, n = 6) or IRE1αKO (blue, n = 10) HKP1 cancer cells. Data were presented as mean ± SD. P < 0.0002. Unpaired, two-tailed, Student’s t-test. c Visual survey of aligned reads using Integrative Genomic Viewer (IGV) showing detected indels including the 25 nucleotide excision of the XBP1 gene (red box). Representative XBP1s low and XBP1s high samples are shown. d Kaplan–Meier survival plots depicting associations between overall survival (OS) and XBP1s status in human TCGA-LUAD. High is top 1/3rd (n = 103) and low is bottom 1/3rd (103) of the XBP1splicing scores. The high XBP1s group is the reference population. HR is the hazard ratio and p adj is the log-rank p value from the multivariate Cox proportional-hazards regression model adjusted for age at diagnosis, gender, pathology, TN stages, and smoking history. eh GSEA hyperparametric curves showing expression of genes controlled by the UPR (e), XBP1s (f), PERK (g), and ATF6 (h) in patients with high vs. low XBP1s levels. Source data are provided as a Source Data file.
Fig. 2
Fig. 2. IRE1α deficiency in the cancer cell impairs HKP1 tumor growth and extends host survival.
a, b RT-PCR of total Xbp1 (b, Veh vs Tg, P = 0.0004; Veh vs mCherry, P < 0.0001; Tg vs mCherry, P = 0.111) and Xbp1s (c Veh vs Tg, P = 0.001; Veh vs mCherry, P = 0.0042, Tg vs mCherry, P = 0.8234), in vehicle (n = 5), or 1 µM Tg for 6 h (n = 3) and mCherry+ HKP1 cells from tumors (n = 5). Data were presented as mean ± SD. Tg Thapsigargin. One-way ANOVA with Tukey’s multiple comparisons test for ratios; *P < 0.05, **P < 0.001, and ***P < 0.0001. c Western blot of IRE1α and XBP1s in IRE1αWT or IRE1αKO HKP1 cells treated with vehicle or 1 μM Tg for 6 h. This result represents three replicates. d, e RT-PCR for of Xbp1 total (e Veh WT vs Tg WT, P < 0.0001; Veh WT vs KO Veh, P = 0.9970; Veh WT vs KO Tg, P < 0.0001; Tg WT vs KO Veh, P < 0.0001; Tg WT vs KO Tg, P = 0.0343; KO Veh vs KO Tg, P < 0.0001), Xbp1s (f Veh WT vs Tg WT, P < 0.0001; Veh WT vs KO Veh, P = 0.7959; Veh WT vs KO Tg, P = 0.0071; Tg WT vs KO Veh, P < 0.0001; Tg Wt vs KO Tg, P < 0.0001; KO Veh vs KO Tg, P = 0.0023) in IRE1αWT or IRE1αKO HKP1 cells treated with vehicle (n = 3) or 1 μM Tg (n = 3) for 6 h. One-way ANOVAs with Tukey’s multiple comparisons test; *P < 0.05, **P < 0.001, and ***P < 0.0001. Data were shown as mean ± SD. f BLI plots of longitudinally tracked in vivo IRE1αWT (red, n = 6) vs IRE1αKO (blue, n = 10) HKP1 tumors (Day 3, P = NS; Day 7, P = NS; Day 10, P = NS; Day 14, P = 0.0275; Day 21, P = 0.0002; Day 24, P < 0.0001 and Day 28, P < 0.0001). Data were shown as mean ± SEM of biological replicates. Analyses of different time points in tumor progression were performed using two-way ANOVA with Tukey’s multiple comparisons test; *P < 0.05, **P < 0.001, ***P < 0.0001. g Kaplan–Meier plots showing the probability of overall survival in IRE1αWT (red, n = 15) vs IRE1αKO (blue, n = 35) HKP1 tumor-bearing mice (P < 0.001). Tumors were allowed to progress until endpoint and survival were evaluated using Mantel–Haenszel Log-rank-test). h BLI plots of longitudinally tracked in vivo IRE1αWT empty vector (red, n = 5), IRE1αKO empty vector (blue, n = 5) and IRE1αKO expressing Xbp1s cDNA (black, n = 5) HKP1 tumors. Data were shown as mean ± SEM of biological replicates. Data were pooled from two independent experiments. (P < 0.001 for IRE1αWT vs. IRE1αKO; P < 0.002 for IRE1αKO vs. IRE1αKO expressing Xbp1s cDNA at day 28). Data were shown as mean ± SEM of biological replicates. Analyses of different time points in tumor progression were performed using two-way ANOVA with Tukey’s multiple comparisons test. i Kaplan–Meier plots showing overall survival in IRE1αWT (red, n = 17), IRE1αKO (blue n = 20), and IRE1αKO expressing Xbp1s cDNA (black, n = 9). Tumors were allowed to progress until endpoint and survival were evaluated using Mantel–Haenszel Log-rank-test). Data were pooled from two independent experiments. (P = 0.0009 for IRE1αWT vs. IRE1αKO; and P = 0.0058 for IRE1αKO vs. IRE1αKO Xbp1s. Source data are provided as a Source Data file.
Fig. 3
Fig. 3. Adaptive immunity mediates the protective effects of tumor cell-intrinsic IRE1α loss.
a, b Top ten upregulated and ten downregulated terms enriched from GO Biological Process (Blue), Wiki Pathways (Green) and Reactome (Red) in differentially expressed genes between IRE1αWT vs IRE1αKO mcherry+ cells from HKP1 tumors at day 10 (a) and 14 (b). Significance cutoff values were set at log2 fold-change >0.5, p value < 0.05 and false discovery rate <10%). The count of genes enriching the GO term is represented as a barplot, and the plotted –log10 p values are represented as a dot above its corresponding bar. Genes matching these criteria were analyzed using the Enrichr portal with standard parameters. ch Box and whisker plots of flow cytometry data from IRE1αWT (red) vs IRE1αKO (blue) HKP1 tumor-bearing lungs at day 10 (n = 4 IRE1αWT and n = 6 IRE1αKO) and 14 (n = 6 IRE1αWT and n = 7 IRE1αKO), showing percent viable CD45+ (c), MHCII+ CD11C+ (d), and cDC1 (e). IFNγ/TNFα+ T cells as a percent of CD4 (f), IFNγ/TNFα+ T cells as a percent of CD8 (g), and percent of T-regulatory cells of viable CD45+ cells (h). Data were shown as mean ± SD. Two-way ANOVA with Tukey’s multiple comparisons test; *P < 0.05, **P < 0.001, and ***P < 0.000, ns non-significant. i IRE1αWT or IRE1αKO HKP1 tumor growth in Rag2-KO mice. Data were shown as mean ± SEM of biological replicates, (n = 5, per condition). Analyses of different time points in tumor progression were performed using two-way ANOVA with Tukey’s multiple comparisons test; *P < 0.05, **P < 0.001, and ***P < 0.0001; ns non-significant. j Kaplan–Meier plots showing probability of overall survival in Rag2-KO mice bearing IRE1αWT or IRE1αKO HKP1 tumors. (P < 0.001, n = 5 per condition). Source data are provided as a Source Data file.
Fig. 4
Fig. 4. IRE1α-XBP1 signaling drives immunosuppressive PGE2 production that promotes NSCLC progression.
a Heatmap of differentially expressed genes between IRE1αKO vs. IRE1αWT HKP1 cells from the Immunomodulator database. b BAL PGE2 levels as measured by ELISA from tumor naïve (green, n = 6), and IRE1αWT (red, n = 4), or IRE1αKO (blue, n = 5) tumor-bearing lungs. Data were shown as mean ± SD. One-way ANOVA with Tukey’s multiple comparisons test for ratios; *P < 0.05, **P < 0.001, and ***P < 0.0001. c BLI plots of longitudinally tracked in vivo IRE1αWT empty vector (red, n = 10), IRE1αKO empty vector (blue, n = 10) and IRE1αKO Ptges cDNA (blue broken line, n = 10) HKP1 tumors. Data were shown as mean ± SEM of biological replicates. Analyses of different time points in tumor progression were performed using two-way ANOVA with Tukey’s multiple comparisons test; *P < 0.05, **P < 0.001, and ***P < 0.0001. d Kaplan–Meier plots showing the probability of overall survival in IRE1αWT (red) vs IRE1αKO (blue) and IRE1αKO Ptges cDNA HKP1 tumor-bearing mice (P < 0.001). Tumors were allowed to progress until the endpoint and survival were evaluated using Mantel–Haenszel Log-rank-test). Source data are provided as a Source Data file.
Fig. 5
Fig. 5. IRE1αKO gene signature enrichment is associated with human LUAD survival and immune infiltration.
a Schematic depicting IRE1α signature generation and evaluation. b Kaplan–Meier survival plots depicting associations between overall survival (OS) and IRE1αKO signature status in human TCGA-LUAD. High is top 1/3rd (n = 166) and low is bottom 1/3rd (n = 165) of the IRE1αKO signature scores. HR is the hazard ratio and p adj is log-rank p value from the multivariate Cox proportional-hazards regression model. c Gene ontologies between the IRE1αKO signature high and low tertile patients. The count of genes enriching the term on the top x-axis is represented as a barplot, and the –log(10) p value for the terms on the bottom x-axis, represented as a black symbol. Exact P values are in the Source Data file. dn Violin plots of xCell pipeline enrichment scores for microenvironment (d P < 0.0001), immune (e P < 0.0001), stromal (f P < 0.0001), DC (g P < 0.0001) cDC (h P < 0.0001), pDC (i P < 0.0001), CD8 + T cells (j P < 0.0001), Effector CD8 T cells (k P = 0.0011), CD4 T cells (l P = 0.0013), Effector CD4 T cells (m P = 0.0017), and Treg (n P < 0.0001) from the top and bottom tertiles of those with high (red, n = 169) or low (blue, n = 169) signature enrichment. Unpaired Student’s t-test, two-sided. *P < 0.05, **P < 0.001, and ***P < 0.0001. Source data are provided as a Source Data file.
Fig. 6
Fig. 6. Validation of the IRE1a signature and RNA-seq deconvolution.
a Violin plot of enrichment scores (ssGSEA) for IRE1αKO gene signature (Log2 fold-change >1 and FDR 0.01) low (n = 15, blue), mid (gray, n = 14), and high (red, n = 15) NSCLC patients. One-way ANOVA with Tukey’s multiple comparisons test for ratios. b Kaplan–Meier survival plots depicting associations between overall survival (OS) and IRE1αKO signature status of NSCLC patients stratified into the top and bottom tertiles (15 patients in each) for the IRE1aKO gene signature. cn Violin plots of xCell pipeline enrichment scores for microenvironment (c P < 0.0001), immune (d P = 0.001), stromal (e P = 0.001), dendritic (f P = ns), CD4 + T cells (g P = ns), CD4 + naïve (h P = 0.0027), CD4 memory (i P = ns), T-regulatory (j P = NS), CD8 + T cell (k P = ns), CD8 + Naïve (l P = ns), CD8 + TCM (m P = ns), and CD8 + effector memory (n P = ns) from the validation set of lung cancer patients from the IRE1α signature high (red, n = 15) and low (blue, n = 15) groups for the enrichment of various immune cells. Unpaired, two-tailed, Student’s t-test. *P < 0.05, **P < 0.001, and ***P < 0.0001. o, p IF analysis showing quantitation of CD3T cells (left panel) and Tregs (right panel) in tumor nests of validation set of lung cancer patients from the IRE1α signature high (red, n = 30) and low (blue, n = 30) groups. Unpaired, two-tailed, Student’s t-test. *P < 0.05, **P < 0.001, and ***P < 0.0001. Source data are provided as a Source Data file.

References

    1. Herbst RS, Morgensztern D, Boshoff C. The biology and management of non-small cell lung cancer. Nature. 2018;553:446–454. doi: 10.1038/nature25183. - DOI - PubMed
    1. Altorki NK, et al. The lung microenvironment: an important regulator of tumour growth and metastasis. Nat. Rev. Cancer. 2019;19:9–31. doi: 10.1038/s41568-018-0081-9. - DOI - PMC - PubMed
    1. Brahmer JR. Immune checkpoint blockade: the hope for immunotherapy as a treatment of lung cancer? Semin. Oncol. 2014;41:126–132. doi: 10.1053/j.seminoncol.2013.12.014. - DOI - PMC - PubMed
    1. Sharma P, Allison JP. Immune checkpoint targeting in cancer therapy: toward combination strategies with curative potential. Cell. 2015;161:205–214. doi: 10.1016/j.cell.2015.03.030. - DOI - PMC - PubMed
    1. Hetz C, Chevet E, Harding HP. Targeting the unfolded protein response in disease. Nat. Rev. Drug Discov. 2013;12:703–719. doi: 10.1038/nrd3976. - DOI - PubMed

Publication types

MeSH terms