. 2023 Jan 9;13(1):427.
doi: 10.1038/s41598-022-26183-1.

Analysis of cerebral glucose metabolism following experimental subarachnoid hemorrhage over 7 days

Affiliations

Analysis of cerebral glucose metabolism following experimental subarachnoid hemorrhage over 7 days

Fabian Schadt et al. Sci Rep. .

Abstract

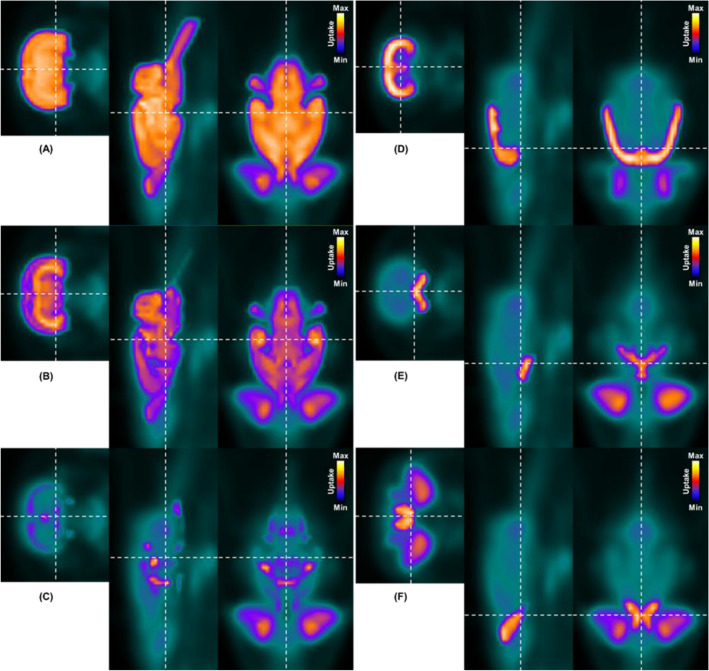
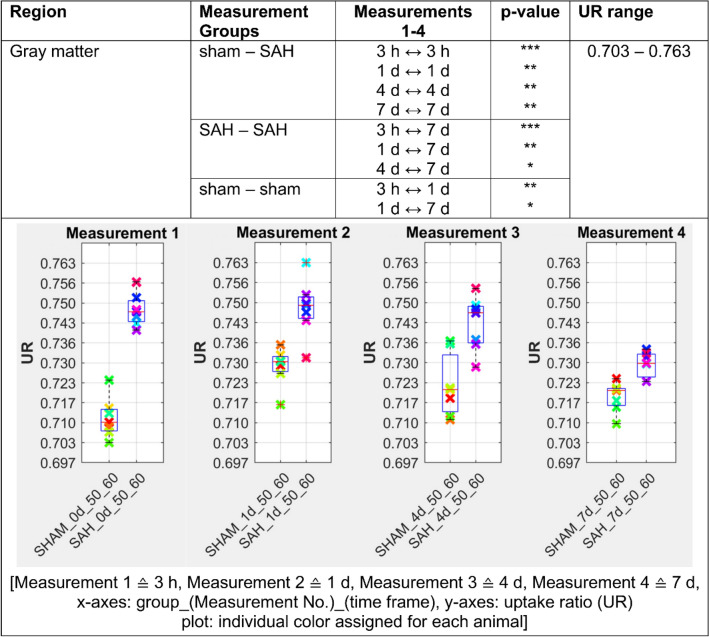
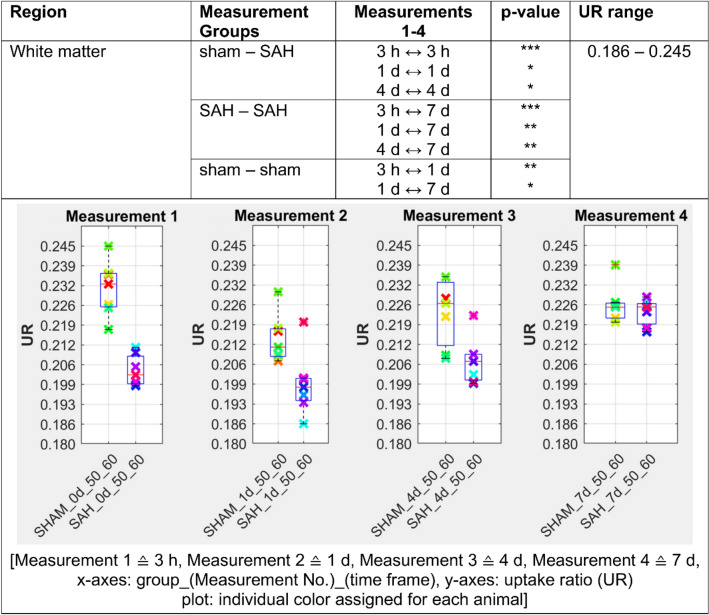
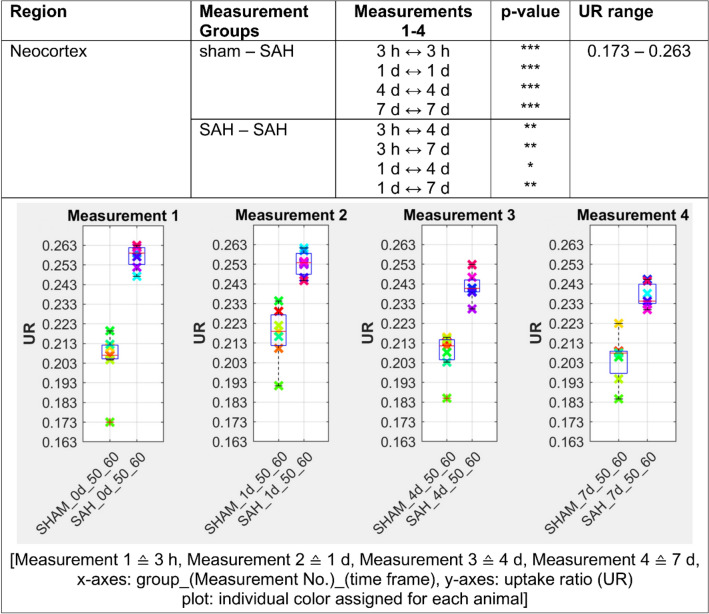
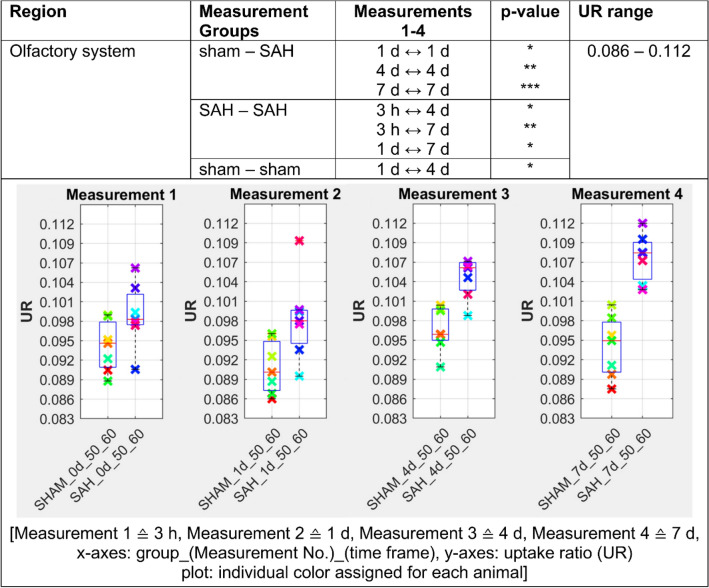
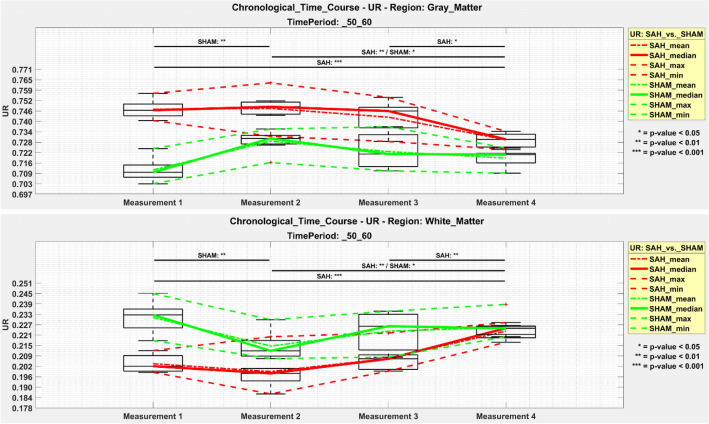
Little is known about changes in brain metabolism following SAH, possibly leading towards secondary brain damage. Despite sustained progress in the last decade, analysis of in vivo acquired data still remains challenging. The present interdisciplinary study uses a semi-automated data analysis tool analyzing imaging data independently from the administrated radiotracer. The uptake of 2-[18F]Fluoro-2-deoxy-glucose ([18F]FDG) was evaluated in different brain regions in 14 male Sprague-Dawley rats, randomized into two groups: (1) SAH induced by the endovascular filament model and (2) sham operated controls. Serial [18F]FDG-PET measurements were carried out. Quantitative image analysis was performed by uptake ratio using a self-developed MRI-template based data analysis tool. SAH animals showed significantly higher [18F]FDG accumulation in gray matter, neocortex and olfactory system as compared to animals of the sham group, while white matter and basal forebrain region showed significant reduced tracer accumulation in SAH animals. All significant metabolic changes were visualized from 3 h, over 24 h (day 1), day 4 and day 7 following SAH/sham operation. This [18F]FDG-PET study provides important insights into glucose metabolism alterations following SAH-for the first time in different brain regions and up to day 7 during course of disease.


Conflict of interest statement

The authors declare no competing interests.

Figures

Figure 1
Figure 1
Co-registered PET image template based on the sham-operated controls as well as following anatomical image information: MRI T2* image (A), gray matter (B), white matter (C), the neocortex (D), the basal forebrain region (E) as well as the olfactory system (F).
Figure 2
Figure 2
SAH animals show a highly significant increased [18F]FDG uptake ratio (p ≤ 0.001) compared to sham operated controls in the gray matter 3 h after SAH/sham operation. This effect persisted in the follow-up measurements and remained significantly increased (p ≤ 0.01) until day 7 after SAH/sham operation. p ≤ 0.05 *; p ≤ 0.01 **; p ≤ 0.001 ***.
Figure 3
Figure 3
[18F]FDG uptake ratio is highly significant (p ≤ 0.001) reduced in white matter in SAH animals compared to the sham operated group 3 h following the SAH/sham operation. The UR of SAH animals remained significantly (p ≤ 0.05) reduced in white matter up to day 4 following SAH but converges strongly on day 7. p ≤ 0.05 *; p ≤ 0.01 **; p ≤ 0.001 ***.
Figure 4
Figure 4
The [18F]FDG uptake in SAH animals is highly significant (p ≤ 0.001) elevated in the neocortex compared to the sham operated control and stays significantly higher (p ≤ 0.001) up to day 7 following SAH. p ≤ 0.05 *; p ≤ 0.01 **; p ≤ 0.001 ***.
Figure 5
Figure 5
In SAH animals the [18F]FDG uptake ratio in the basal forebrain region is highly significant decreased (p ≤ 0.001) compared to sham operated controls throughout the 7-day study period. p ≤ 0.05 *; p ≤ 0.01 **; p ≤ 0.001 ***.
Figure 6
Figure 6
[18F]FDG uptake ratio is significantly elevated in olfactory system on day 1 following SAH compared to sham operated controls. This more-uptake gets even more significant on day 4 (p ≤ 0.01) and on day 7 (p ≤ 0.001) following SAH/sham operation. p ≤ 0.05 *; p ≤ 0.01 **; p ≤ 0.001 ***.
Figure 7
Figure 7
Chronological time course of [18F]FDG uptake in SAH animals (red lines) and sham operated controls (green lines) over course of disease/observation period for gray (top) and white matter (bottom). Measurement 1 = 3 h following SAH/sham operation; Measurement 2 = 24 h respectively day 1 following SAH/sham operation; Measurement 3 = day 4 following SAH/sham operation; Measurement 4 = day 7 following SAH/sham operation. UR = uptake ratio. p ≤ 0.05 *; p ≤ 0.01 **; p ≤ 0.001 ***.

References

    1. Cross DT, 3rd, Tirschwell DL, Clark MA, et al. Mortality rates after subarachnoid hemorrhage: Variations according to hospital case volume in 18 states. J. Neurosurg. 2003;99(5):810–817. doi: 10.3171/jns.2003.99.5.0810. - DOI - PubMed
    1. van Gijn J, Rinkel GJ. Subarachnoid haemorrhage: Diagnosis, causes and management. Brain J. Neurol. 2001;124(Pt 2):249–278. doi: 10.1093/brain/124.2.249. - DOI - PubMed
    1. Hackenberg KAM, Hanggi D, Etminan N. Unruptured intracranial aneurysms. Stroke J. Cereb. Circ. 2018;49(9):2268–2275. doi: 10.1161/STROKEAHA.118.021030. - DOI - PubMed
    1. Macdonald RL. Delayed neurological deterioration after subarachnoid haemorrhage. Nat. Rev. Neurol. 2014;10(1):44–58. doi: 10.1038/nrneurol.2013.246. - DOI - PubMed
    1. van Gijn J, Kerr RS, Rinkel GJ. Subarachnoid haemorrhage. Lancet. 2007;369(9558):306–318. doi: 10.1016/S0140-6736(07)60153-6. - DOI - PubMed

Publication types