. 2023 Jul 3;146(7):2869-2884.
doi: 10.1093/brain/awad009.

Functional genomics provide key insights to improve the diagnostic yield of hereditary ataxia

Collaborators, Affiliations

Functional genomics provide key insights to improve the diagnostic yield of hereditary ataxia

Zhongbo Chen et al. Brain. .

Abstract

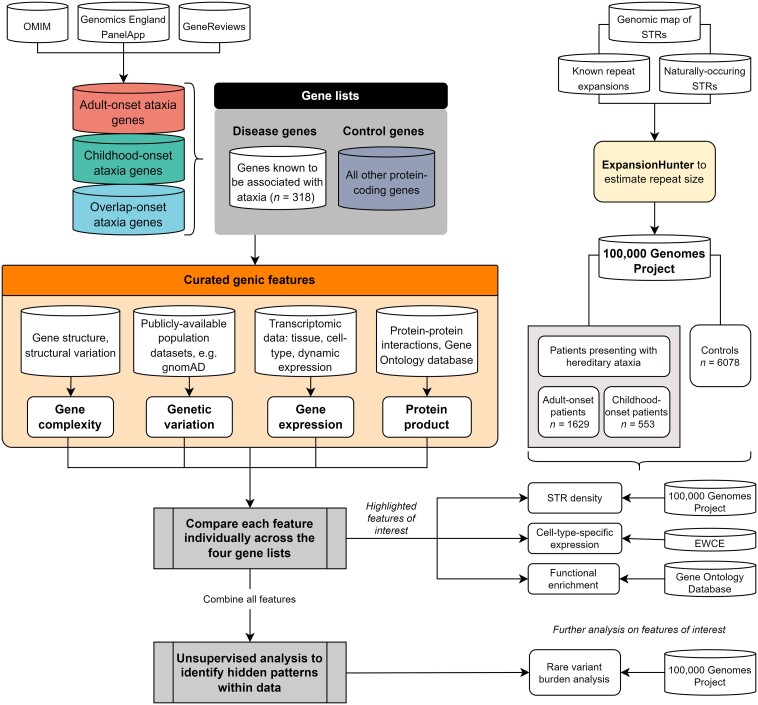
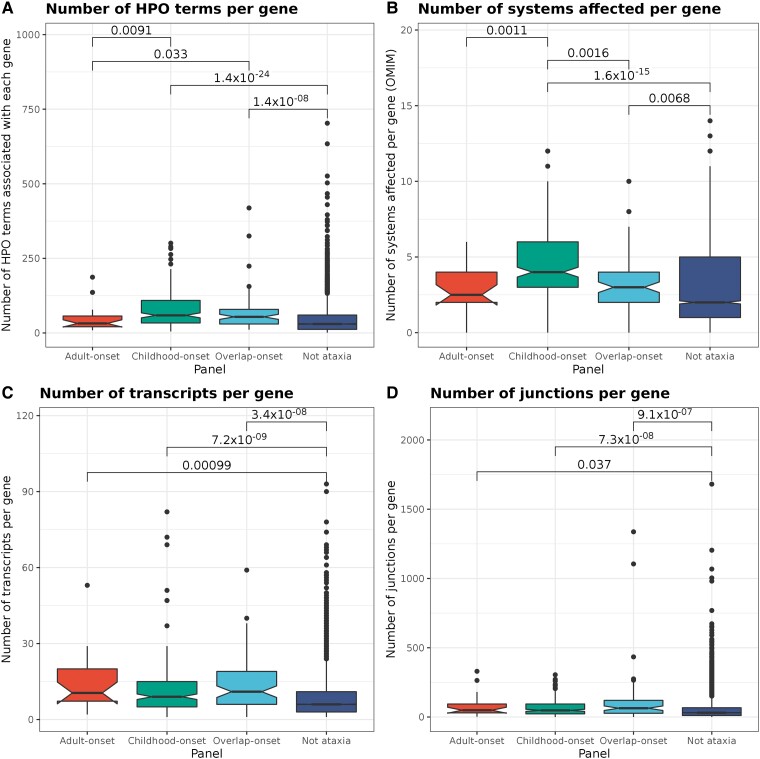
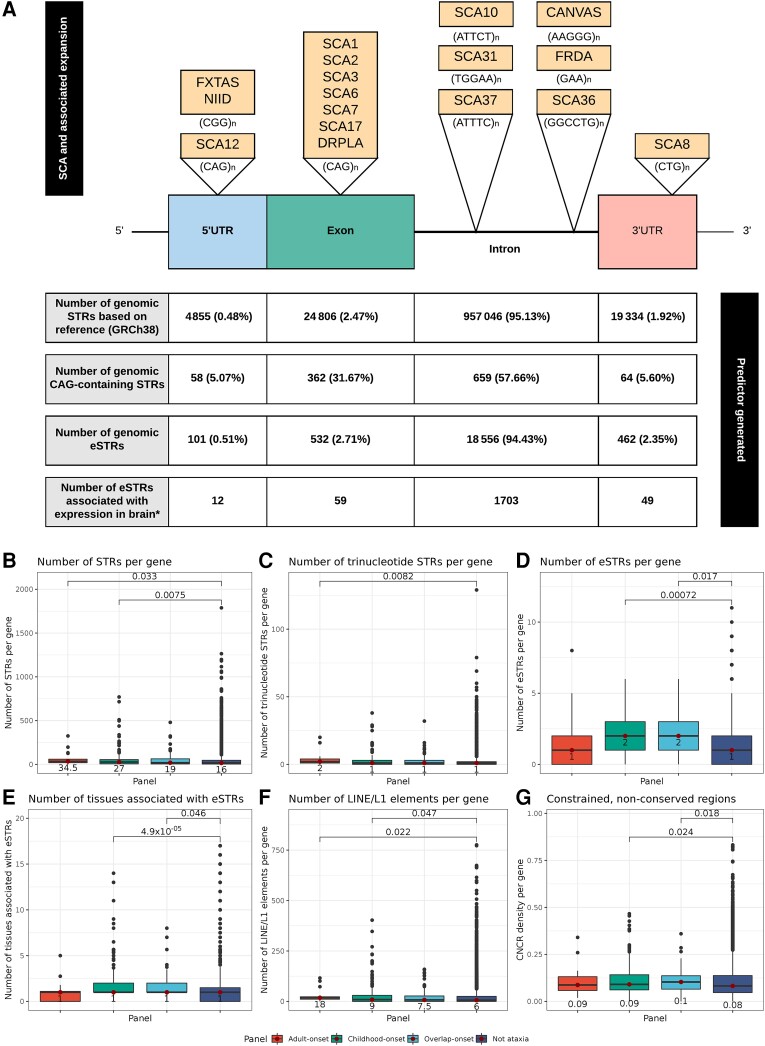
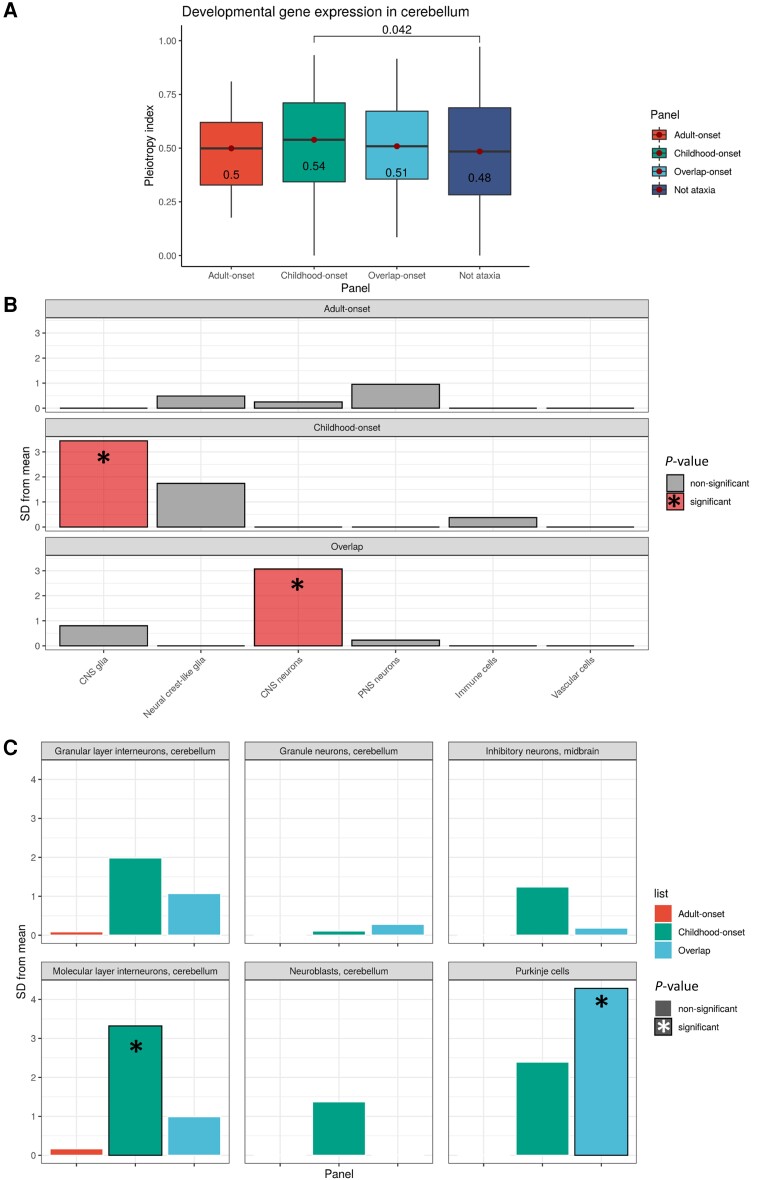
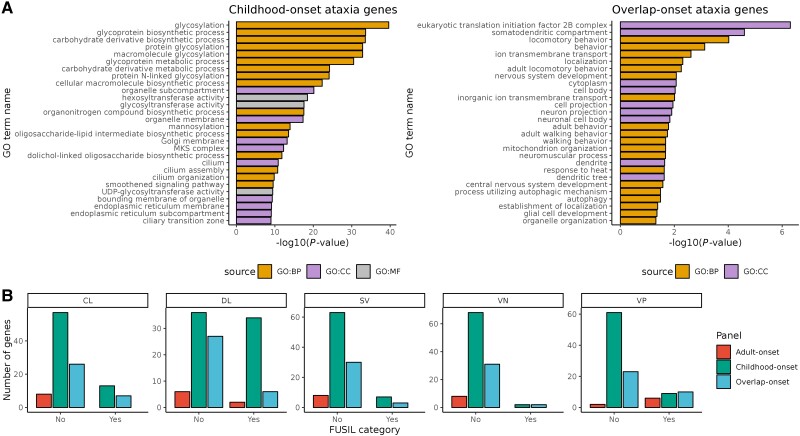
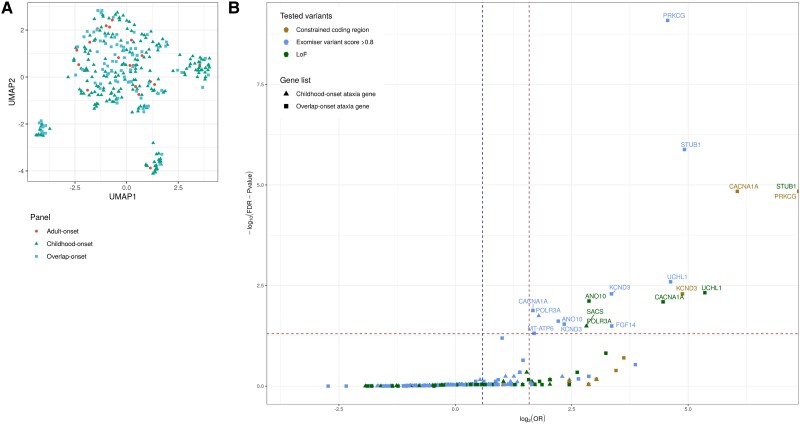
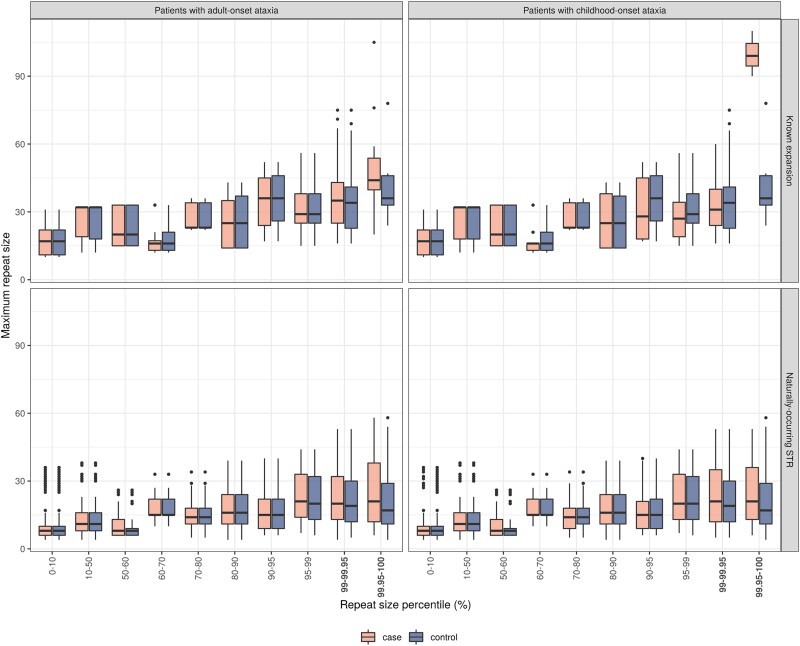
Improvements in functional genomic annotation have led to a critical mass of neurogenetic discoveries. This is exemplified in hereditary ataxia, a heterogeneous group of disorders characterised by incoordination from cerebellar dysfunction. Associated pathogenic variants in more than 300 genes have been described, leading to a detailed genetic classification partitioned by age-of-onset. Despite these advances, up to 75% of patients with ataxia remain molecularly undiagnosed even following whole genome sequencing, as exemplified in the 100 000 Genomes Project. This study aimed to understand whether we can improve our knowledge of the genetic architecture of hereditary ataxia by leveraging functional genomic annotations, and as a result, generate insights and strategies that raise the diagnostic yield. To achieve these aims, we used publicly-available multi-omics data to generate 294 genic features, capturing information relating to a gene's structure, genetic variation, tissue-specific, cell-type-specific and temporal expression, as well as protein products of a gene. We studied these features across genes typically causing childhood-onset, adult-onset or both types of disease first individually, then collectively. This led to the generation of testable hypotheses which we investigated using whole genome sequencing data from up to 2182 individuals presenting with ataxia and 6658 non-neurological probands recruited in the 100 000 Genomes Project. Using this approach, we demonstrated a high short tandem repeat (STR) density within childhood-onset genes suggesting that we may be missing pathogenic repeat expansions within this cohort. This was verified in both childhood- and adult-onset ataxia patients from the 100 000 Genomes Project who were unexpectedly found to have a trend for higher repeat sizes even at naturally-occurring STRs within known ataxia genes, implying a role for STRs in pathogenesis. Using unsupervised analysis, we found significant similarities in genomic annotation across the gene panels, which suggested adult- and childhood-onset patients should be screened using a common diagnostic gene set. We tested this within the 100 000 Genomes Project by assessing the burden of pathogenic variants among childhood-onset genes in adult-onset patients and vice versa. This demonstrated a significantly higher burden of rare, potentially pathogenic variants in conventional childhood-onset genes among individuals with adult-onset ataxia. Our analysis has implications for the current clinical practice in genetic testing for hereditary ataxia. We suggest that the diagnostic rate for hereditary ataxia could be increased by removing the age-of-onset partition, and through a modified screening for repeat expansions in naturally-occurring STRs within known ataxia-associated genes, in effect treating these regions as candidate pathogenic loci.

Keywords: functional genomics; hereditary ataxia; rare disease; repeat expansion disorders; transcriptomics.


Conflict of interest statement

The authors report no competing interests

Figures

Figure 1
Figure 1
Overall workflow of study. Genic information is captured across categories of genetic variation, gene structure/complexity, gene expression and co-expression and protein-product of a gene, and compared across the four gene lists of: (i) adult-onset ataxia genes; (ii) childhood-onset ataxia genes; (iii) overlap-onset ataxia genes, defined as those associated with both childhood- and adult-onset, when mutated; (iv) other protein-coding genes not known to cause ataxia (control ‘not ataxia’ genes). The gene lists were extracted primarily from Genomics England PanelApp, but also GeneReviews and OMIM. The age-of-onset definition was derived primarily from OMIM to reduce bias. Genic features were first compared individually across the four gene lists then combined together through unsupervised clustering analysis. Individual genic features were also highlighted and put through further analyses including expression-weighted cell-type enrichment (EWCE) for cell-type-specific expression and functional gene ontology (GO) enrichment. Further verification of the results from functional genomic annotation were verified in whole genome sequencing data of patients with ataxia recruited to the 100 000 Genomes Project through rare variant burden analysis and short tandem repeat (STR) analysis.
Figure 2
Figure 2
Comparison of phenotypes associated with genes as annotated by HPO and OMIM and gene complexity features between different gene panels. The number of known HPO terms associated with each gene is shown in A. The number of body systems affected associated with each gene as annotated by OMIM is shown in B. The number of transcripts of each known gene as annotated by Ensembl v.72 is shown in C. The number of annotated junctions within each gene as annotated by Ensembl v.72 is shown in D. Only significant Wilcoxon rank sum P-values (<0.05) are given for pairwise comparisons above the square brackets. The corresponding horizontal lines on the notched boxplots represents the lowest quartile, median, and upper quartile of the data. Further results are presented in Supplementary Table 5.
Figure 3
Figure 3
Summary of gene features generated by leveraging information on genomic map of known STRs and eSTRs with examples of hereditary ataxia associated with pathogenic STRs. (A) Top illustrates the location of repeat expansions within SCA and other ataxias: Fragile X-associated tremor-ataxia syndrome (FXTAS); neuronal intranuclear inclusion disease (NIID); dentatorubral-pallidoluysian atrophy (DRPLA); cerebellar ataxia, neuropathy and vestibular areflexia syndrome (CANVAS) and Friedreich’s ataxia (FRDA). Bottom shows locations of genomic STRs, number of genomic CAG-containing STRs are taken the HipSTR package. Number of genomic eSTRs are based on analyses from Fotsing et al. These eSTRs are taken from those within the top 28 375 eSTRs associated with a high CAVIAR (CAusal Variants Identification in Associated Regions) score for posterior probability of causality when fine-mapped against top 100 nearby SNPs. *Number of eSTRs associated with expression in brain is also derived from this work. The total number of STRs/eSTRs is presented with the percentage of overall intragenic location for each STR in parentheses. (B) Comparison of the number of STRs within each gene (as defined within the HipSTR package) across the four gene lists. (C) Comparison of the number of trinucleotide STRs for each gene across the gene lists. (D) Comparison of the number of eSTRs per gene across the gene lists. (E) Comparison of the number of tissues in which eSTRs affect gene expression across the gene lists. (F) Comparison of the number of LINE/L1 elements per gene (as defined by RepeatMasker) across the gene lists. (G) Comparison of the density of CNCRs per gene across the gene lists. The CNCR density of a gene reflects the proportion of gene length that is covered by regions fulfilling criteria for constrained but not conserved sequences, such that a density of 1 signifies that the entire gene fulfils criteria for CNCRs. CNCRs are taken from Chen et al. and reflect the regions of the genome likely to be more human-lineage-specific. Only significant Wilcoxon rank sum P-values (<0.05) are given for pairwise comparisons above the square brackets. The numbers below or within the boxes of the box and whisker plots represent the median values for that genic feature. The corresponding horizontal lines on the notched boxplots represents the lowest quartile, median and upper quartile of the data. Further results are presented in Supplementary Table 5.
Figure 4
Figure 4
Comparison of markers of dynamic gene expression. (A) Comparison of dynamic specificity indices (where 1 represents repressed temporal expression) in the cerebellum across different gene sets. Only significant Wilcoxon rank sum P-values (<0.05) are given for pairwise comparisons above the square brackets. The numbers within the box of the box and whisker plots represent the median values for that genic feature. The corresponding horizontal lines on the boxplots represents the lowest quartile, median, and upper quartile of the data. Further results are presented in Supplementary Table 5. Expression-weighted cell-type enrichment results showing significantly-enriched cell-type-specific expression across two levels of cell information. (B) Enrichment of ataxia-associated genes (three sets of different ages of onset) in cell types from mouse single-cell RNA-sequencing data was determined using EWCE. Standard deviations (SD) from the mean indicate the distance of the mean expression of the target list from the mean expression of the bootstrap replicates. Significance at P < 0.05 after correction for multiple testing with the Benjamini–Hochberg method over all cell types and the three gene panels was used. CNS refers to central nervous system and PNS refers to the peripheral nervous system. (C) Enrichment of ataxia-associated genes within cerebellar-specific cell types of the Karolinska dataset are shown with significant P-values noted by an asterisk and column outline.
Figure 5
Figure 5
Enriched GO terms for childhood-onset hereditary ataxia genes (top 25 shown only) and for overlap-onset ataxia genes with associated g:SCS-corrected P-values from gene set analysis. (A) The source depicts the GO of the biological domain with respect to three aspects: biological process (BP), cellular component (CC) and molecular function (MF). (B) Bar plots of the number of genes across gene panels are shown for each FUSIL category: CL, DL, SV, VP and VN. ‘Yes’ refers to genes that fulfil criteria for that particular FUSIL category. ‘No’ refers to genes that do not fulfil criteria for that particular FUSIL category.
Figure 6
Figure 6
UMAP of all ataxia genes partitioned by age-of-onset using 84 selected genic features from recursive feature elimination. (A) Results are for each of the three gene panels shown in Supplementary Fig. 6. (B) Volcano plot depicting results from rare variant burden analysis using 100 000 Genomes Project participants. In this gene-based burden testing analysis, we assessed the number of adult-onset ataxia patients carrying variants in childhood-onset genes filtered for rare variants within constrained coding regions, or with an Exomiser score of >0.8 to indicate likely pathogenicity, or LoF variants. We also tested this burden of rare variants in overlap-onset ataxia genes which are expected to be significantly enriched within adult-onset patients. The OR is the odds of enrichment of a variant in cases over controls (defined in the ‘Materials and methods’ section). Benjamini–Hochberg method was used to correct for multiple testing; an overall FDR-adjusted P-value of 0.05 (horizontal dashed line) was used for claiming significant gene-disease associations taking into account the total number of case-control gene burden tests under all four scenarios analysed. The vertical dashed line on the left of the plot represents an OR of 1.5 and the other dashed vertical line represents an OR of 3.
Figure 7
Figure 7
Maximum allelic repeat sizes estimated using ExpansionHunter at STR loci annotated by HipSTR reference database in adult patients presenting with ataxia (n = 1629) and patients presenting with childhood-onset ataxia (n = 553) compared with controls (n = 6078) defined as unrelated non-neurological probands recruited under the Rare Disease arm of the 100 000 Genomes Project. The repeat sizes were estimated across STRs in which repeat expansions are known to cause ataxia (‘Known expansion’) and across naturally-occurring STRs, not currently known to be associated with disease. The corresponding horizontal lines on the boxplots represents the lowest quartile, median and upper quartile of the data.

References

    1. Boycott KM, Rath A, Chong JX, et al. . International cooperation to enable the diagnosis of all rare genetic diseases. Am J Hum Genet. 2017;100:695–705. - PMC - PubMed
    1. Németh AH, Kwasniewska AC, Lise S, et al. . Next generation sequencing for molecular diagnosis of neurological disorders using ataxias as a model. Brain. 2013;136(Pt 10):3106–3118. - PMC - PubMed
    1. Rexach J, Lee H, Martinez-Agosto JA, Németh AH, Fogel BL. Clinical application of next-generation sequencing to the practice of neurology. Lancet Neurol. 2019;18:492–503. - PMC - PubMed
    1. Boycott KM, Hartley T, Biesecker LG, et al. . A diagnosis for all rare genetic diseases: The horizon and the next frontiers. Cell. 2019;177:32–37. - PubMed
    1. Warman Chardon J, Beaulieu C, Hartley T, Boycott KM, Dyment DA. Axons to exons: The molecular diagnosis of rare neurological diseases by next-generation sequencing. Curr Neurol Neurosci Rep. 2015;15:64. - PubMed

Publication types