Clinical Trial
. 2023 Jan;29(1):75-85.
doi: 10.1038/s41591-022-02097-3. Epub 2023 Jan 9.

Neural stem cell transplantation in patients with progressive multiple sclerosis: an open-label, phase 1 study

Affiliations
Clinical Trial

Neural stem cell transplantation in patients with progressive multiple sclerosis: an open-label, phase 1 study

Angela Genchi et al. Nat Med. 2023 Jan.

Abstract

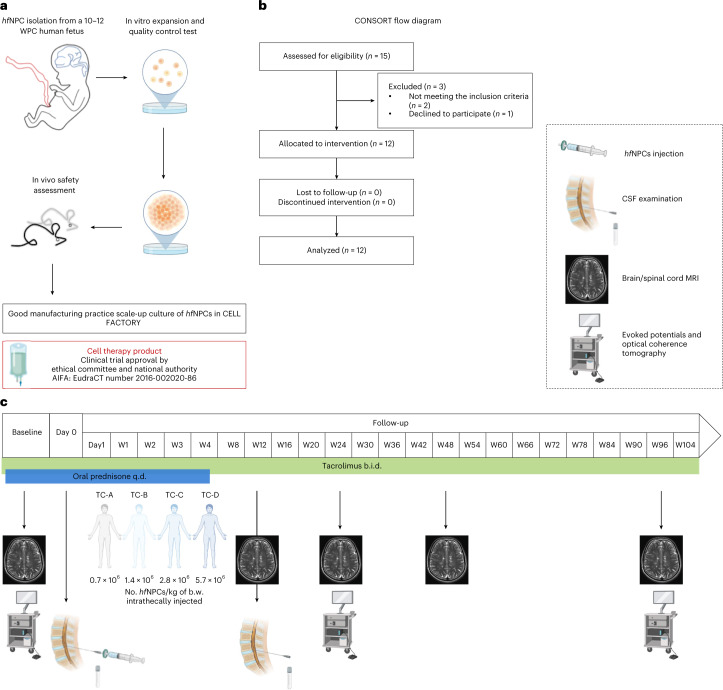
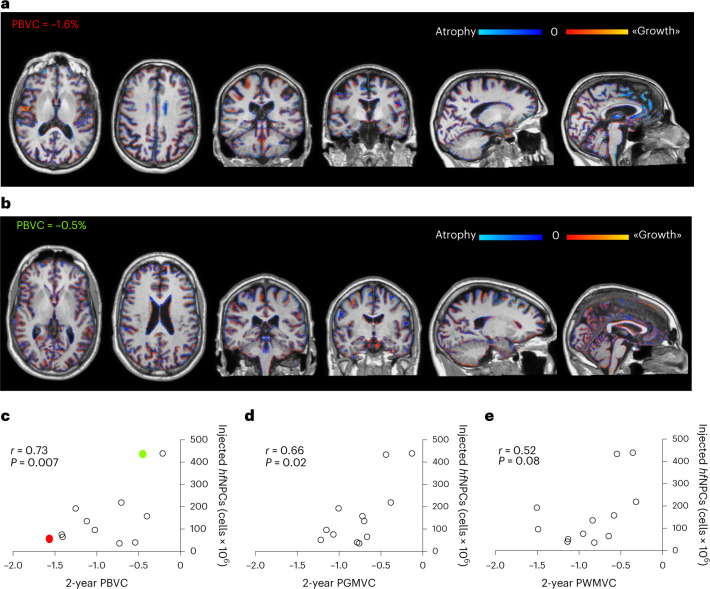
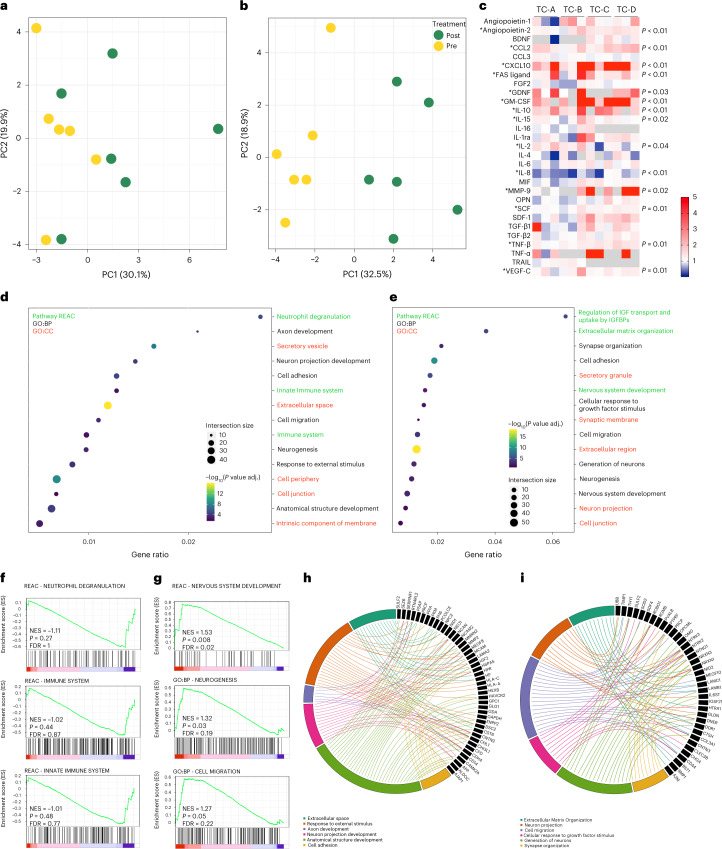
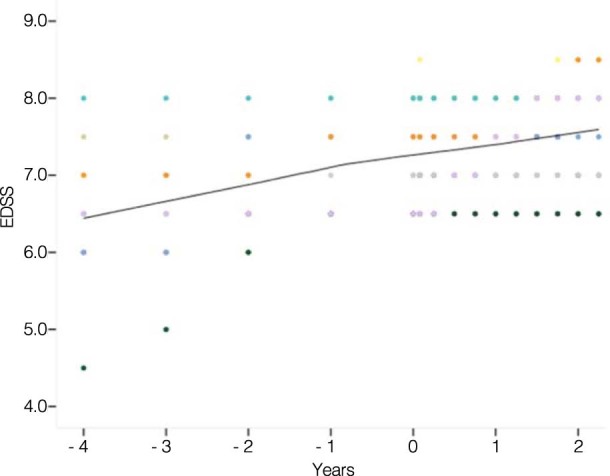
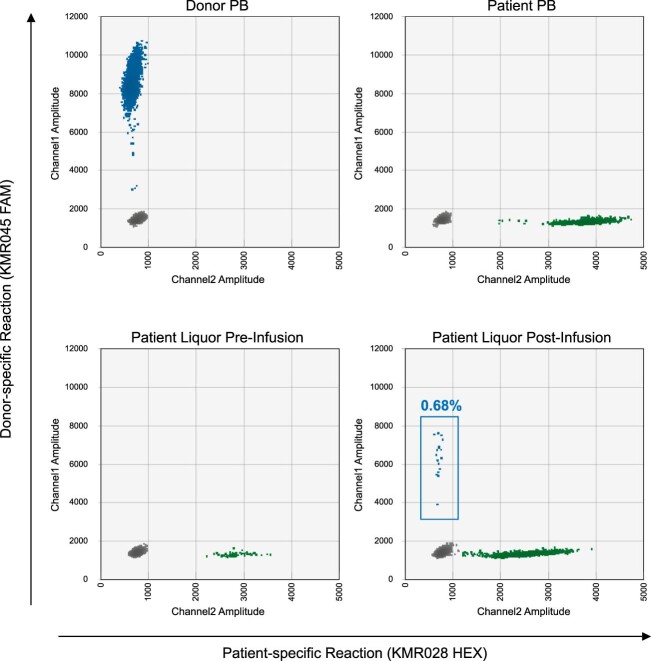
Innovative pro-regenerative treatment strategies for progressive multiple sclerosis (PMS), combining neuroprotection and immunomodulation, represent an unmet need. Neural precursor cells (NPCs) transplanted in animal models of multiple sclerosis have shown preclinical efficacy by promoting neuroprotection and remyelination by releasing molecules sustaining trophic support and neural plasticity. Here we present the results of STEMS, a prospective, therapeutic exploratory, non-randomized, open-label, single-dose-finding phase 1 clinical trial ( NCT03269071 , EudraCT 2016-002020-86), performed at San Raffaele Hospital in Milan, Italy, evaluating the feasibility, safety and tolerability of intrathecally transplanted human fetal NPCs (hfNPCs) in 12 patients with PMS (with evidence of disease progression, Expanded Disability Status Scale ≥6.5, age 18-55 years, disease duration 2-20 years, without any alternative approved therapy). The safety primary outcome was reached, with no severe adverse reactions related to hfNPCs at 2-year follow-up, clearly demonstrating that hfNPC therapy in PMS is feasible, safe and tolerable. Exploratory secondary analyses showed a lower rate of brain atrophy in patients receiving the highest dosage of hfNPCs and increased cerebrospinal fluid levels of anti-inflammatory and neuroprotective molecules. Although preliminary, these results support the rationale and value of future clinical studies with the highest dose of hfNPCs in a larger cohort of patients.


Conflict of interest statement

G.M. is the inventor of patent number EP1904073 (Europe) and US2008274089 (USA) filed on 12 July 2006. The other authors declare no competing interests.

Figures

Fig. 1
Fig. 1. Study design.
a, The Cell-based Medicinal Product used for transplantation originated from non-immortalized hfNPCs (BI-0194-008 cell line) obtained from the telencephalon and diencephalon of a single 10–12 weeks post-conception (WPC) human fetus, after elective pregnancy termination. hfNPCs were in vitro expanded and underwent quality control tests. The safety profile of the hfNPC cell line was tested in vivo in CD-1 mice immunosuppressed via cyclosporin. Medicinal product manufacturing and release were performed according to GMP conditions. b, CONSORT flow diagram. c, After enrollment, patients underwent baseline evaluation: neurological examination, blood tests, neurophysiological and neuroradiological assessments. Enrolled patients were divided into four consecutive TCs and received a single intrathecal injection of hfNPCs according to the following escalating doses: TC-A: 0.7 × 106 ± 10% cells per kilogram of body weight; TC-B: 1.4 × 106 ± 10% cells per kilogram of body weight; TC-C: 2.8 × 106 ± 10% cells per kilogram of body weight; and TC-D: 5.7 × 106 ± 10% cells per kilogram of body weight. Patients were treated with tacrolimus for 96 weeks after the transplantation (0.05 mg/kg twice daily gradually tapered to a blood level target of 5–10 ng/ml) and oral prednisone 50 mg (starting the day before the procedure and tapered to 0 over 35 days). The safety profile of hfNPCs was evaluated via 22 follow-up visits, over 96 weeks after administration to monitor the survival, safety, tolerability and overall changes in the neurological status. A diagnostic lumbar puncture was performed 3 months after transplantation for safety reasons in all treated patients. Some icons of the figure were created with BioRender. b.w., body weight; W, weeks.
Fig. 2
Fig. 2. The number of injected hfNPCs inversely correlates with brain volume loss.
Color-coded areas of brain atrophy (blue) and growth (red) representing PBVC at 2 years from hfNPC transplantation in two representative patients, respectively, receiving a low dose (a, red in c) and high dose (b, green in c) of hfNPCs. c, Lower rates of total brain atrophy (percentage of brain volume change [PBVC]) significantly correlate with the number of injected hfNPCs (r = 0.73, P = 0.007). Two-sided Spearman’s correlation test. d, Lower rates of GM atrophy (percentage of gray matter volume change [PGMVC]) significantly correlate with the number of injected hfNPCs (r = 0.66, P = 0.02). Two-sided Spearman’s correlation test. e, Although not statistically significant, lower rates of brain WM atrophy (percentage of white matter volume change [PWMVC]) seem to correlate with high number of injected hfNPCs (r = 0.52, P = 0.08). Two-sided Spearman’s correlation test.
Fig. 3
Fig. 3. CSF immunological and proteomic profile.
PCA of the detectable CSF analytes evaluated at baseline (yellow) and 3 months after (green) transplantation in the low-dose (n.6) (a) and high-dose (n.6) (b) groups. a, In the low-dose group, the first two principal components, PC1 and PC2, explained 30.1% and 19.9% of the variation, respectively. b, In the high-dose group, PC1 and PC2, explained 32.5% and 18.9% of the variation, respectively, with a clear distinction between baseline and 3-month follow-up samples. c, Heat map representing the fold change (red, upregulation; blue, downregulation) of CSF analyte (y axis) between baseline and 3-month follow-up for each patient (x axis). Differences in the expression of each analyte were calculated by a non-parametric exact two-sided Wilcoxon test. * indicates statistically significant difference (exact P < 0.05). d,e, Pathway enrichment analysis on CSF differentially expressed proteins after transplantation in the ‘low-dose’ (d) and ‘high-dose’ groups (e). Dot plots of enriched Reactome (REAC) pathways and Gene Ontology (GO) terms (REAC in green labels, GO:BP in black labels and GO:CC in red labels) of biological interest selected among the top enriched terms (FDR < 0.05). The x axis represents the ‘rich factor’ (gene ratio) of each term. The dots’ size and color represent the gene number (intersection size) and the adjusted P value (−log10[P value adj.]), respectively. f,g, Curves of pre-ranked GSEA for selected datasets, showing the profile of the running enrichment score (ES) and positions of gene set members on the rank-ordered list. The GSEA curves of neutrophil degranulation, immune system and innate immune system pathways show a trend for a negative enrichment in the low-dose group (f). In the high-dose group, the GSEA curves of nervous system development pathway, and neurogenesis and cell migration GO terms show significant positive enrichment (g). Comparisons were performed using a two-sided paired Studentʼs t-test. Significance levels were adjusted with the Benjamini–Hochberg multi-test correction. h,i, Chord plots of enriched pathways of biological interest, selected among the top 20 enriched, in the low-dose (h) and high-dose (i) groups.
Extended Data Fig. 1
Extended Data Fig. 1. Slope of annual EDSS change before and after transplantation.
The slope of mean EDSS rate of change in the 4 years before transplantation (+0.24 EDSS points/year [range 0–0.70]) and in the 2 years after transplant (+0.13 [range 0–0.80]); (p = 0.23, Exact Two-sided Wilcoxon test; p = 0.18 random effect linear model).
Extended Data Fig. 2
Extended Data Fig. 2. Microchimerism CSF analysis.
Patient 012 microchimerism analysis. In the two-dimensional scatter plots, the y-axis indicates detection of genomes bearing the donor-specific polymorphism (KMR045 marker, blue dots), and the x-axis measures the detection of genomes bearing the patient-specific polymorphism (KMR028 marker, blue dots). The upper panels display results from the germline control samples (DNA from donor and patient’s peripheral blood samples), and the lower panels display results from CSF samples collected before treatment and 3 months after transplantation.
Extended Data Fig. 3
Extended Data Fig. 3. CSF proteomic profile at baseline and 3 months after transplantation.
Principal component analysis (PCA) on the CSF proteins evaluated at baseline and three months after transplantation in the low-dose (n. 6) (a) and high-dose (n. 6) (b) groups. a) In the low-dose group, the first two principal components (PC1 and PC2) explained 26.1 and 16.6% of the variation, respectively, with a modest distinction of the two time points. b) In the high-dose group, the first two principal components (PC1 and PC2) explained the 22.8 and 14.5% of the variation, respectively, highlighting a distinction of the baseline from the 3-month follow-up samples. c, d) Unsupervised hierarchical clustering of CSF differentially expressed proteins between baseline and 3-month follow-up and the related heatmap in the low-dose (c) and high-dose (d) groups of patients.
Extended Data Fig. 4
Extended Data Fig. 4. Top enriched pathways and gene ontology terms in CSF differentially expressed proteins.
The top enriched (FDR < 0.05) Reactome (REAC) pathways (a, b), gene ontology (GO) terms concerning biological process (GO:BP) (c, d), to molecular function (GO:MF) (e, f), and to cellular component (GO:CC) (g, h). The low-dose group (n. 6) is represented on the left, the high-dose group (n. 6) on the right. On the y-axes the enriched pathways are listed, while the x-axis represents the ‘rich factor’ (gene ratio) of each term. The size and colour of dots represent the gene number (intersection size) and the adjusted p-value (reported as -Log10[p.value.adj]), respectively. Comparisons were performed using a two-sided paired Student T-test. Significance levels were adjusted with the Benjamini-Hochberg multitest correction.
Extended Data Fig. 5
Extended Data Fig. 5. CSF metabolomic profile at baseline and 3 months after transplantation.
a, b) Unsupervised hierarchical clustering of CSF differentially expressed metabolites in positive (POS) and negative (NEG) mass spectrometry modalities between baseline and 3-month follow-up and the related heatmap in the low-dose (n. 6) (a) and high-dose (n. 6) (b) groups of patients. The pathway analysis performed on these metabolites revealed the involvement of pathways related to phenylalanine, tyrosine, and tryptophan biosynthesis and metabolism in the low-dose (c) and high-dose (d) groups of patients. Comparisons were performed using a two-sided paired Student T-test. Significance levels were adjusted with the Benjamini-Hochberg multitest correction.

Comment in

References

    1. Faissner S, Plemel JR, Gold R, Yong VW. Progressive multiple sclerosis: from pathophysiology to therapeutic strategies. Nat. Rev. Drug Discov. 2019;18:905–922. doi: 10.1038/s41573-019-0035-2. - DOI - PubMed
    1. Finkel, Z. et al. Diversity of adult neural stem and progenitor cells in physiology and disease. Cells10, 2045 (2021). - PMC - PubMed
    1. Zhang Q, Li J, An W, Fan Y, Cao Q. Neural stem cell secretome and its role in the treatment of neurodegenerative disorders. J. Integr. Neurosci. 2020;19:179–185. doi: 10.31083/j.jin.2020.01.1142. - DOI - PubMed
    1. Pluchino S, et al. Neurosphere-derived multipotent precursors promote neuroprotection by an immunomodulatory mechanism. Nature. 2005;436:266–271. doi: 10.1038/nature03889. - DOI - PubMed
    1. Muller FJ, Snyder EY, Loring JF. Gene therapy: can neural stem cells deliver? Nat. Rev. Neurosci. 2006;7:75–84. doi: 10.1038/nrn1829. - DOI - PubMed

Publication types

Associated data