Clinical Trial
. 2023 Jan;29(1):104-114.
doi: 10.1038/s41591-022-02128-z. Epub 2023 Jan 9.

Autologous T cell therapy for MAGE-A4+ solid cancers in HLA-A*02+ patients: a phase 1 trial

Affiliations
Clinical Trial

Autologous T cell therapy for MAGE-A4+ solid cancers in HLA-A*02+ patients: a phase 1 trial

David S Hong et al. Nat Med. 2023 Jan.

Abstract

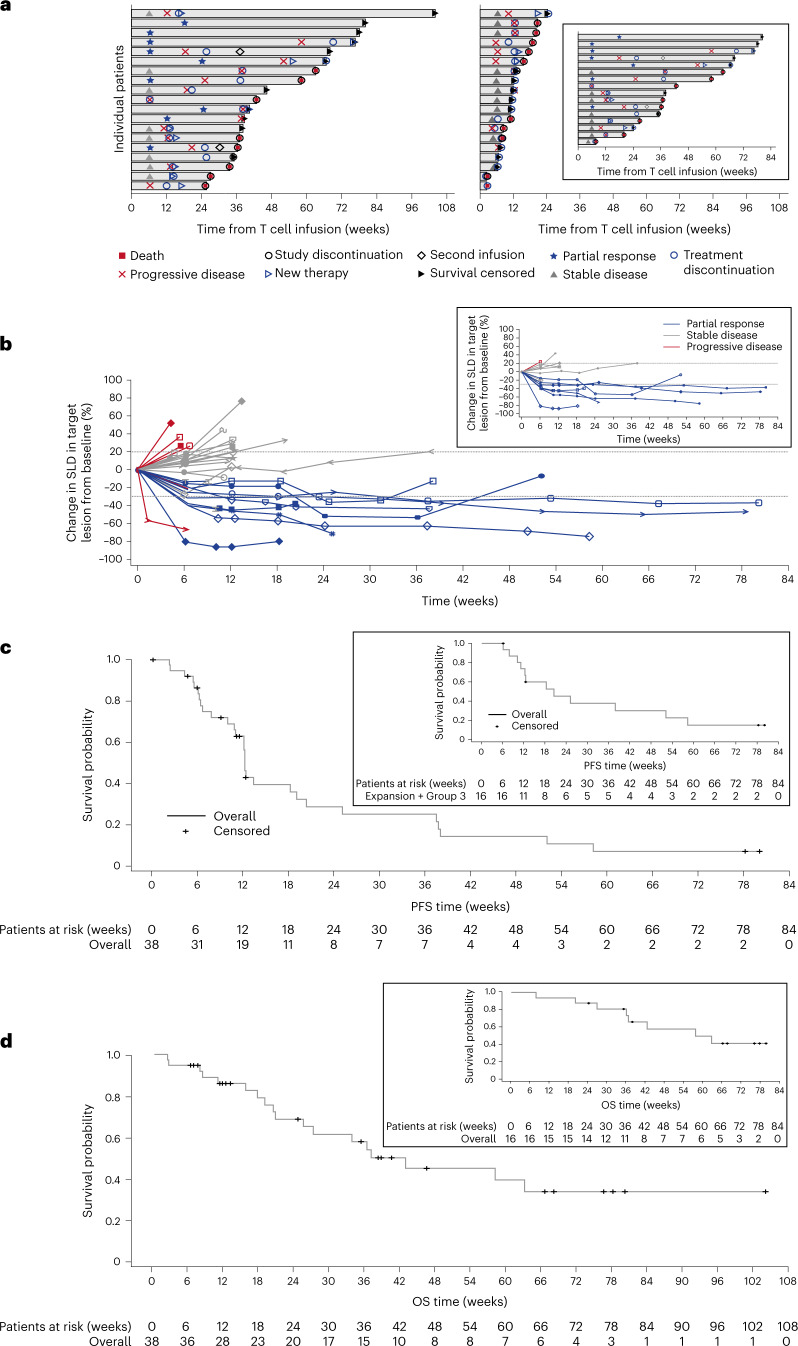
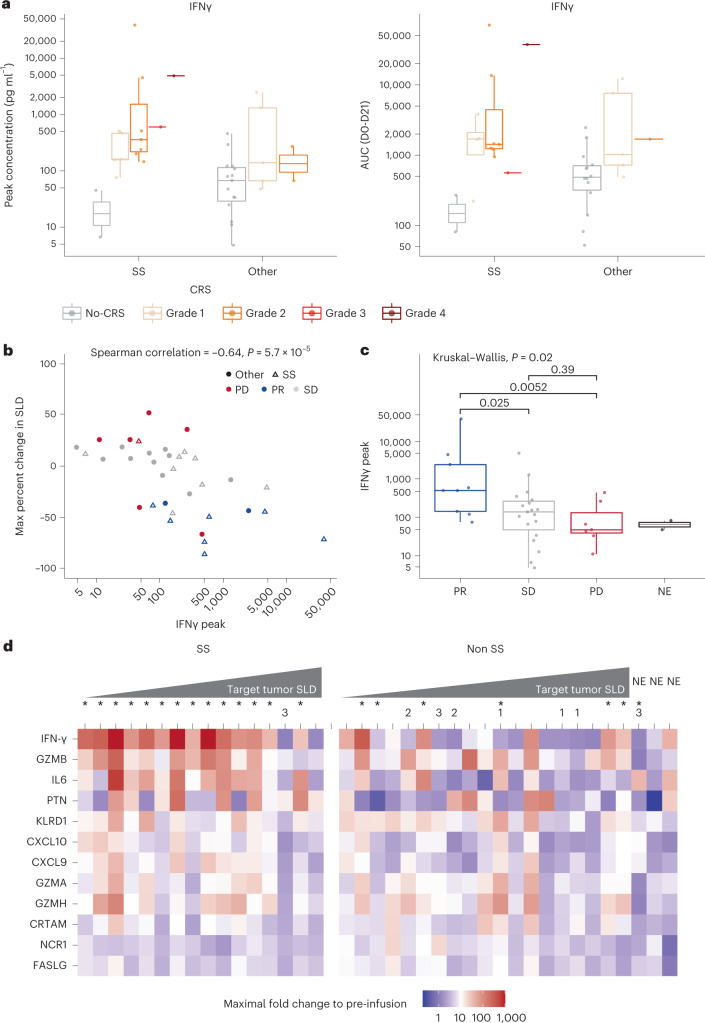
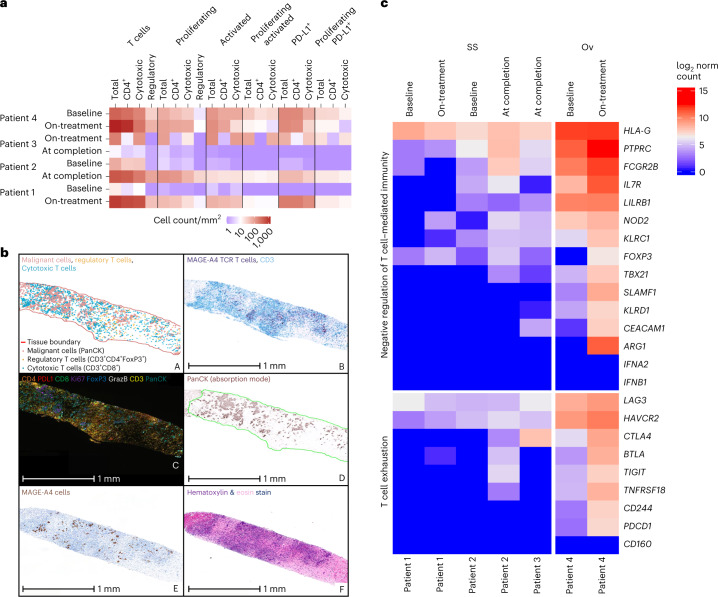
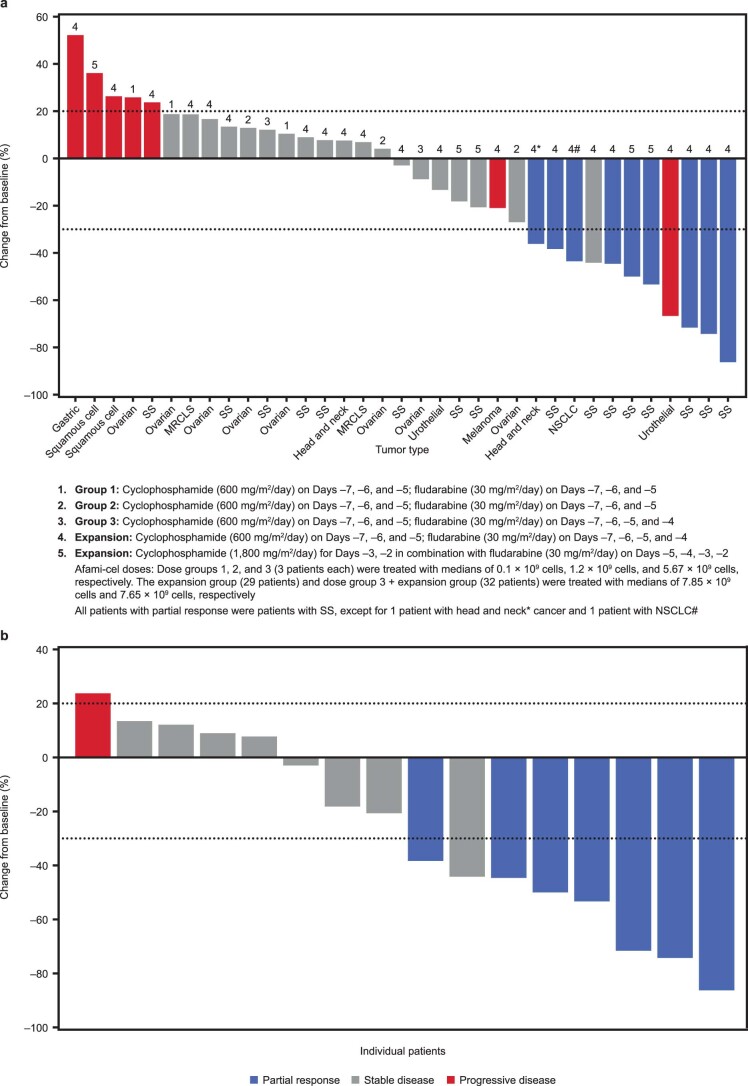
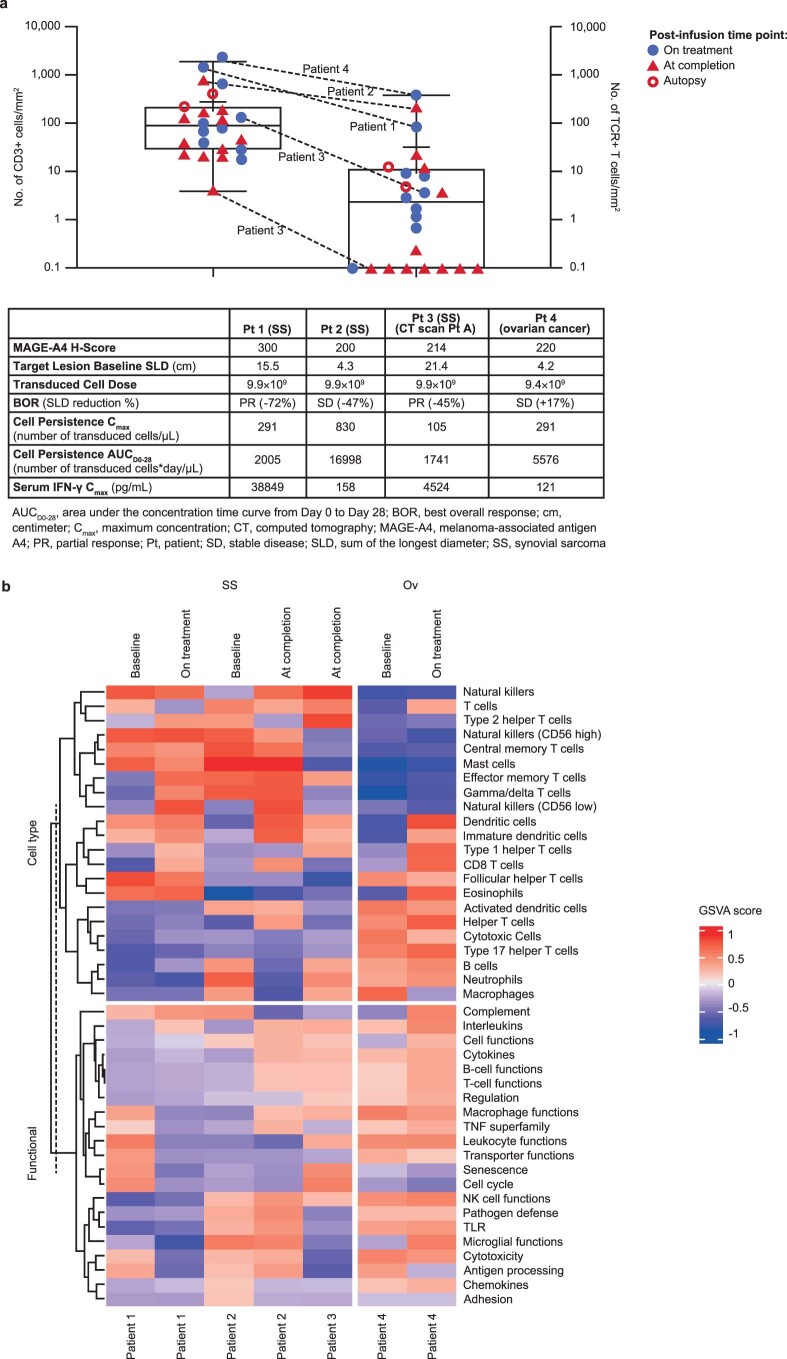
Affinity-optimized T cell receptors can enhance the potency of adoptive T cell therapy. Afamitresgene autoleucel (afami-cel) is a human leukocyte antigen-restricted autologous T cell therapy targeting melanoma-associated antigen A4 (MAGE-A4), a cancer/testis antigen expressed at varying levels in multiple solid tumors. We conducted a multicenter, dose-escalation, phase 1 trial in patients with relapsed/refractory metastatic solid tumors expressing MAGE-A4, including synovial sarcoma (SS), ovarian cancer and head and neck cancer ( NCT03132922 ). The primary endpoint was safety, and the secondary efficacy endpoints included overall response rate (ORR) and duration of response. All patients (N = 38, nine tumor types) experienced Grade ≥3 hematologic toxicities; 55% of patients (90% Grade ≤2) experienced cytokine release syndrome. ORR (all partial response) was 24% (9/38), 7/16 (44%) for SS and 2/22 (9%) for all other cancers. Median duration of response was 25.6 weeks (95% confidence interval (CI): 12.286, not reached) and 28.1 weeks (95% CI: 12.286, not reached) overall and for SS, respectively. Exploratory analyses showed that afami-cel infiltrates tumors, has an interferon-γ-driven mechanism of action and triggers adaptive immune responses. In addition, afami-cel has an acceptable benefit-risk profile, with early and durable responses, especially in patients with metastatic SS. Although the small trial size limits conclusions that can be drawn, the results warrant further testing in larger studies.


Conflict of interest statement

D.S.H. reports grants and personal fees from Adaptimmune related to this research. Outside the submitted work, D.S.H. reports grants from AbbVie, Adlai Nortye, Bristol Myers Squibb, Daiichi Sankyo, Eisai, Fate Therapeutics, Ignyta, Kite, Kyowa, Loxo Oncology, Merck, MedImmune, Mirati, miRNA, Molecular Templates, Mologen, NCI-CTEP, Novartis, Turning Point Therapeutics, EMD Serono, Erasca, Millenium, Navier, Verstatem and VM Oncology; grants and personal fees from Infinity, Pfizer, Seattle Genetics and Numa; grants, personal fees and non-financial support from Amgen, Genentech, Bayer and Takeda; grants and non-financial support from AstraZeneca, Genmab, GlaxoSmithKline and Eli Lilly; non-financial support from AACR, ASCO, Celgene and Philips; personal fees and non-financial support from Janssen; personal fees from Alpha Insights, Axiom, Baxter, Acuta, GLG, Group H, Guidepoint, HCW Precision, Medscape, Merrimack, Prime Oncology, Trieza Therapeutics, WebMD, ST Cube, Tavistock, Boxer Capital, COG and ECOR1 during the conduct of the study; and roles in Molecular Match (advisor), OncoResponse (founder) and Presagia (advisor). B.V.T. reports personal fees, non-financial support and other from Adaptimmune during the conduct of the study related to this research. Outside the submitted work, B.V.T. reports grants from Pfizer, Merck and Tracon Pharmaceuticals; grants, personal fees, non-financial support and other from GlaxoSmithKline; personal fees from Accuronix Therapeutics, ADRx, Ayala Pharmaceuticals, Cytokinetics, Bayer, Bionest Partners, Intellisphere LLC, Hinshaw & Culbertson LLP, Rodney Law, CRICO Risk Management Foundation and Tracey & Fox Law Firm; having attended advisory board meetings for Apexigen, Daiichi Sankyo, Deciphera Pharmaceuticals, Epizyme, GlaxoSmithKline, Novartis and Eli Lilly; and being a board member for Polaris, outside the submitted work. S.B., C.M., Q.L., A.J.T., J.P.S., R.W., T.T., T.A., S.R., A.S., L.F., J.-M.N., R.B., M.I., R.N., N.B., G.B., Z.W., D.G.B., E.V.W., E.E., P.M.F., E.N. and D.W. report employment by Adaptimmune and stock or stock options in Adaptimmune related to this research. M.L.J. reports grants to the institution from Adaptimmune related to this research. Outside the submitted work, M.L.J. reports grants to the institution from AbbVie, Amgen, Apexigen, Arcus Biosciences, Array BioPharma, Artios Pharma, AstraZeneca, ATRECA, BeiGene, BerGenBio, Birdie Pharmaceuticals/Seven & Eight Biopharmaceuticals, Boehringer Ingelheim, Calithera Biosciences, Checkpoint Theapeutics, Corvus, Cytomx, Daiichi Sankyo, Dracen Pharmaceutics, Dynavax, EMD Serono, Genentech/Roche, Genmab, Genocea, GlaxoSmithKline, Gritstone Oncology, Harpoon Therapeutics, Hengrui Therapeutics, Immunocore, Incyte, Janssen, Eli Lilly, Loxo Oncology, Lycera, Merck, Mirati Therapeutics, Neovia, Novartis, Pfizer, PMV Pharmaceuticals, Regeneron, Ribon Therapeutics, Sanofi, Shattuck Labs, Silicon Therapeutics, Stemcentrx, Syndax, Takeda, Tarveda Therapeutics, TCR2 Therapeutics, TMUNITY Therapeutics, University of Michigan and WindMIL Therapeutics; other from spouse role as a contract lobbyist for Astellas and Otsuka Pharmaceuticals; and other to the institution from AbbVie, Amgen, AstraZeneca, Boehringer Ingelheim, Bristol Myers Squibb, Calithera Biosciences, Celgene, Daiichi Sankyo, Editas Medicine, Eisai, EMD Serono, G1 Therapeutics, Genentech/Roche, GlaxoSmithKline, Gritstone Oncology, Ideaya Biosciences, Incyte, Janssen, Eli Lilly, Loxo Oncology, Merck, Mirati Therapeutics, Novartis, Pfizer, Ribon Therapeutics, Sanofi and WindMIL Therapeutics. A.J.O. reports non-financial support from Adaptimmune during the conduct of the study related to this research. Outside the submitted work, A.J.O. reports personal fees from Merck, Bristol Myers Squibb, Sanofi, Eisai and Pfizer. J.M.C. reports grants from Adaptimmune related to this study. Outside the submitted work, J.M.C. reports grants from Bristol Myers Squibb, CBMG, Spectrum, Medpacto, Bayer, AbbVie, Moderna, GlaxoSmithKline, Array and CGMB; personal fees from Guardant; grants, personal fees and non-financial support from AstraZeneca, Pfizer, NGM Biopharmaceuticals, Merck and Lung Cancer Initiative of North Carolina; and grants and personal fees from Genentech. D.A., P.K., F.D.B., J.K.E., D.K., A.C., A.G.ʼM. and D.A.L. declare no competing interests. G.R.B.J. reports grants or contracts from Adaptimmune related to this study. Outside the submitted work, G.R.B.J. reports grants or contracts from Amgen, Bayer, Elelixis, Daiichi Sankyo, GlaxoSmithKline, Immatics, Immunocore, Incyte, Kite Pharma, Macrogenics, Torque, AstraZeneca, Bristol Myers Squibb, Celgene, Genentech, MedImmune, Merck, Novartis, Roche, Sanofi, Xcovery, Tmunity Therapeutics, Regeneron, BeiGene, Repertoire Immune Medicines, Verastem, CytomX Therapeutics and Duality Biologics; consulting fees from Abbvie, Adicet, Amgen, Ariad, Bayer, Clovis Oncology, AstraZeneca, Bristol Myers Squibb, Celgene, Daiichi Sankyo, Instil Bio, Genentech, Genzyme, Gilead, Eli Lilly, Janssen, MedImmune, Merck, Novartis, Roche, Sanofi, Tyme Oncology, Xcovery, Virogin Biotech, Maverick Therapeutics, BeiGene, Rgeneron, Cytomx Therapeutics, Intervenn Biosciences and Onconova Therapeutics; participation on a Data Safety Monitoring Board or Advisory Board for Virogin Biotech and Maverick Therapeutics; stock or stock options in Virogin Biotech; and other financial or non-financial interests in Johnson & Johnson/Janssen (immediate family member). J.B. works as a contractor for Adaptimmune and contributed to the research reported here. A.G. reports consulting or advisory role for Kite Pharma, Amgen, Atara, Wugen and Celgene; research funding from Kite Pharma, Genentech and Amgen; and honoraria from Kite Pharma, outside the submitted work. Outside the submitted work, P.M. reports personal fees from Bristol Myers Squibb, Celgene, Fate Therapeutics, Janssen, Juno, Karyopharm, Magenta Therapeutics, Oncopeptides and Takeda. M.D. reports personal fees from Adaptimmune related to this research. Outside the submitted work, M.D. reports personal fees from Blueprint and personal fees and non-financial support from Deciphera, Epizyme and Daiichi Sankyo. K.O. reports grants from AstraZeneca and Tessaro outside the submitted work and patent PCT/US2014025673, licensed to Tactiva Therapeutics, and patent PCT/US2014025456, licensed to Tactiva Therapeutics. M.O.B. reports a consulting or advisory role with Adaptimmune related to this research. Outside the submitted work, M.OB. reports honoraria from Bristol Myers Squibb, Merck, Novartis and Roche; a consulting or advisory role with Bristol Myers Squibb, EMD Serono, Genzyme, GlaxoSmithKline, Immunocore, Immunovaccine, Instil Bio, Iovance Biotherapeutics, LaRoche Posay, Merck, Novartis, Sanofi and Sun Pharma; research funding from Merck and Takara; and expert testimony for Merck.

Figures

Fig. 1
Fig. 1. Study design and patient disposition.
RECIST.
Fig. 2
Fig. 2. Response and prognostic characteristics of the mITT population and patients with SS.
a, Swimmer’s plot of patient response over time in the mITT population (N = 38). The inset is response over time in patients with SS (n = 16). b, DoR profiles show the change from baseline in target lesions using RECIST version 1.1 in the overall treatment group after first infusion for responders and non-responders. The inset shows the change from baseline in target lesions in patients with SS. The probability of DoR was 100% (95% CI: 100, 100) at ≥12 weeks and 60% (95% CI: 20.4, 80.5) at ≥24 weeks. Duration of stable disease probability at ≥24 weeks for patients with SS was 50% (95% CI: 22.5%, 75.0%). c, Kaplan–Meier curves show PFS in the mITT population. The inset shows the PFS curve for the patients with SS. The median PFS for the mITT population was 12.3 weeks (95% CI: 10.9, 19.1) and 20.4 weeks (95% CI: 10.0, 52.1) for the patients with SS. PFS events in the mITT population included 25 events (65.8%) of PD and four events (10.5%) of death. PFS probability was 60% (95% CI: 44.8, 76.6) at 12 weeks and 30% (95% CI: 14.1, 45.2) at 24 weeks. PFS probability in the patients with SS was 70% (95% CI: 0.44, 0.89) at 12 weeks and 50% (95% CI: 0.19, 0.68) at 24 weeks. d, Kaplan–Meier curves show OS in the mITT population. The inset shows the OS for patients with SS. The median OS for the mITT population was 42.9 weeks (95% CI: 20.7, not reached) and 58.1 weeks (95% CI: 36.3, not reached) for patients with SS. OS probability was 90% (95% CI: 69.8, 94.0) at 12 weeks and 70% (95% CI: 49.6, 82.1) at 24 weeks. OS probability in patients with SS was 90% (95% CI: 0.63, 0.99) at 12 weeks and remained 90% (95% CI: 0.59, 0.97) at 24 weeks.
Fig. 3
Fig. 3. Serum IFNγ patient profiles and associations between peak and AUC concentrations of IFNγ levels and anti-tumor response.
a, Comparison of serum levels in patients with SS (no CRS n = 2, Grade 1 n = 5, Grade 2 n = 7, Grade 3 n = 1, Grade 4 n = 1) and those with other indications (no CRS n = 15, Grade 1 n = 5, Grade 2 n = 2) across CRS groups. Peak IFNγ levels (pg ml−1) were significantly greater in patients with CRS (all grades, n = 21) compared with non-CRS (n = 17) (median, 270.8 pg ml−1 and 47.7 pg ml−1, respectively; P = 0.00012). Calculated IFNγ AUC from days 0 to 21 was significantly greater in patients with CRS compared with non-CRS (median, 1,455.0 pg ml−1 and 467.0 pg ml−1, respectively; P = 0.00061) (Wilcoxon rank-sum test, two-sided). b, Serum IFNγ concentration (pg ml−1) measured across sample sets collected on days 0–21 after infusion. Magnitude of maximum percent change in SLD was positively correlated with reduction in target tumor lesion (Spearmanʼs r = −0.64; P = 0.000057). c, Peak serum IFNγ levels were significantly greater in patients with best overall responses of PR (n = 9) compared with PD (n = 7; P = 0.0052) and SD (n = 19; P = 0.025) (Kruskal–Wallis test, two-sided). d, Patients ranked by best percent change in SLD. Non-SS subset included three NE patients. The asterisk in superscript (*) indicates CRS; number indicates dose-escalation cohort. AUC, area under the curve; CRTAM, class I-restricted T cell-associated molecule; CXCL, chemokine (C-X-C motif) ligand; FASLG, FAS ligand; IQR, interquartile range; KLRD1, killer cell lectin like receptor D1; NCR1, natural cytotoxicity triggering receptor 1; PTN, pleiotrophin. Box plots depict median as horizontal lines within boxes, with box bounds as the first and third quartiles. Dots represent individual data points. Lower whiskers are minimum values within 1.5 times the IQR below the 25th percentile. Upper whiskers are maximum values within 1.5 times the IQR above the 75th percentile.
Fig. 4
Fig. 4. Detection of afami-cel and T cell phenotypes in patient tumor biopsies.
a, Digital image quantification of T cell markers (total CD3+), CD4 (CD3+CD4+), cytotoxic (CD3+CD8+), regulatory (CD3+CD4+FoxP3+) and co-staining for phenotypes (proliferating, Ki67+; activated, GrazB+; PD-L1+) and combination of these phenotypes for the four patients referenced in Extended Data Fig. 10a. Baseline biopsies were taken 2–5 weeks before afami-cel infusion. b, A multiparametric analysis of T cell infiltration in tumor biopsies using IHC, MAGE-A4 SPEAR RNAscope (Advanced Cell Diagnostics) and multiplex immunofluorescence. Images of post-infusion biopsy (liver) from Patient 4: A, spatial plot generated using spatial analysis module in HALO (Indica Labs) showing malignant cells (PanCK+ (red), regulatory (CD3+CD4+FoxP3+) T cells (yellow) and cytotoxic (CD3+CD8+) T cells (blue/cyan)). Scale bar is not applicable as this is not a raw image; B, CD3 IHC/SPEAR+ T cell RNAscope duplex (CD3 IHC staining (blue); MAGE-A4 SPEAR T cell staining (purple)); C, Ultivue 8-plex multiplex dataset showing CD4 (orange), PD-L1 (red), CD8 (green), Ki67 (purple), FoxP3 (blue), GrazB (white), CD3 (yellow) and PanCK (teal); D, PanCK immunofluorescence staining from Ultivue 8-plex panel (displayed in absorption mode in HALO for clarity); E, MAGE-A4 IHC stain (DAB (brown)); and F, hematoxylin (purple) and eosin (pink) stain. c, Heat map of log2-transformed normalized counts of genes associated with ‘T cell exhaustion’ and ‘Negative regulation of T cell-mediated immunity’ in baseline and post-infusion biopsies from Patients 1–4. Patients 1–3 were patients with SS; Patient 4 was a patient with ovarian cancer. DAB, 3,3′-diaminobenzidine; FoxP3, forkhead box protein 3; GrazB, granzyme B; Ov, ovarian; PanCK, pancytokeratin; PD-L1, programmed death ligand 1.
Extended Data Fig. 1
Extended Data Fig. 1. Study design.
HLA, human leukocyte antigen; IHC, immunohistochemistry; MAGE-A4, melanoma-associated antigen A4.
Extended Data Fig. 2
Extended Data Fig. 2. MAGE-A4 antigen H-score in the modified intent-to-treat population by tumor type.
Individual MAGE-A4 antigen H-scores per tumor type. The overall median MAGE-A4 H-score across all nine tumor types was 189 (range: 15–300). Median MAGE-A4 H-score was highest at 249 in synovial sarcoma (range: 60–300); melanoma sub-group excluded due to a single evaluable patient. Box plots depict median as horizontal lines within boxes, with box bounds as the first and third quartiles. Dots represent individual data points. Lower whisker is the minimum value of the data within 1.5 times the interquartile range below the 25th percentile. Upper whisker is the maximum value of the data within 1.5 times the interquartile range above the 75th percentile. MAGE-A4, melanoma-associated antigen A4.
Extended Data Fig. 3
Extended Data Fig. 3. Maximal change in target lesion from baseline using RECIST v1.1 (modified intent-to-treat population; N = 38).
(a) Maximal change in target lesion from baseline in the modified intent-to-treat population. Data for three patients were not available as of data cut-off on 1 September 2020. Each bar represents an individual patient. Nine patients responded to first infusion as determined by RECIST v1.1 criteria. All nine responders (23.7%) had a partial response with an overall response rate of 23.7% (95% CI: 11.4, 40.2). (b) Synovial sarcoma subgroup: Maximal change in target lesion from baseline in the synovial sarcoma subgroup. Each bar represents an individual patient. Seven of the nine responders were in the synovial sarcoma subgroup (n = 16) with a best overall response of partial response and an overall response rate of 43.8% (95% CI: 19.8, 70.1). Horizontal reference lines at -30% and 20%. CI, confidence interval; MRCLS, myxoid/round cell liposarcoma; NSCLS, non-small cell lung cancer; RECIST, Response Evaluation Criteria in Solid Tumors; SS, synovial sarcoma.
Extended Data Fig. 4
Extended Data Fig. 4. Afami-cel therapy leads to regression of large pleural-based thoracic metastasis in synovial sarcoma.
In Patient A, afami-cel was associated with reductions in metastatic disease in hemithorax, including regression of a large left lung pleural metastasis that crossed the midline at baseline (Patient A, upper right and upper left panels, respectively) and re-expansion of the right lung, as shown on a computed tomography scan at Week 12 post−afami-cel (Patient A, lower right panel, arrow), associated with patient-reported improvement in exertional dyspnea. In Patient B, afami-cel was associated with overall reduction in left lung pleural metastases including complete resolution of one pleural metastasis (Patient B, lower right panel, arrow). BOR, best overall response; MAGE-A4, melanoma-associated antigen A4; PR, partial response; SLD, sum of longest diameter; TTR, time to response.
Extended Data Fig. 5
Extended Data Fig. 5. Ratio of transduced CD4+ to CD8+ cells and memory sub-populations in afami-cel manufactured product.
(a) Ratio of CD4+ to CD8+ cell subsets within the transduced cells infused, derived from immunophenotyping: Ratios greater than 1 denote a CD4 bias in the transduced cells. Horizontal lines denote median values. Samples are grouped and color coded by BOR resulting from the infusion (blue PR, gray SD, red PD, black NE). Ratio of PR range 0.19–16.16 (median 1.30, n = 9) vs. SD range 0.03–11.58 (median 1.26, n = 16) vs. PD range 0.76–12.52 (median 3.94, n = 6). (b) Memory subset distribution by immunophenotyping within the transduced cells infused: The proportion of live single transduced afami-cel within the respective memory subsets is indicated by box plots for CD8+ afami-cel on the left and for CD4+ on the right. Samples are grouped and color coded by BOR resulting from the infusion (blue PR, gray SD, red PD, black NE). CM = central memory, CD45RA-CCR7+; EM = effector memory, CD45RA-CCR7-; EMRA = effector memory RA+, CD45RA+ CCR7-; SCM = stem cell memory, CD45RA+ CCR7+. Two-sided paired Wilcoxon test P values are shown linking compared cell types. Box plots depict median as horizontal lines within boxes, with box bounds as the first and third quartiles. Dots represent individual data points. Lower whisker is the minimum value of the data within 1.5 times the interquartile range below the 25th percentile. Upper whisker is the maximum value of the data within 1.5 times the interquartile range above the 75th percentile. BOR, best overall response; DEX, dextramer; NE, not evaluable; PD, progressive disease; PR, partial response; SD, stable disease.
Extended Data Fig. 6
Extended Data Fig. 6. Longitudinal immunophenotyping of memory subtypes within circulating afami-cel.
Percentage of parent population (a) CD4+ Dextramer+ and (b) CD8+ Dextramer+ within the respective sub-population flow gate in MP (manufactured product) and peripheral blood mononuclear cell samples at post-infusion timepoints (D, day; W, week; M, month, EOT, end of treatment). CM (central memory CD45RA-CCR7+); EM (effector memory CD45RA-CCR7-); EMRA (effector memory RA+, CD45RA+ CCR7-); SCM (stem cell memory, CD45RA+ CCR7+). Data are grouped by best overall response resulting from the infusion. PR (partial response), n = 9 patients; SD (stable disease), n = 17 patients; PD (progressive disease), n = 6 patients.
Extended Data Fig. 7
Extended Data Fig. 7. Serum cytokine profiles associated with cytokine release syndrome.
Peak IL-6 levels pg ml-1 (a, left panel), calculated IL-6 AUC Day 0–21 (a, right panel), peak GMCSF levels pg ml-1 (b, left panel) and calculated GMCSF AUC Day 0–21 (b, right panel) were significantly greater in patients with CRS (all grades, n = 21) compared with non-CRS (n = 17) in the mITT population (Supplementary Table 8). Box plots show comparison of serum levels in SS patients (no CRS n = 2, Grade 1 n = 5, Grade 2 n = 7, Grade 3 n = 1, Grade 4 n = 1) and those with other indications (no CRS n = 15, Grade 1 n = 5, Grade 2 n = 2) across CRS groups. Box plots depict median as horizontal lines within boxes, with box bounds as the first and third quartiles. Dots represent individual data points. Lower whisker is the minimum value of the data within 1.5 times the interquartile range below the 25th percentile. Upper whisker is the maximum value of the data within 1.5 times the interquartile range above the 75th percentile. AUC, area under the curve; CRS, cytokine release syndrome; GMCSF, granulocyte-macrophage colony-stimulating factor; IL, interleukin; SS, synovial sarcoma.
Extended Data Fig. 8
Extended Data Fig. 8. IL-15 serum concentrations in patients treated with high dose (3600 mg/m2) or low dose (1800 mg/m2) lymphodepleting chemotherapy pre- and post-lymphodepletion.
Serum IL-15 levels pg ml-1 were measured pre- and post-LD in Group 3/Expansion patients treated with ‘high’ LD (n = 7) or ‘low’ LD (n = 24*) regimen (*excludes one patient with an unevaluable baseline sample). Box plots depict median as horizontal lines within boxes, with box bounds as the first and third quartiles. Dots represent individual data points. Lower whisker is the minimum value of the data within 1.5 times the interquartile range below the 25th percentile. Upper whisker is the maximum value of the data within 1.5 times the interquartile range above the 75th percentile. IL, interleukin; LD, lymphodepletion.
Extended Data Fig. 9
Extended Data Fig. 9. Post-/pre-lymphodepleting chemotherapy serum IL-15 ratio in patients treated with high dose (3600 mg/m2) or low dose (1800 mg/m2) lymphodepleting chemotherapy.
Serum IL-15 concentration increased in post-LD versus pre-LD samples, and there was no difference in IL-15 concentrations between the two LD regimens in patients treated in Group 3/Expansion (median of ‘high’ LD 18.25 (n = 7), median of ‘low’ LD 12.87 (n = 24); P = 0.13, Two-sided Wilcoxon test). Box plots depict median as horizontal lines within boxes, with box bounds as the first and third quartiles. Dots represent individual data points. Lower whisker is the minimum value of the data within 1.5 times the interquartile range below the 25th percentile. Upper whisker is the maximum value of the data within 1.5 times the interquartile range above the 75th percentile. IL, interleukin; LD, lymphodepletion.
Extended Data Fig. 10
Extended Data Fig. 10. Detection of afami-cel and characterization of phenotypes in patient tumor biopsies.
(a) Quantification of CD3+ T cells and afami-cel in post-infusion tumor biopsies from dose expansion: Four patients with contrasting profiles were prioritized for multiplex immunofluorescence analyses (summarized in Fig. 4a). Patient 1, SS, on-treatment biopsy taken 8 weeks post-infusion; Patient 2, SS, at completion biopsy taken 17 weeks post-infusion; Patient 3, SS, on-treatment and at-completion biopsies taken 7 and 25 weeks post-infusion, respectively; Patient 4, Ov tumor, on-treatment biopsy taken 6 weeks post-infusion. Table summarizes key baseline tumor characteristics, afami-cel dose, post-infusion pharmacokinetic-pharmacodynamic findings, and BOR status for these four patients. Patients 1-3 were patients with SS; Patient 4 was a patient with Ov cancer. Box plots depict median as horizontal lines within boxes, with box bounds as the first and third quartiles. Dots represent individual data points. Lower whisker is the minimum value of the data within 1.5 times the interquartile range below the 25th percentile. Upper whisker is the maximum value of the data within 1.5 times the interquartile range above the 75th percentile. (b) Heatmap of GSVA scores of cell type specific and immune response categories gene lists in baseline and post-infusion biopsies from Patients 1‒4. AUC, area under the curve; BOR, best overall response; Cmax, maximum serum concentration; CT, computed tomography; GSVA, gene set variation analysis; IFN, interferon; MAGE-A4, melanoma-associated antigen A4; NK, natural killer; Ov, ovarian; PR, partial response; Pt, patient; SD, stable disease; SLD, sum of longest diameter; SS, synovial sarcoma; TCR, T-cell receptor; TLR, toll-like receptor; TNF, tumor necrosis factor.

References

    1. Caballero OL, Chen YT. Cancer/testis (CT) antigens: potential targets for immunotherapy. Cancer Sci. 2009;100:2014–2021. doi: 10.1111/j.1349-7006.2009.01303.x. - DOI - PMC - PubMed
    1. Daudi S, et al. Expression and immune responses to MAGE antigens predict survival in epithelial ovarian cancer. PLoS ONE. 2014;9:e104099. doi: 10.1371/journal.pone.0104099. - DOI - PMC - PubMed
    1. Sharma P, et al. Cancer-testis antigens: expression and correlation with survival in human urothelial carcinoma. Clin. Cancer Res. 2006;12:5442–5447. doi: 10.1158/1078-0432.CCR-06-0527. - DOI - PubMed
    1. Ishihara M, et al. MAGE-A4, NY-ESO-1 and SAGE mRNA expression rates and co-expression relationships in solid tumours. BMC Cancer. 2020;20:606. doi: 10.1186/s12885-020-07098-4. - DOI - PMC - PubMed
    1. Iura K, et al. Cancer-testis antigen expression in synovial sarcoma: NY-ESO-1, PRAME, MAGEA4, and MAGEA1. Hum. Pathol. 2017;61:130–139. doi: 10.1016/j.humpath.2016.12.006. - DOI - PubMed

Publication types

Associated data