. 2023 Feb;55(2):255-267.
doi: 10.1038/s41588-022-01254-1. Epub 2023 Jan 9.

Single-cell transcriptomic analysis of endometriosis

Affiliations

Single-cell transcriptomic analysis of endometriosis

Marcos A S Fonseca et al. Nat Genet. 2023 Feb.

Abstract

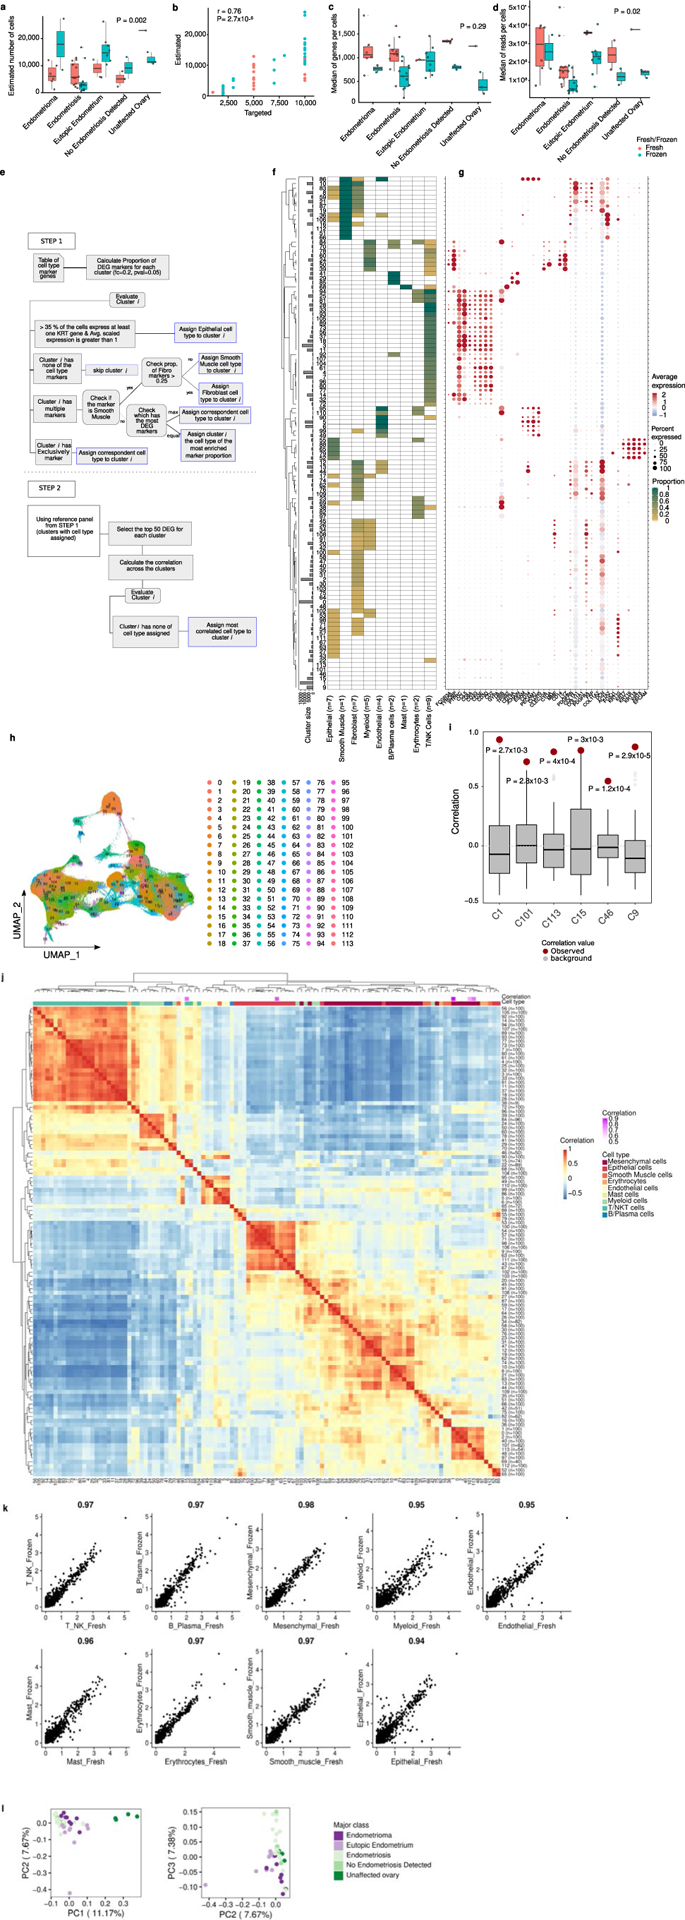
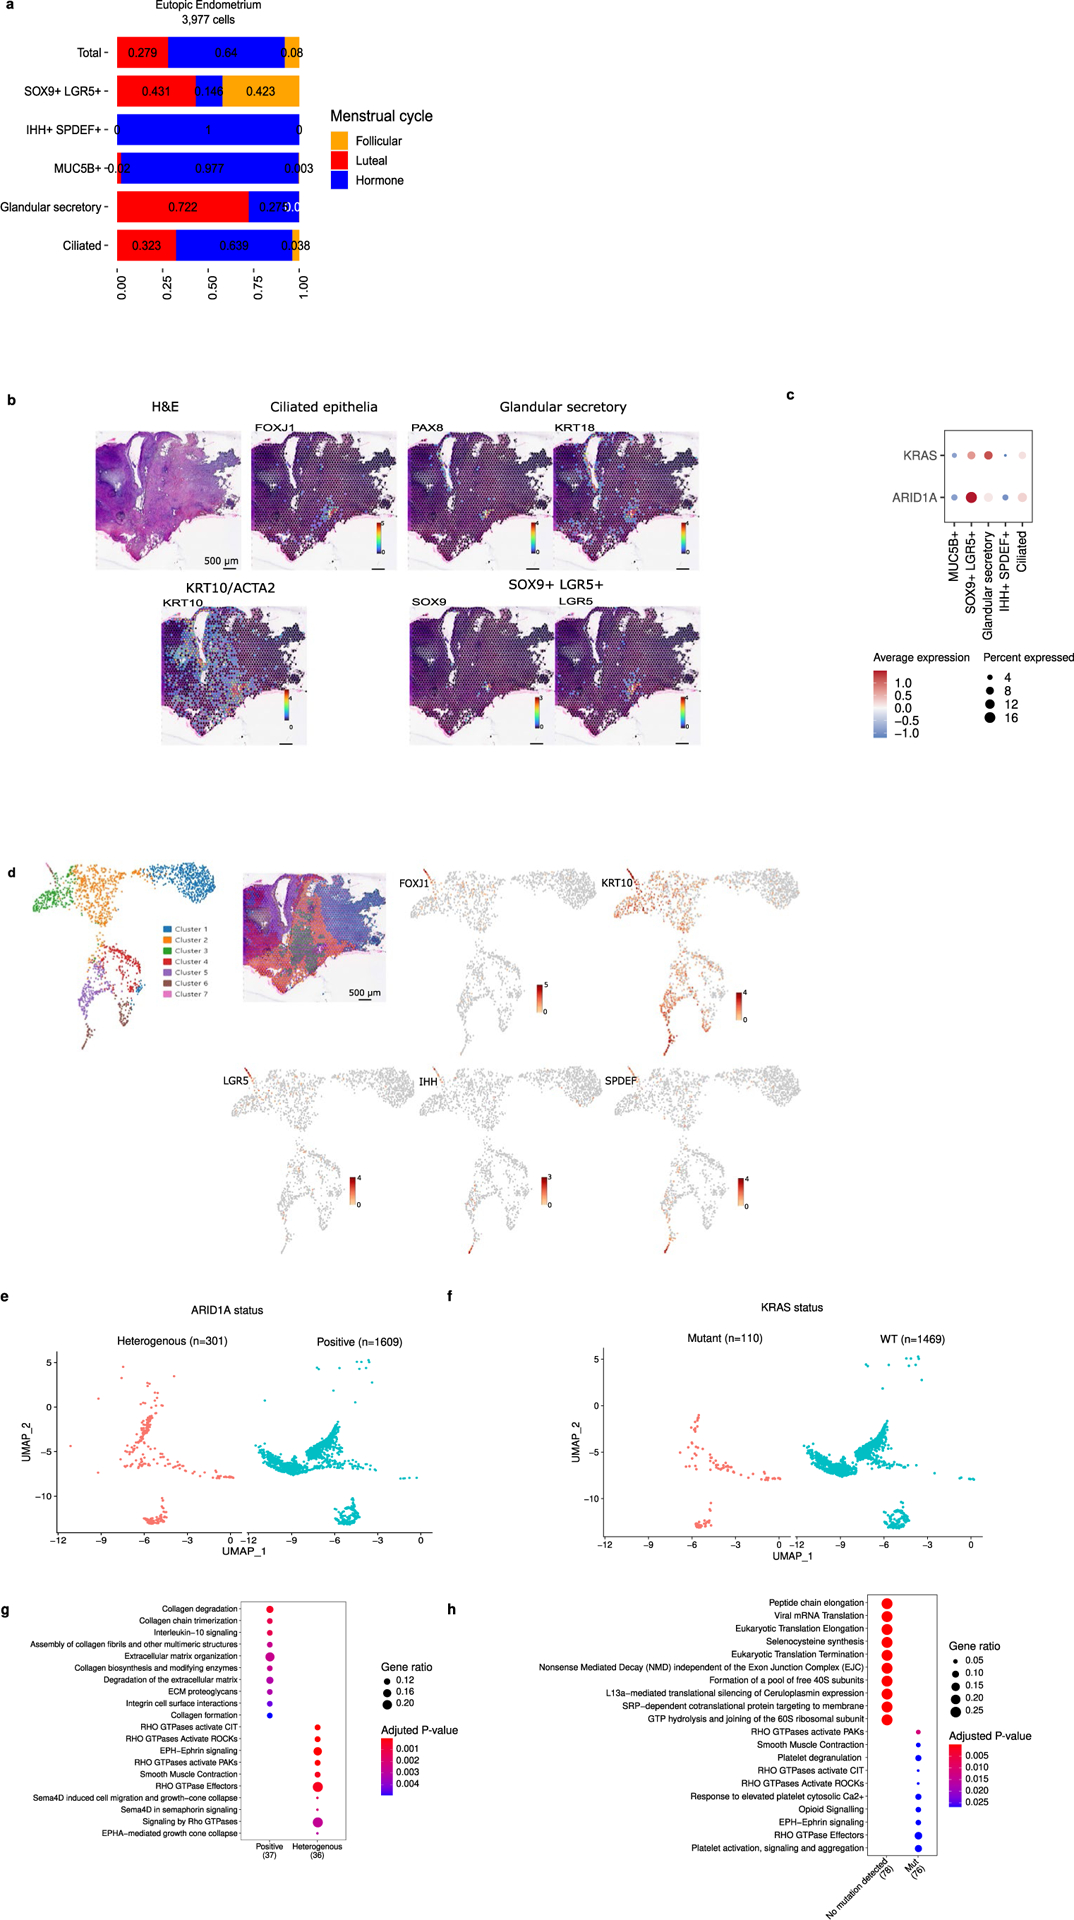
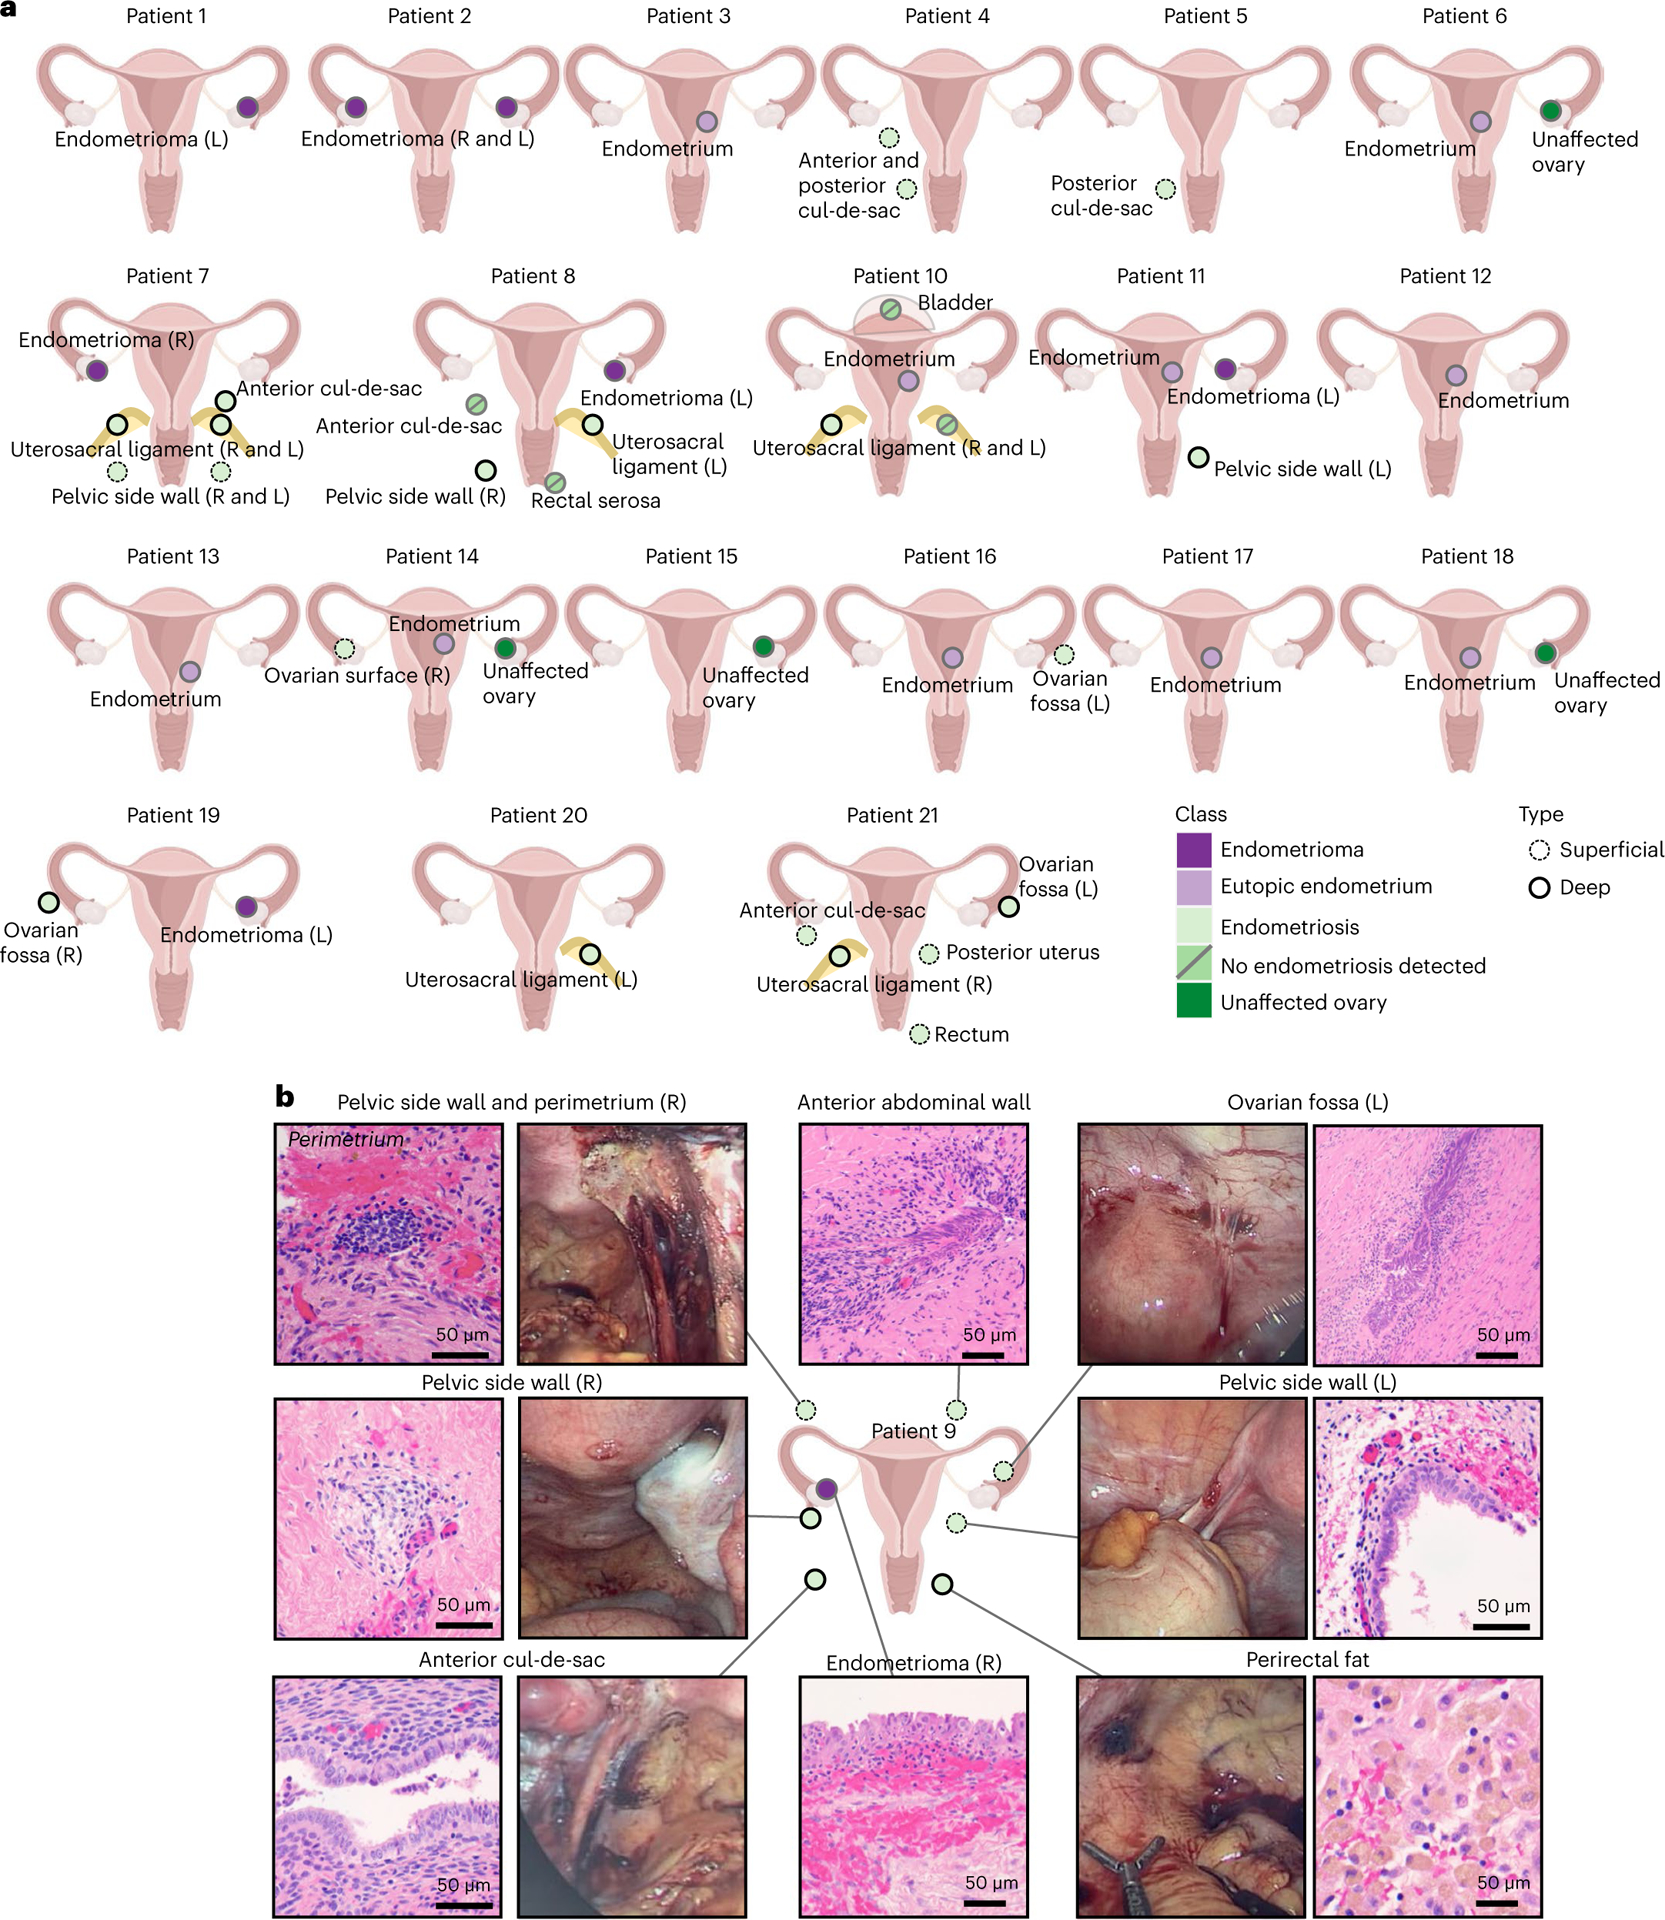
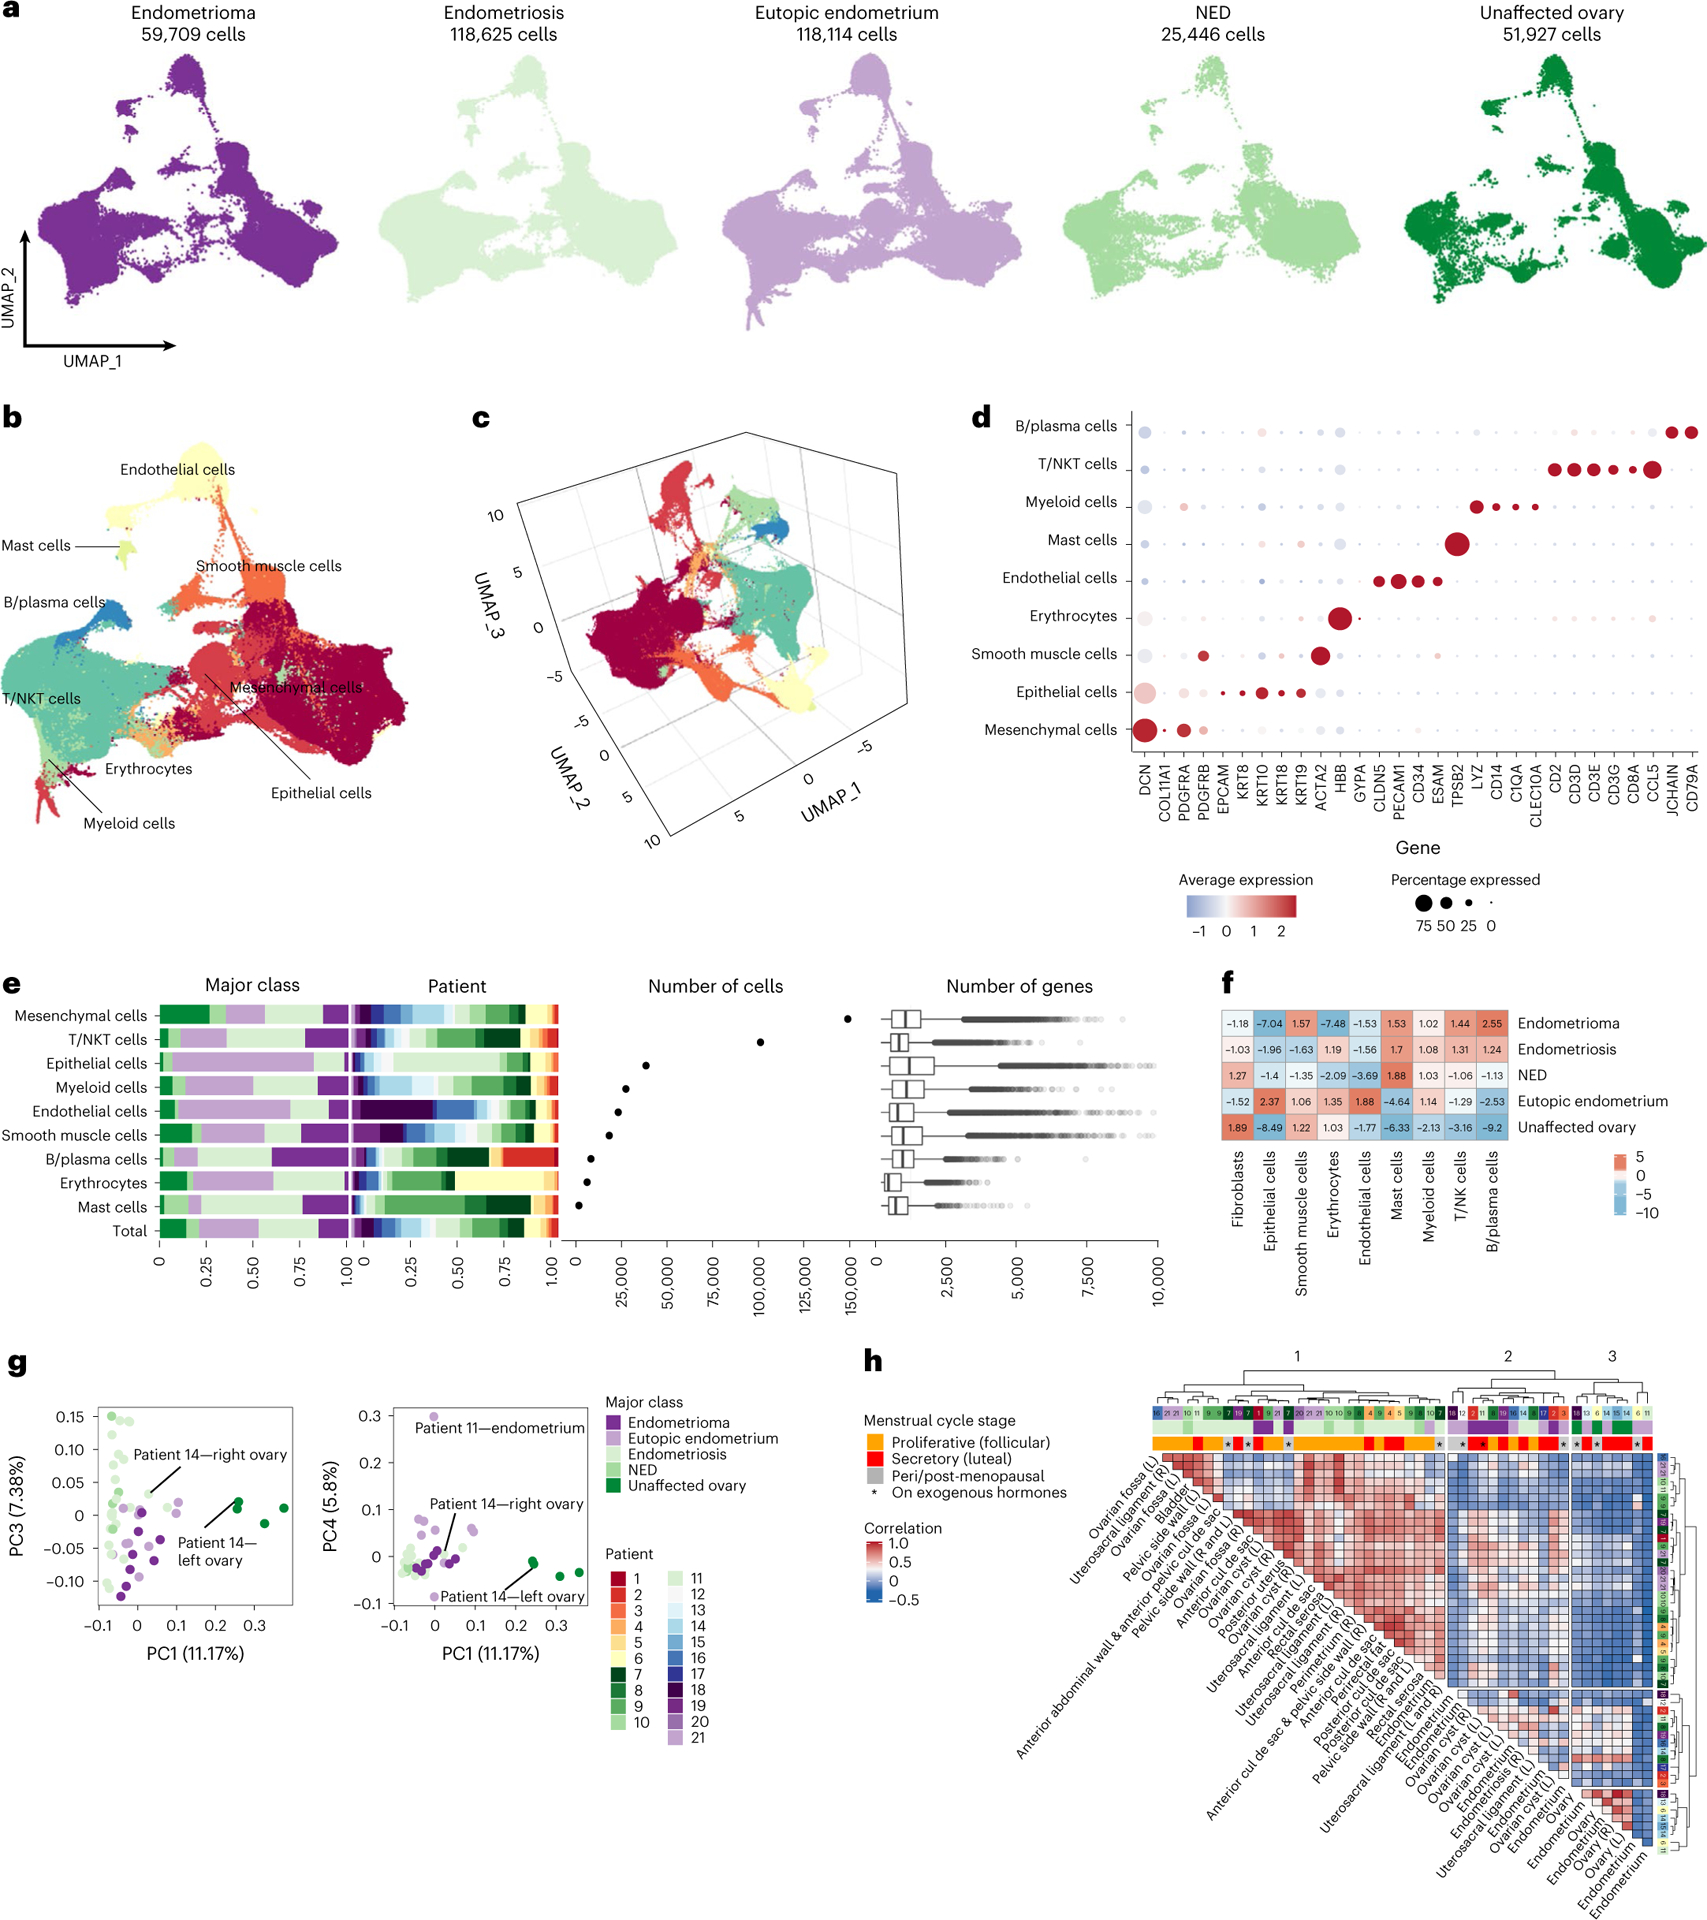
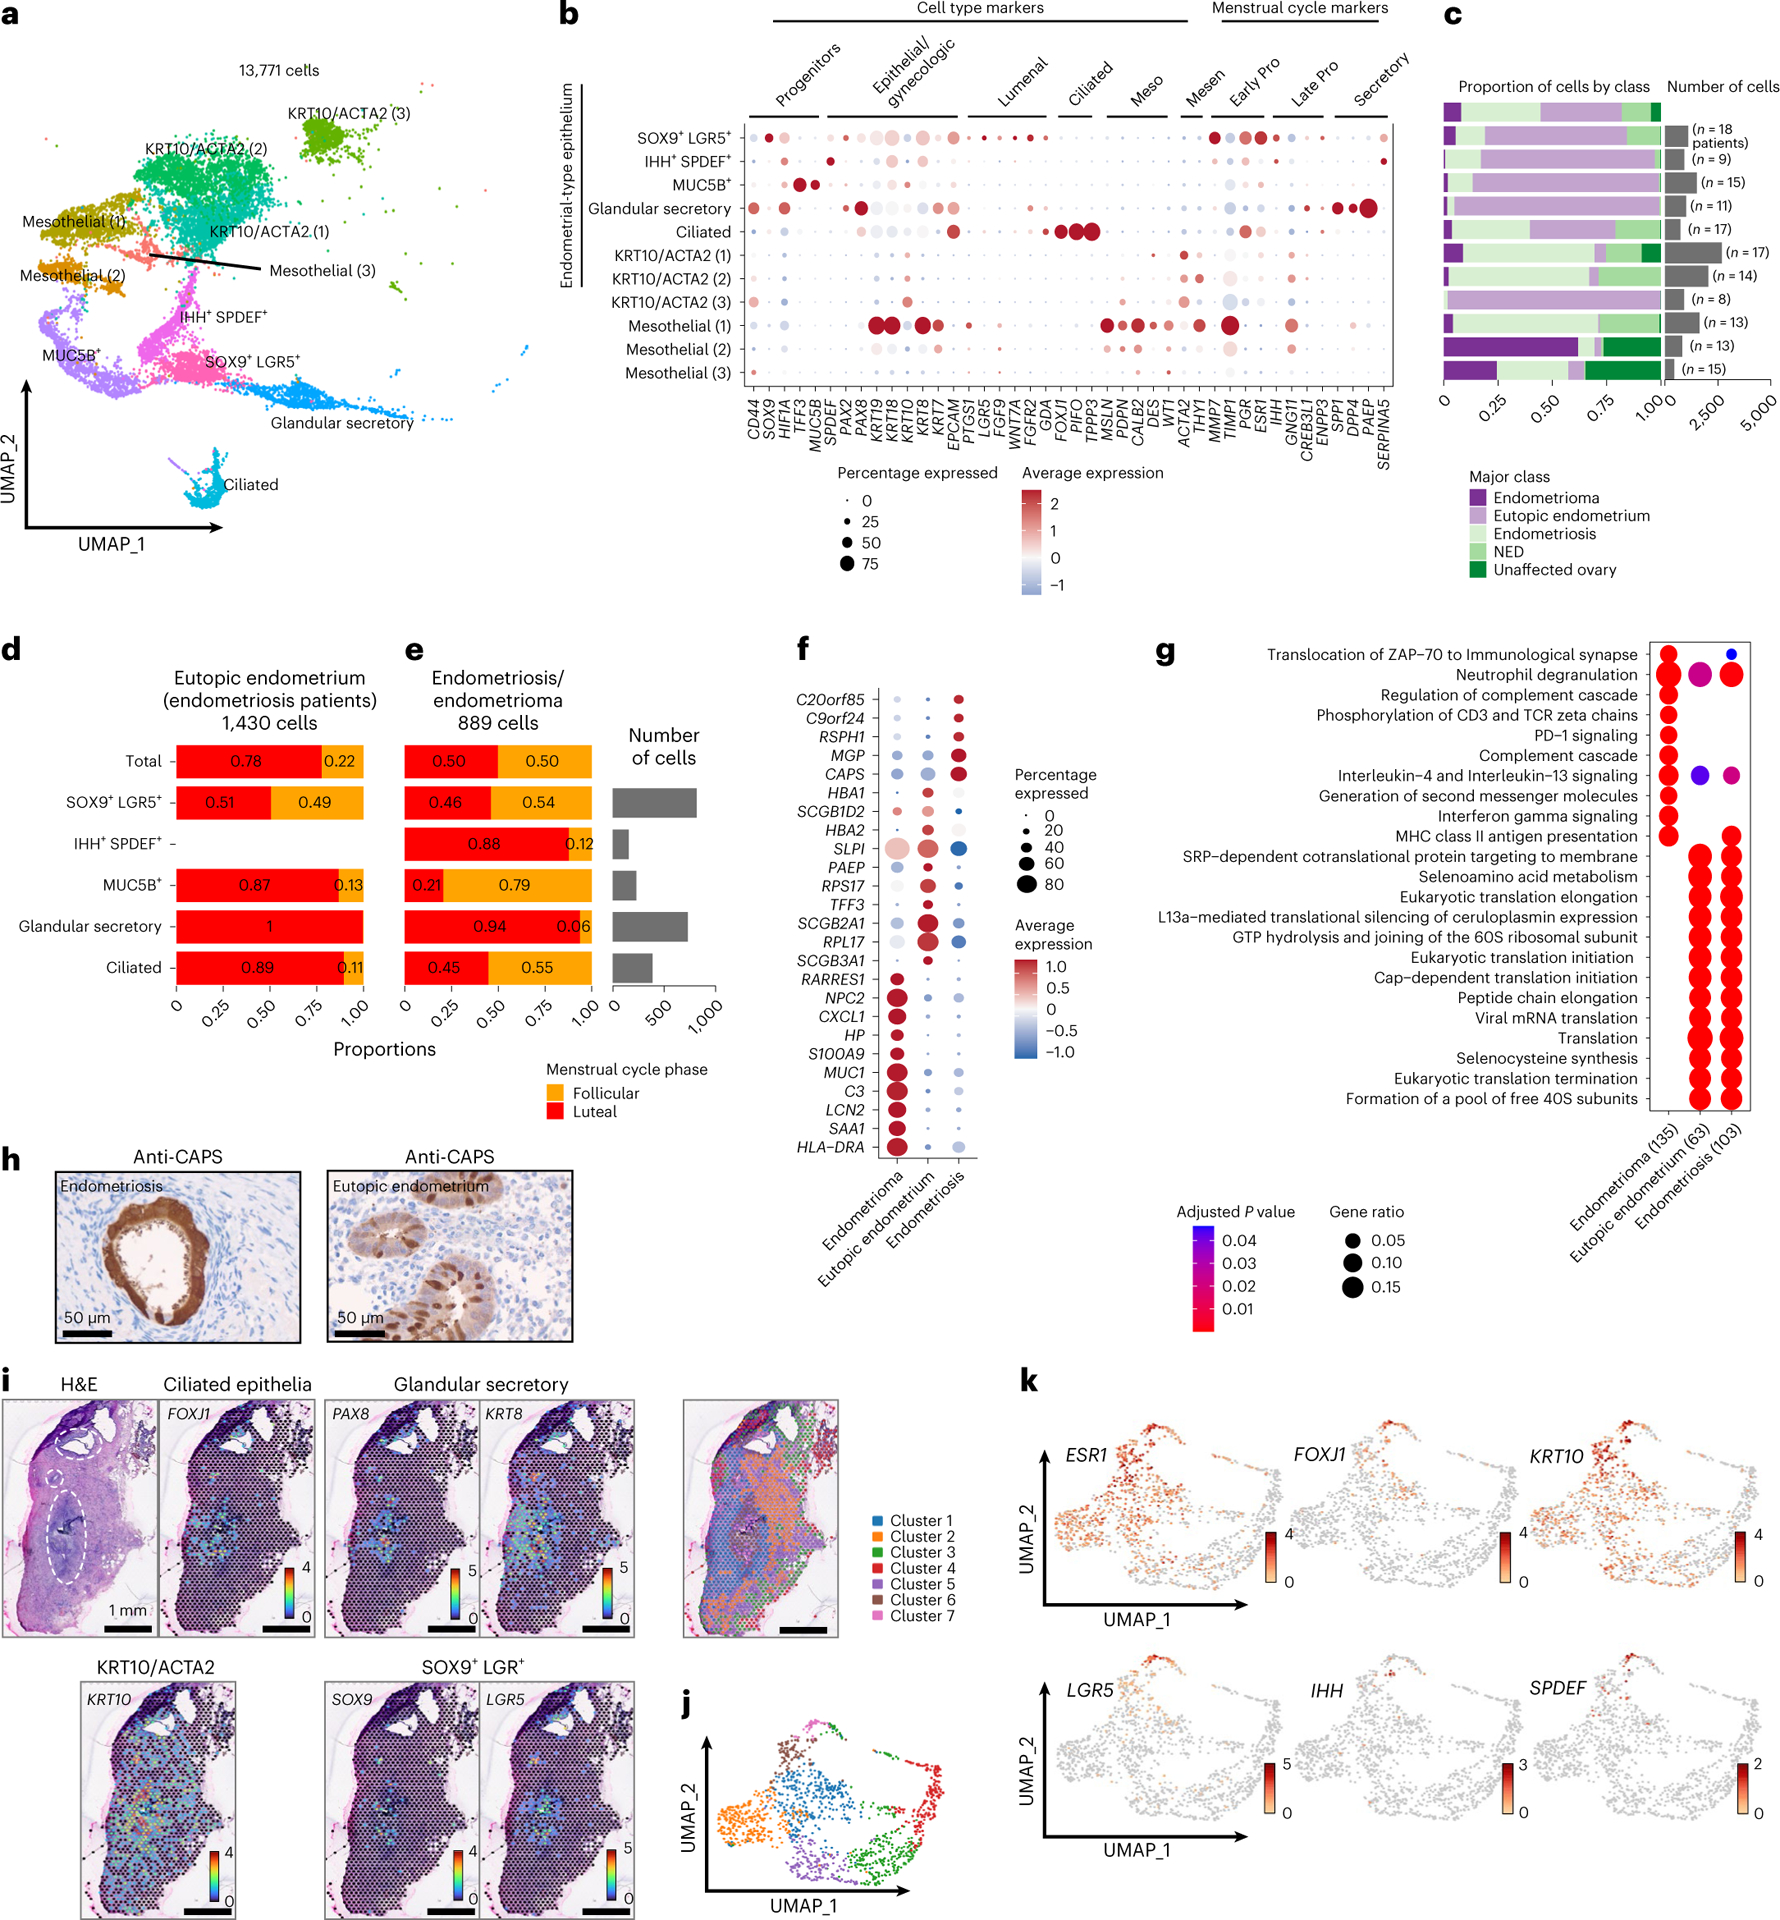
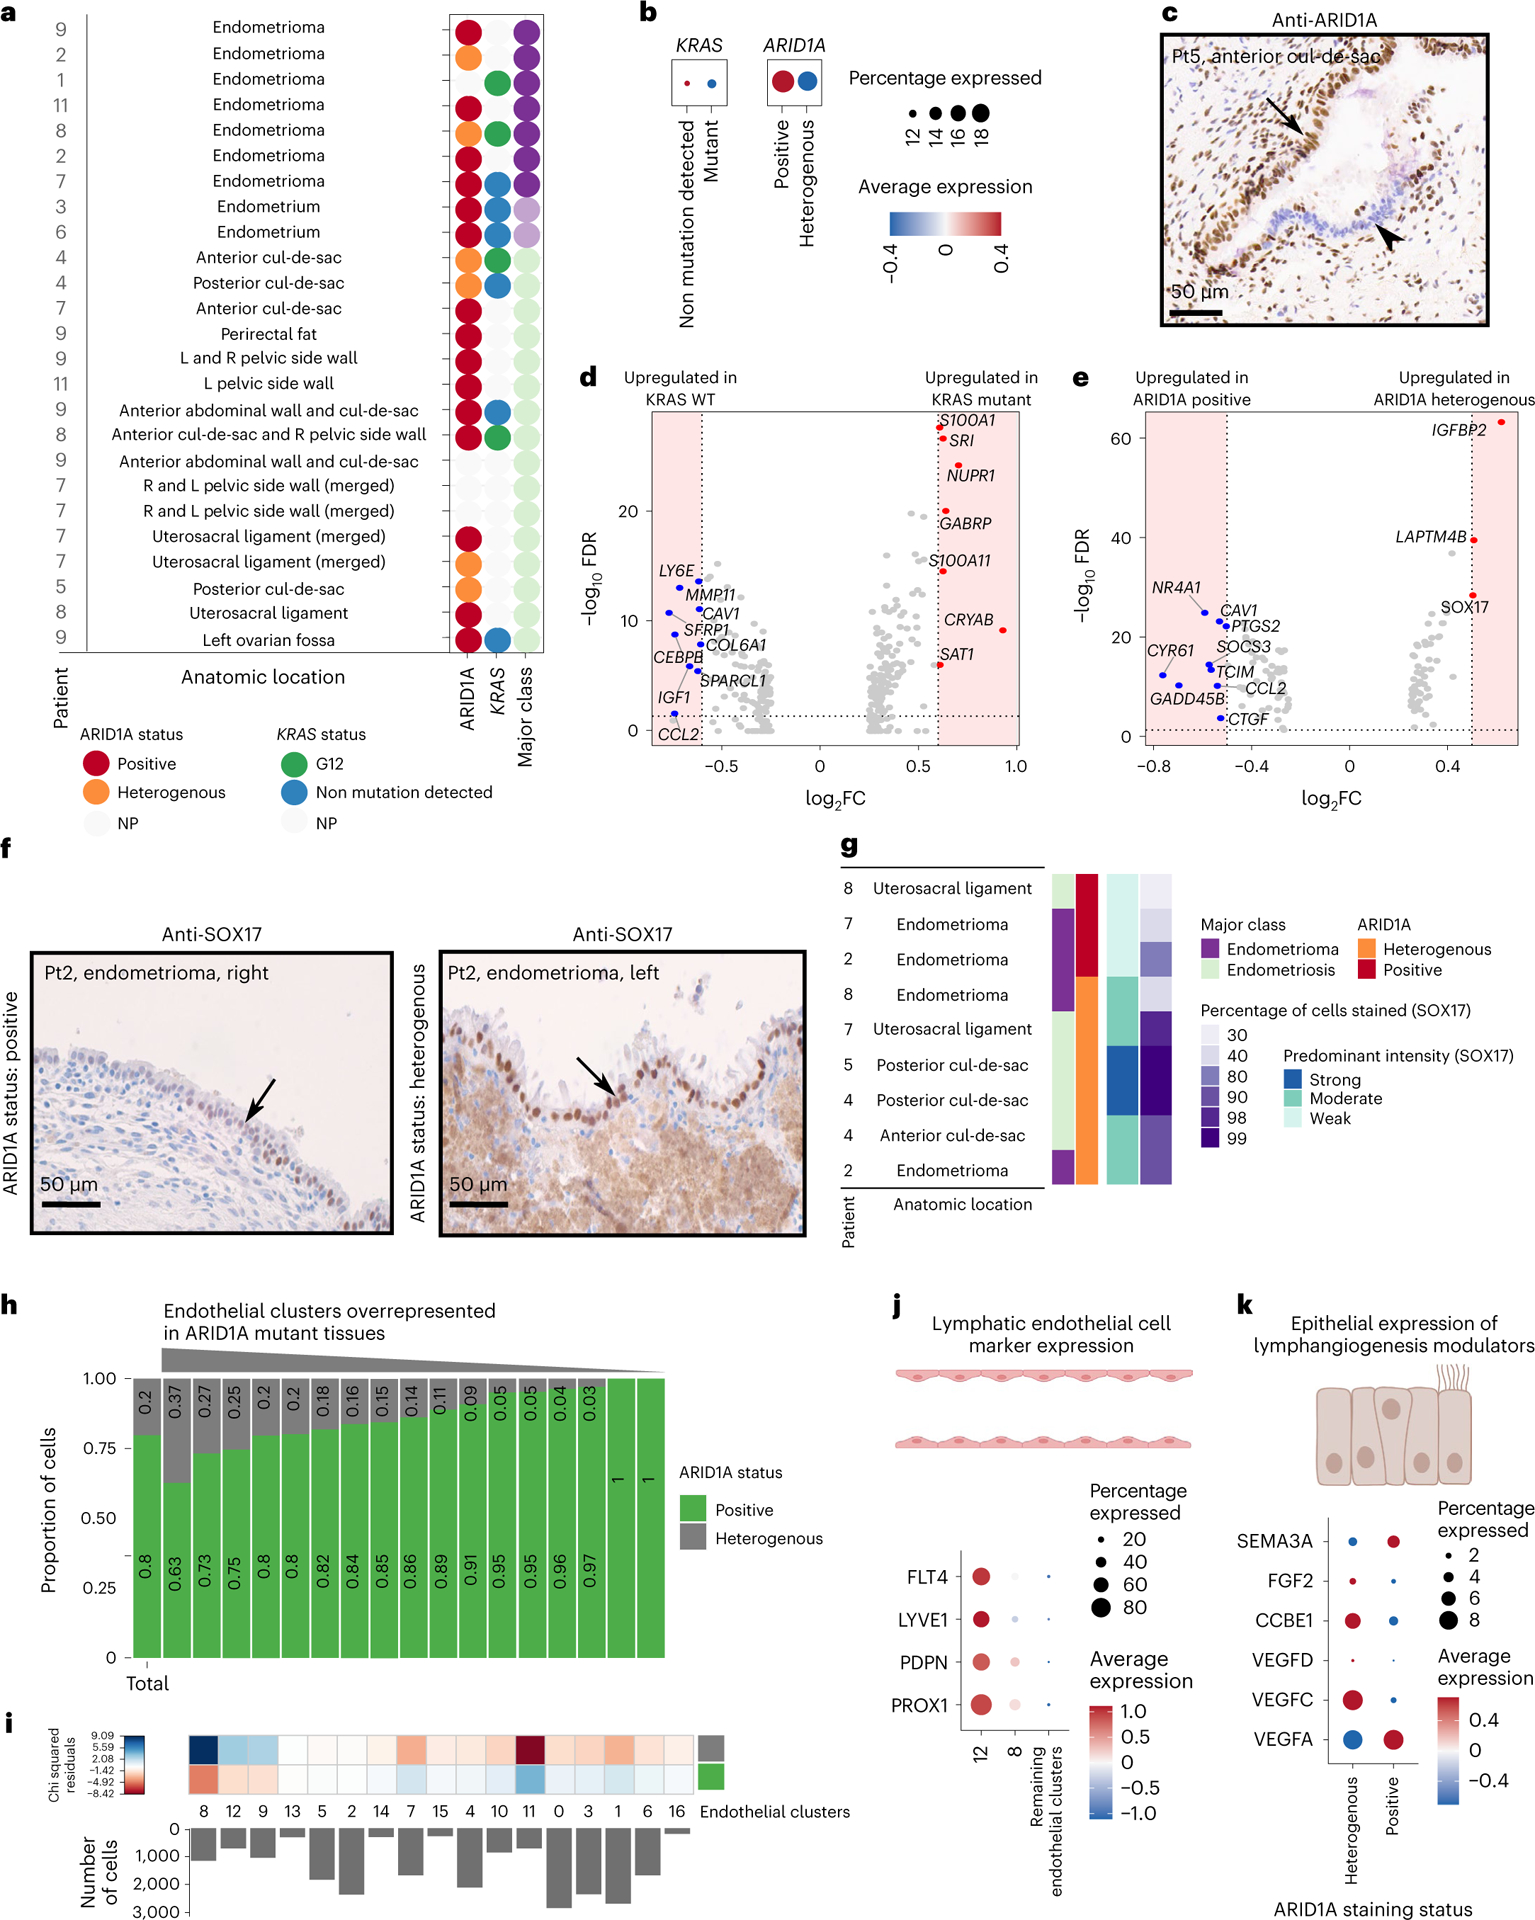
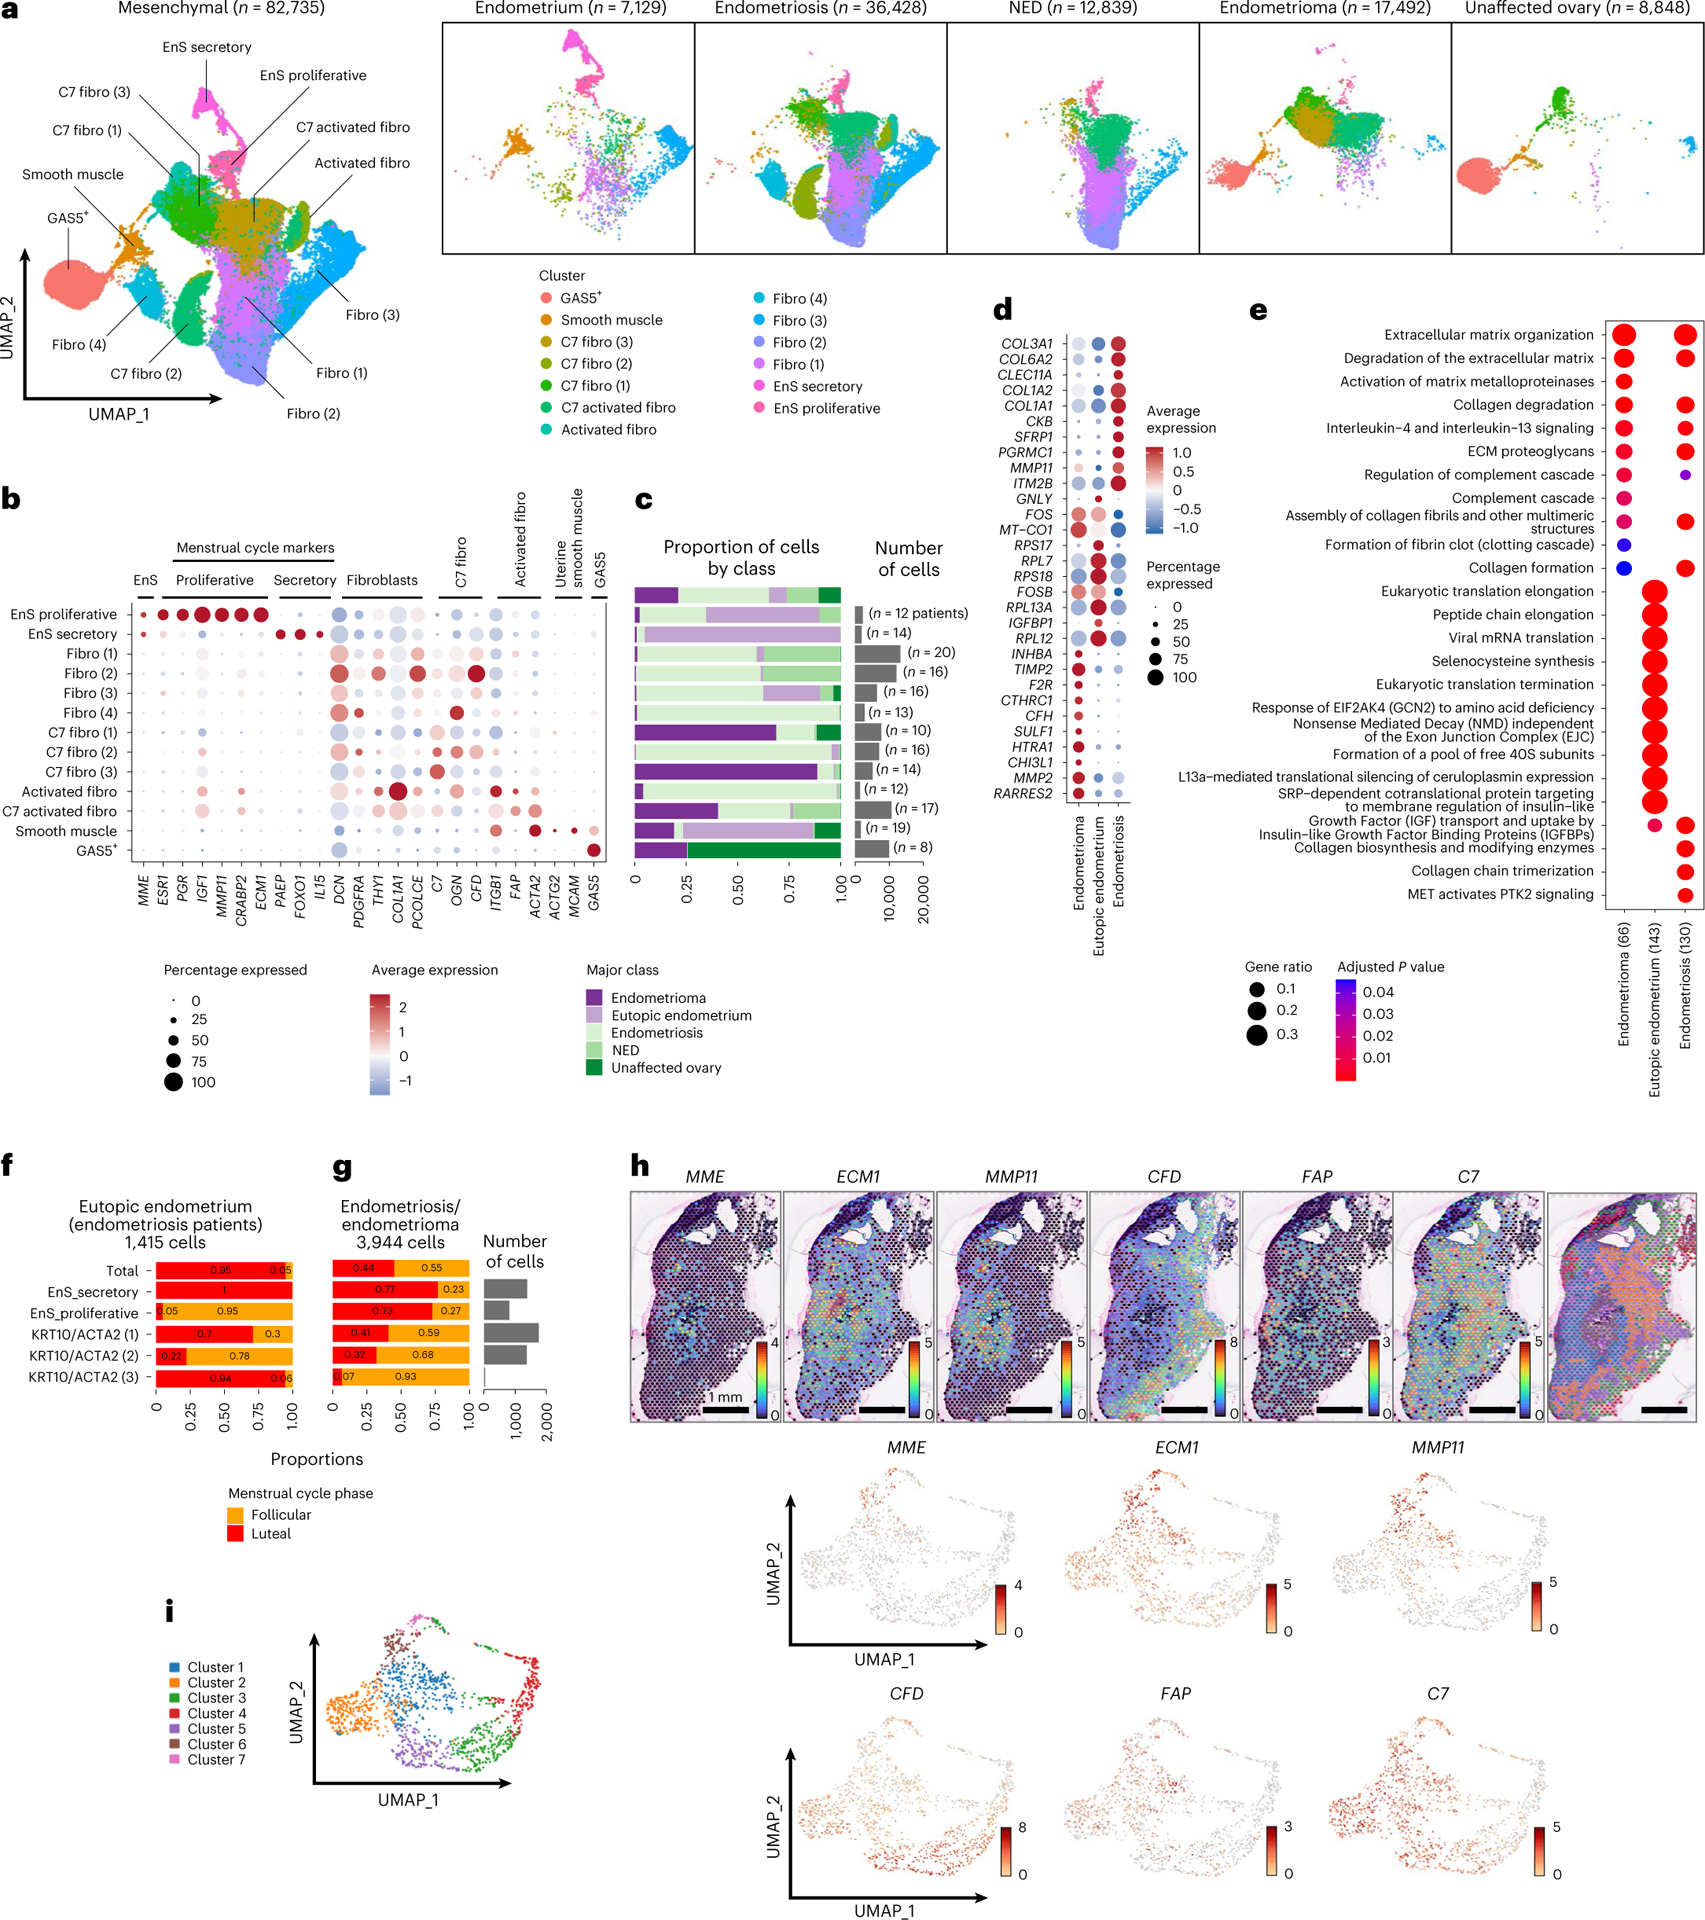
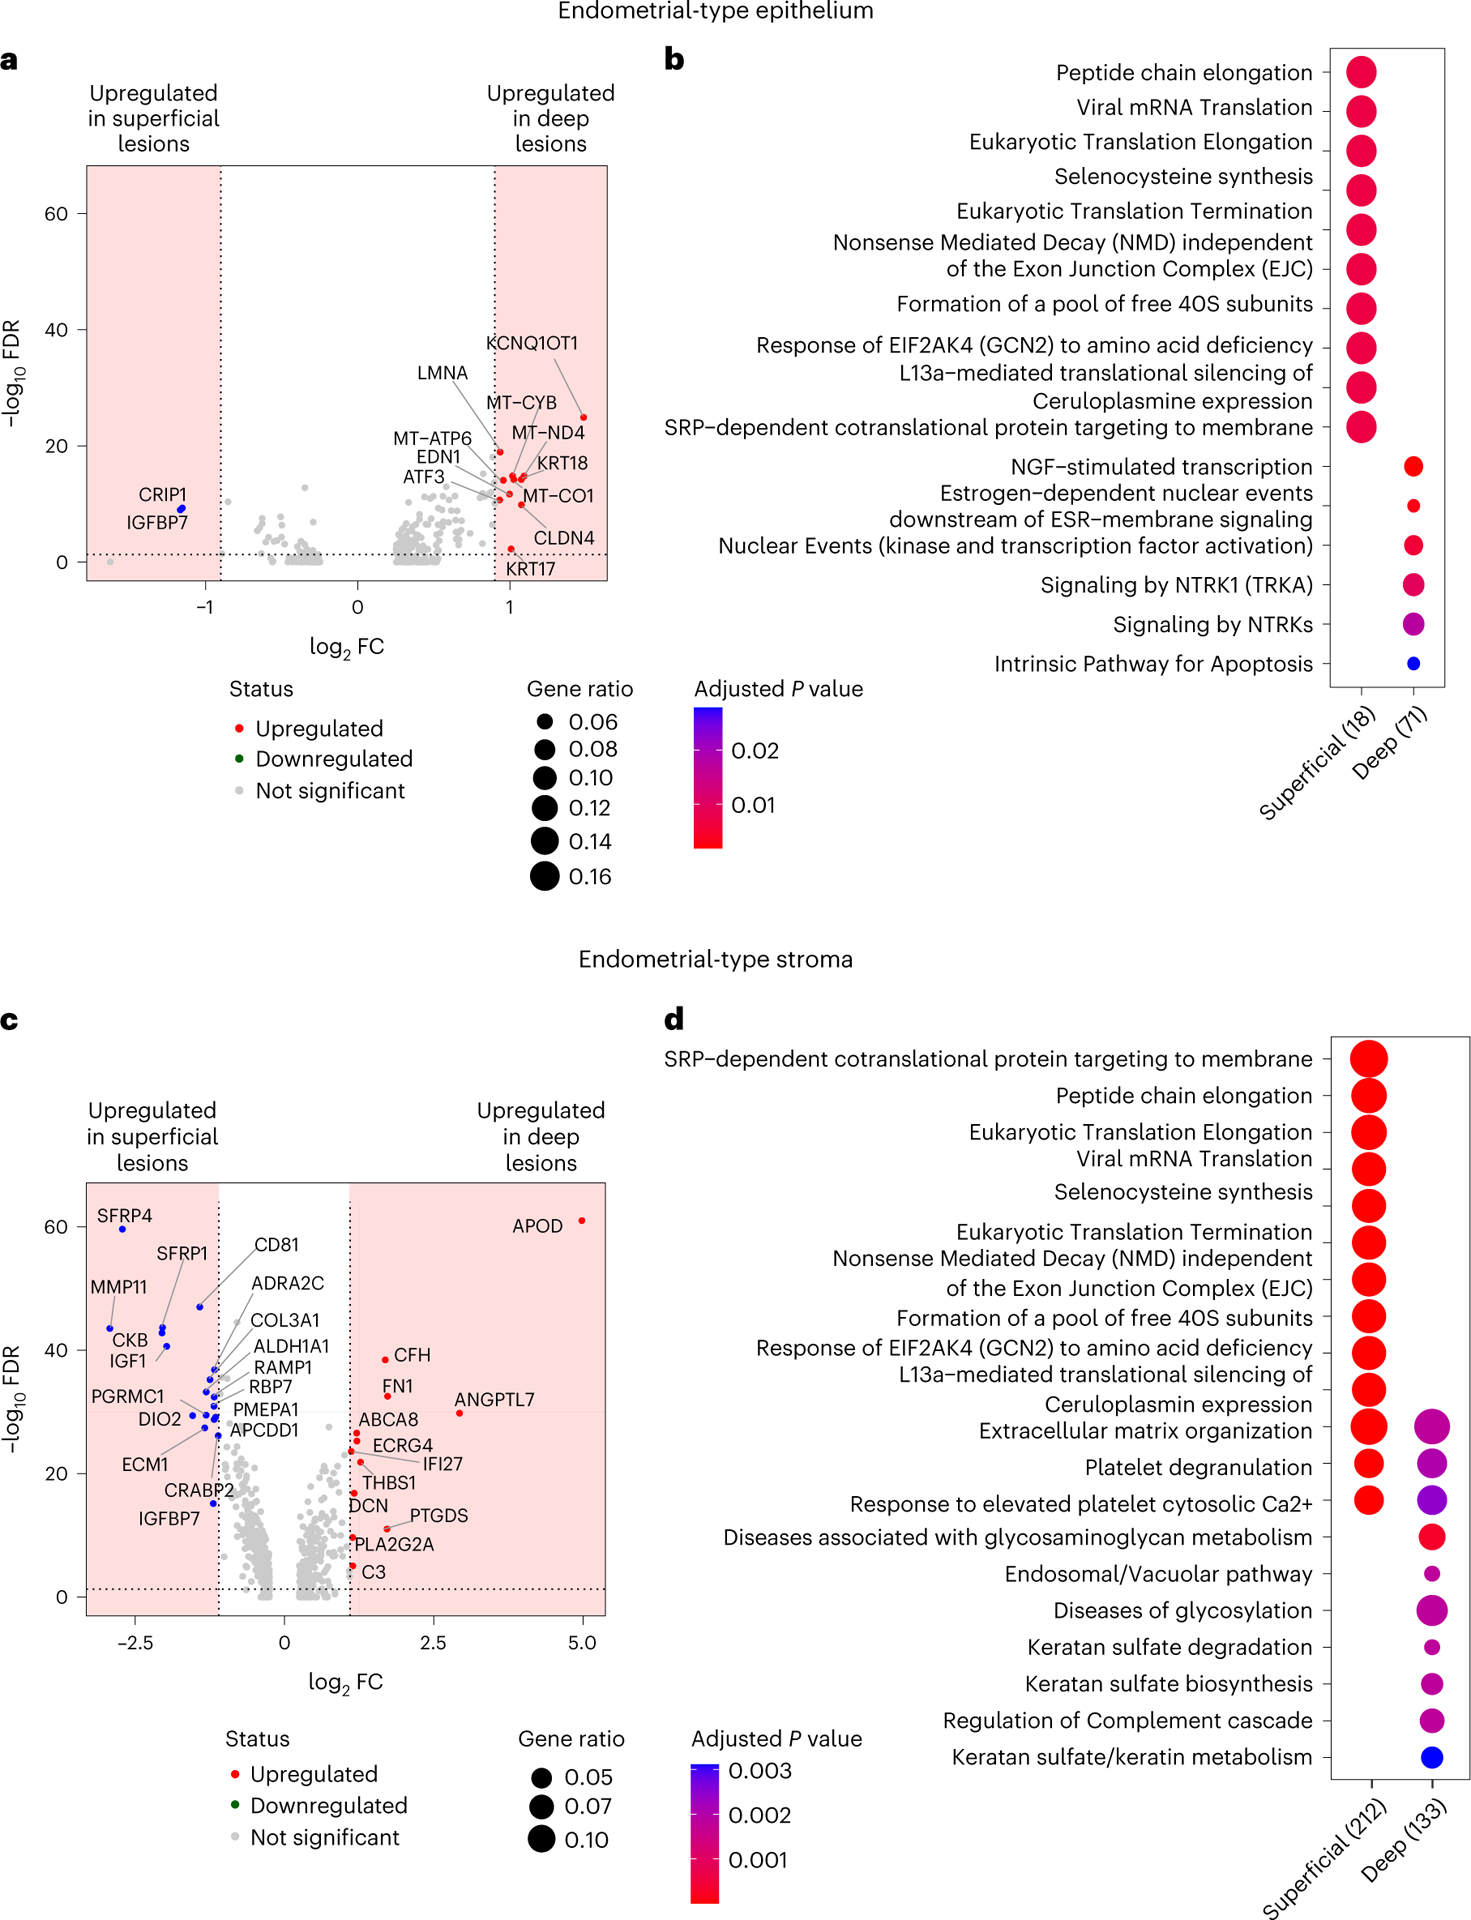
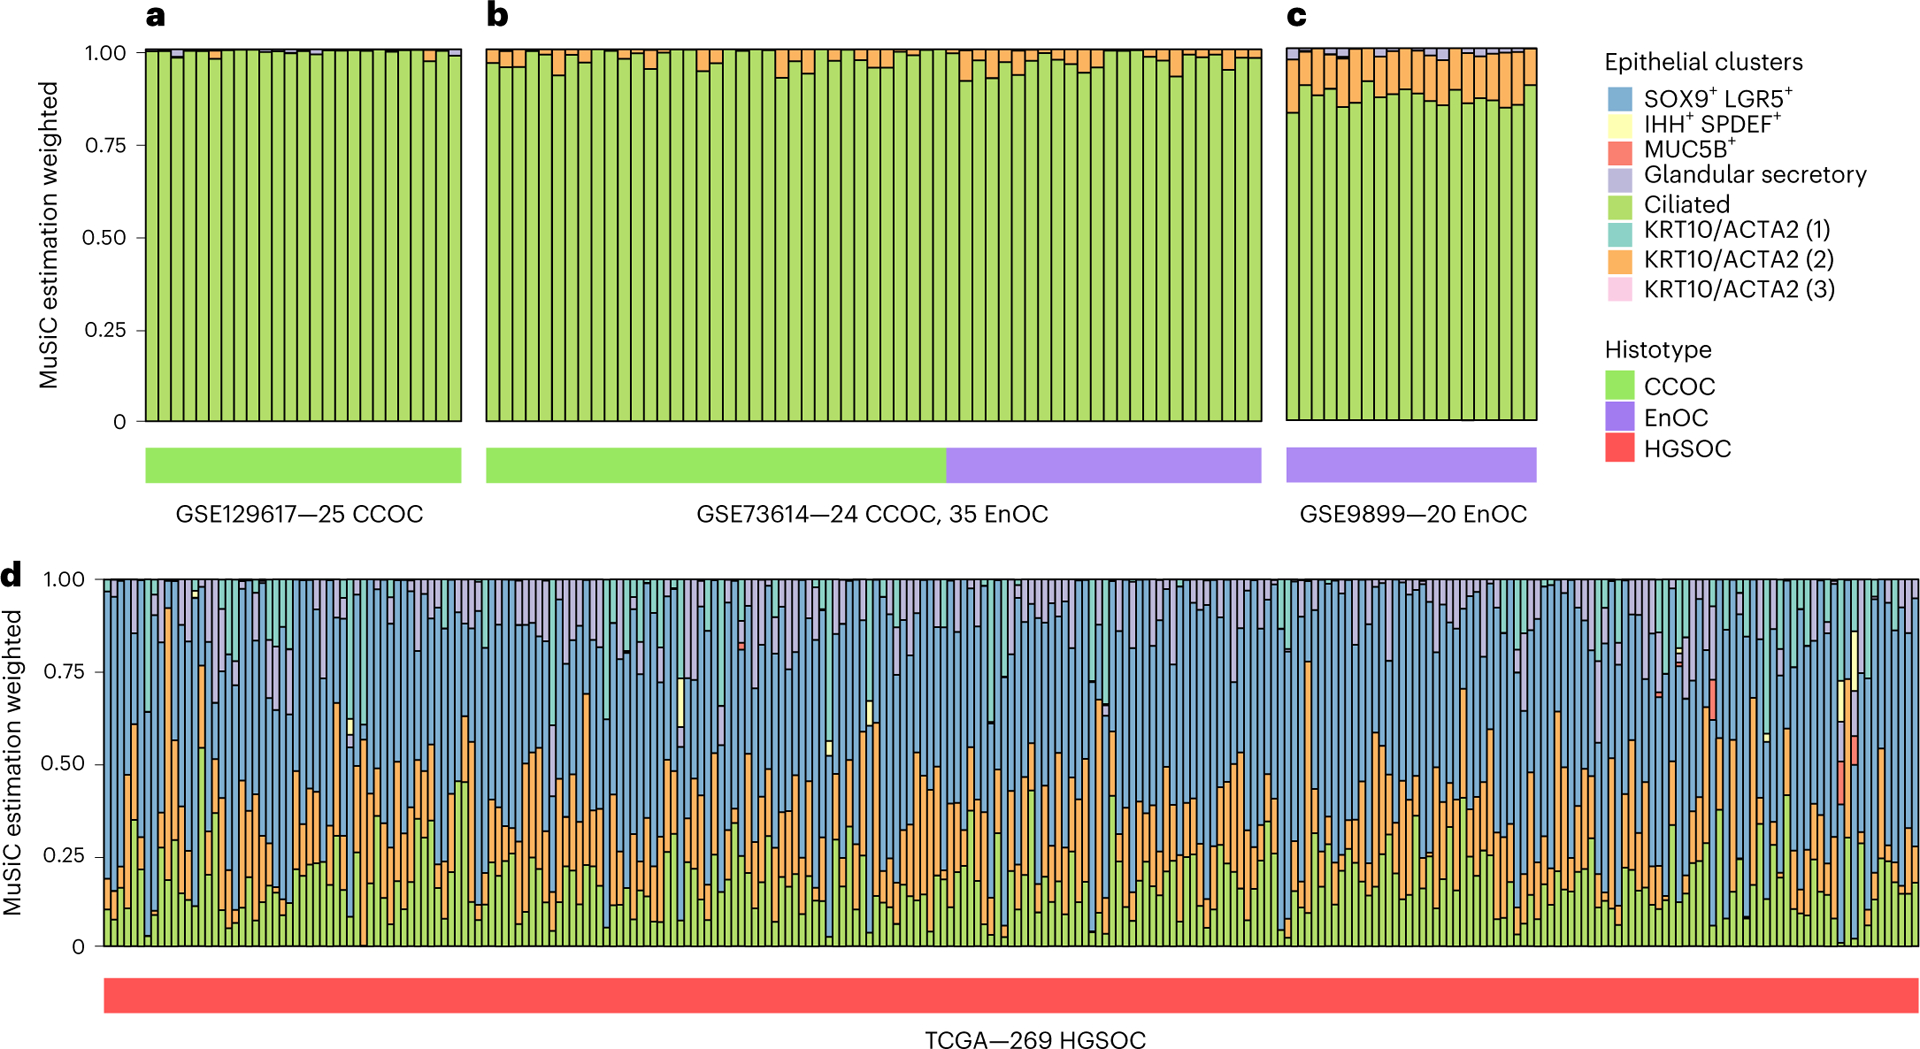
Endometriosis is a common condition in women that causes chronic pain and infertility and is associated with an elevated risk of ovarian cancer. We profiled transcriptomes of >370,000 individual cells from endometriomas (n = 8), endometriosis (n = 28), eutopic endometrium (n = 10), unaffected ovary (n = 4) and endometriosis-free peritoneum (n = 4), generating a cellular atlas of endometrial-type epithelial cells, stromal cells and microenvironmental cell populations across tissue sites. Cellular and molecular signatures of endometrial-type epithelium and stroma differed across tissue types, suggesting a role for cellular restructuring and transcriptional reprogramming in the disease. Epithelium, stroma and proximal mesothelial cells of endometriomas showed dysregulation of pro-inflammatory pathways and upregulation of complement proteins. Somatic ARID1A mutation in epithelial cells was associated with upregulation of pro-angiogenic and pro-lymphangiogenic factors and remodeling of the endothelial cell compartment, with enrichment of lymphatic endothelial cells. Finally, signatures of ciliated epithelial cells were enriched in ovarian cancers, reinforcing epidemiologic associations between these two diseases.


Conflict of interest statement

Competing interests

The authors declare no competing interests.

Figures

Extended Data Fig. 1 |
Quality control metrics and cell annotation procedures. (a) The number of genes detected per cell is not significantly different across the major classes of study, nor by fresh/frozen status. (b) Observed cell number is positively correlated with observed cell number (Pearson correlation and Analysis of Variance). (c) The number of cells passing QC filters and (d) the number of reads per cell is not significantly different across the major classes of study, nor by fresh/frozen status. Coral color denotes samples that were processed immediately - ‘Fresh’; teal denotes samples that were processed into single cells and viably cryopreserved and thawed before capture - ‘Frozen’. Number of samples in (a, b and d) – endometrioma, fresh = 6, frozen = 2; endometriosis, fresh = 12, frozen = 11; eutopic endometrium, fresh = 2, frozen = 8; no endometriosis detected, fresh = 2, frozen = 2; unaffected ovary, fresh = 1, frozen = 3. (e) Decision tree showing workflow for cell type assignment. Black boxes indicate action/processes, blue boxes indicate cell-type assignment endpoints. (f) Heatmap showing expression of cell-type specific markers, by cluster. Expression is scaled between 0–1. Possible cell type assignments are indicated by column labels with the number of cell-type specific genes for each cell type indicated in brackets. For a list of marker genes see Methods and panel (g). (g) Expression of cell-type specific markers across the 96 clusters. (h) UMAP plot with 114 clusters (using Seurat shared nearest neighbor (SNN) for cluster identification considering resolution parameter of 3). (i) Correlation values for pair-wise comparisons of the 6 unassigned clusters compared to a background distribution of correlation values for 100 pairs of clusters selected at random, red dots indicate the correlation value used for cell type assignment. ( j) Pearson’s correlation between clusters, based on expression of a union set of 1,960 genes differentially expressed by one or more cluster (log2 FC > 0; p <0.05). Clusters with no cell markers were assigned the identity associated with the most correlated cell type with known identity (see Methods). (k) Correlation of gene expression across major cell types, comparing fresh and cryopreserved specimens. Correlation values shown above each plot, Pearson’s correlation. (l) Principal component analysis based on cell-type composition of endometriosis and control tissues. In the box and whisker plots shown in (a,c,d,i), boxes denote the interquartile range, bar denotes median. The limits of the whiskers represent 1.5 * IQR (interquartile range) and outlier values are indicated with individual dots. Red dots denote the correlation value for expression in the given cluster compared to the cluster used to assign identity.
Extended Data Fig. 2 |
Extended Data Fig. 2 |. Additional results, analysis of epithelial subgroups by ARID1A and KRAS mutation status.
(a) Cluster frequency for eutopic endometrial epithelial clusters with inclusion of patients taking exogenous hormones. (b) Visium analysis of an endometriosis lesion from patient BEME355. (c) ARID1A and KRAS expression across epithelial subtypes. (d) Clusters present in BEME355 and expression of key genes. (e) UMAP of endometrial-type epithelial cells by ARID1A protein expression status, (f) UMAP of cells by KRAS mutation status. UMAP structure from 3A. (g) Pathways enriched in lesions with endometrial-type epithelium exhibiting heterogeneous and homogenous positive staining for ARID1A. (h) Pathways enriched in KRAS mutant and wildtype endometrial-type epithelium. Pathway analyses were performed using the Reactome R package, with p-values calculated based on a hypergeometric model and a Bonferroni correction applied.
Fig. 1 |
Fig. 1 |. A cellular atlas of human endometriosis.
a, Patient cohort and specimens profiled. Only samples that passed quality control after single-cell profiling are shown (Supplementary Table 4). b, Histologic and macroscopic features of specimens from patient 9. Uterus graphic from BioRender.com. L, left; R, right.
Fig. 2 |
Fig. 2 |. The cellular landscapes of endometrioma, peritoneal endometriosis, unaffected peritoneum, eutopic endometrium and unaffected ovary.
a, UMAP visualization of all sequenced cells (after filtering for quality) from 49 samples representing five major tissue-type classes. b, Major cell types identified, UMAP representation. c, Three-dimensional UMAP representation. d, Expression of representative markers across nine major cell types. e, Representation of each major class within each major cell-type group, contribution of each patient to each group, frequencies of each cell type and number of genes detected in each cell type. ‘Total’ column represents the proportion of each patient or class in the major cell type overall, under the null hypothesis of no enrichment of any tissue class. The color key for tissue class is shared across a, e, g and h. Box and whisker plots, boxes denote the interquartile range, bar denotes median number of genes detected per cell. The limits of the whiskers represent 1.5 × IQR (interquartile range) and outlier cells are indicated with individual dots. f, Fold enrichment and depletion of each cell type across the five classes. g, Principal component analysis. h, Correlation, based on cluster frequencies, across all specimens profiled by scRNA-seq (Pearson correlation, no threshold for significance applied). Agglomeration method ‘ward.D2’ and ‘canberra’ distance were used as clustering parameters. NED, no endometriosis detected; NK, natural killer; NKT, natural killer T-cells.
Fig. 3 |
Fig. 3 |. Keratin-positive components of eutopic endometrium, endometriomas and endometriosis.
a, UMAP of all keratin-positive cells. b, Marker gene expression. Meso, mesothelial cell markers; Mesen, mesenchymal markers. c, Frequency of each cluster by class; the total column represents the distribution of each class in the entire epithelial compartment. Absolute number of cells per cluster and number of patients contributing to each cluster are indicated on the histogram. Proliferative, XXX. d,e, Proportional bar plot of endometrial-type epithelial clusters in eutopic endometrium samples (d) and in endometriosis/endometrioma (e) in the follicular or luteal phase of the menstrual cycle. f, Differential gene expression in endometrial-type epithelium (the first five rows in panel b) in the context of endometrioma, eutopic endometrium or extra-ovarian endometriosis (P < 0.05 and log2 FC > 1). Two-sided differential expression analyses were performed using MAST, with P values adjusted using the Benjamini–Hochberg method. g, Pathway analysis, endometrial-type epithelium in the context of endometrioma, eutopic endometrium or extra-ovarian endometriosis. Pathway analyses were performed using the Reactome R package, with P values calculated based on a hypergeometric model and a Bonferroni correction applied. h, CAPS expression, immunohistochemical staining of eutopic endometrium and endometriosis. i, Spatial transcriptomic analysis of a peritoneal endometriosis lesion (BEME346) showing spatial distribution of cluster-specific genes. Each spot represents 1–10 cells. Three foci of endometriosis are indicated by white dashed circles on the image of the H&E-stained slide. j, k-means clustering identified seven clusters based on gene expression. k, Feature UMAPs for epithelial cluster-specific genes.
Fig. 4 |
Fig. 4 |. Gene expression signatures associated with somatic mutation of ARID1A or KRAS.
a, Summary of ARID1A staining status and KRAS mutations detected in each lesion. NP, not profiled due to insufficient epithelial material available in the specimen. b, Expression of ARID1A and KRAS mRNA by mutation state. c, ARID1A immunostaining in a representative endometriosis lesion with heterogenous staining; positive staining for ARID1A is shown with the black arrow and negative epithelium is shown with the arrowhead. Posterior cul-de-sac lesion from patient 5 is shown. d, Differential gene expression in KRAS mutant versus wild-type endometrial-type epithelium (P < 0.05 and log2 FC = 0.6, dashed line and shaded area). Two-sided differential expression analyses were performed using MAST, with P values adjusted using the Benjamini–Hochberg method. e, Differential gene expression in ARID1A heterogeneously staining versus positive endometrial-type epithelium (P < 0.05 and log2 FC = 0.5, dashed line and shaded area). Two-sided differential expression analyses were performed using MAST, with P values adjusted using the Benjamini–Hochberg method. f, SOX17 staining in ARID1A-positive and ARID1A heterogenous staining endometriomas from patient 2. g, Summary of SOX17 staining by ARID1A staining status. h, Cluster frequencies for endothelial cells in lesions with positive or heterogenous ARID1A staining. Histogram of number of cells in each cluster. One cluster was removed as it contained only 19 cells. i, Chi-squared residuals, tests of differences in cluster frequencies compared with the null distribution (total column). j, Expression of lymphatic endothelial cell markers, contrasted in clusters enriched in ARID1A mutant tissues compared with nonenriched clusters. k, Expression of lymphangiogenic factors in wild-type and ARID1A mutant endometrial-type epithelium. The color keys for tissue class and ARID1A expression status are shared across a and g, h FDR, false-discovery rate; Pt, patient.
Fig. 5 |
Fig. 5 |. Signatures of EnS and mesenchymal cells associated with endometriosis.
a, UMAP of mesenchymal cell types in the entire dataset and across the five major classes of tissue type. b,c, Marker gene expression (b) and cluster frequencies, number of cells per cluster and number of patients contributing to each cluster (c). d, Differential gene expression in EnS in the context of endometrioma, eutopic endometrium or endometriosis (log2 FC ≥ 0.8, P < 0.05). Two-sided differential expression analyses were performed using MAST, with P values adjusted using the Benjamini–Hochberg method. e, Pathway analysis, EnS in the context of endometrioma, eutopic endometrium or endometriosis. Pathway analyses were performed using the Reactome R package, with P values calculated based on a hypergeometric model and a Bonferroni correction applied. f,g, Frequencies of proliferative and secretory EnS during the menstrual cycle in eutopic (f) and ectopic (g) endometrium. h, Spatial transcriptomic analysis, expression of marker genes from mesenchymal subpopulations across a peritoneal specimen containing three foci of endometriosis (see Fig. 3). i, Heterogenous expression of mesenchymal markers across clusters derived from spatial transcriptomic analyses of endometriosis-positive peritoneum. Fibroblast, XXX.
Fig. 6 |
Fig. 6 |. Molecular signatures of deep and superficial peritoneal endometriosis.
a,b, DEGs (log2 FC ≥ 0.9, P < 0.05, dashed line and shaded area) (a) and pathway enrichment (b) in endometrial-type epithelial cells associated with deep or superficial endometriosis. c,d, DEGs (log2 FC ≥ 1.1, P < 0.05, dashed line and shaded area) (c) and pathway enrichment (d) in EnS associated with deep or superficial endometriosis. Two-sided differential expression analyses were performed using MAST, with P values adjusted using the Benjamini–Hochberg method. Pathway analyses were performed using the Reactome R package, with P values calculated based on a hypergeometric model and a Bonferroni correction applied.
Fig. 7 |
Fig. 7 |. Deconvoluting endometriosis-associated ovarian cancers with singlecell endometriosis signatures.
ac, Deconvolution of 25 clear cell ovarian cancers (CCOCs) (24 primary tumor specimens, 1 ascites sample) (a), 24 CCOC and 35 endometrioid ovarian cancer (EnOC) tumors (b) and 14 EnOCs (c) based on signatures of 8 epithelial subclusters. d, Deconvolution of 269 high-grade serous ovarian cancers using the same epithelial subclusters. The color keys for epithelial clusters are shared across all panels. HGSOC, high-grade serous ovarian cancer; TCGA, The Cancer Genome Atlas.

Comment in

References

    1. Sainz de la Cuesta R et al. Histologic transformation of benign endometriosis to early epithelial ovarian cancer. Gynecol. Oncol 60, 238–244 (1996). - PubMed
    1. Lee AW et al. Evidence of a genetic link between endometriosis and ovarian cancer. Fertil. Steril 105, 35–43.e1 (2016). - PMC - PubMed
    1. Pearce CL et al. Association between endometriosis and risk of histological subtypes of ovarian cancer: a pooled analysis of case-control studies. Lancet Oncol. 13, 385–394 (2012). - PMC - PubMed
    1. Lu Y et al. Shared genetics underlying epidemiological association between endometriosis and ovarian cancer. Hum. Mol. Genet 24, 5955–5964 (2015). - PMC - PubMed
    1. Korsunsky I et al. Fast, sensitive and accurate integration of single-cell data with Harmony. Nat. Methods 16, 1289–1296 (2019). - PMC - PubMed

Publication types