. 2023 Jan;55(1):26-33.
doi: 10.1038/s41588-022-01267-w. Epub 2023 Jan 9.

SARS-CoV-2 diagnostic testing rates determine the sensitivity of genomic surveillance programs

Affiliations

SARS-CoV-2 diagnostic testing rates determine the sensitivity of genomic surveillance programs

Alvin X Han et al. Nat Genet. 2023 Jan.

Abstract

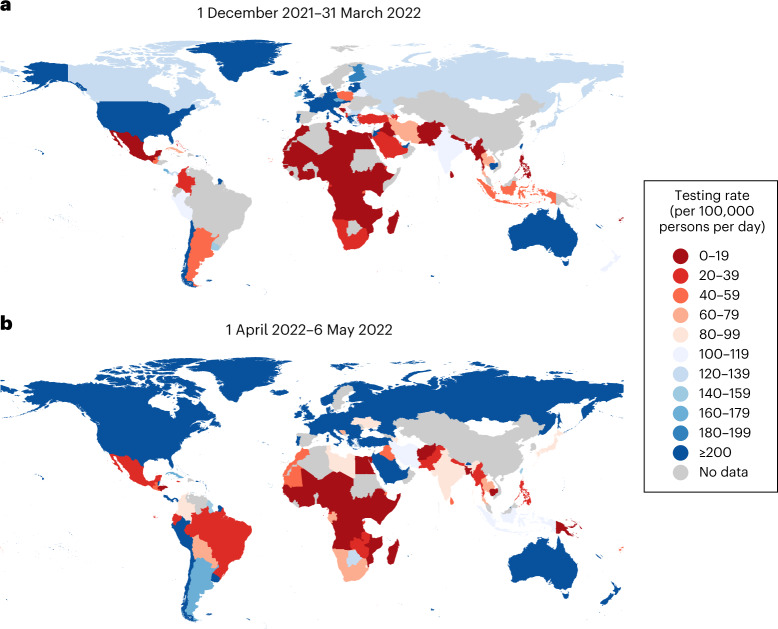
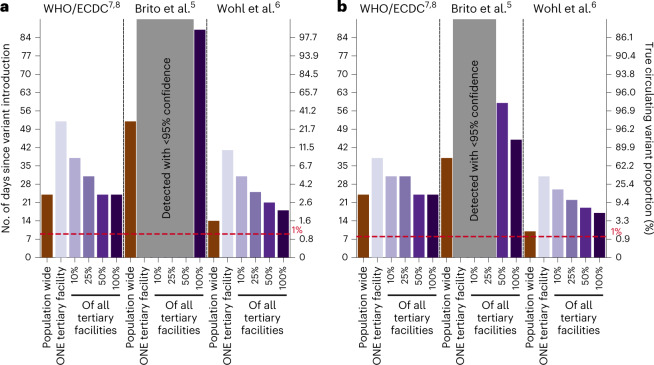
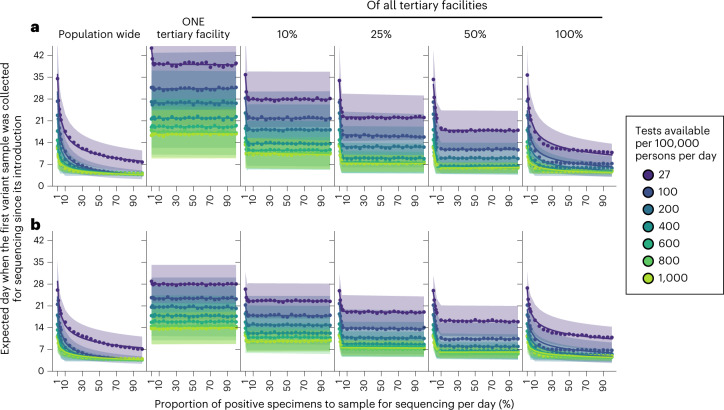
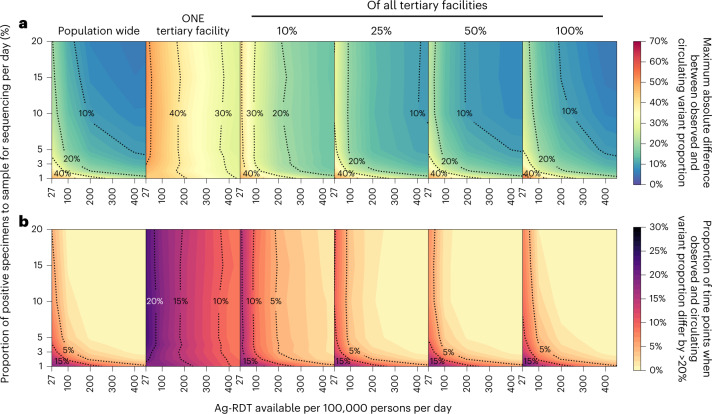
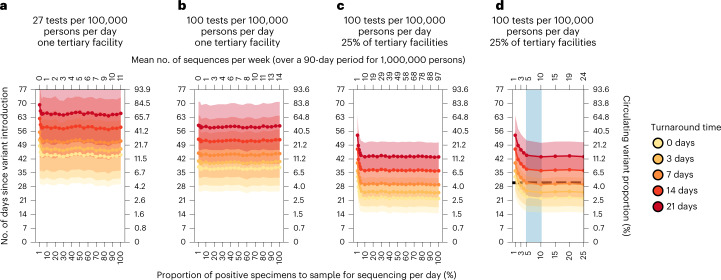
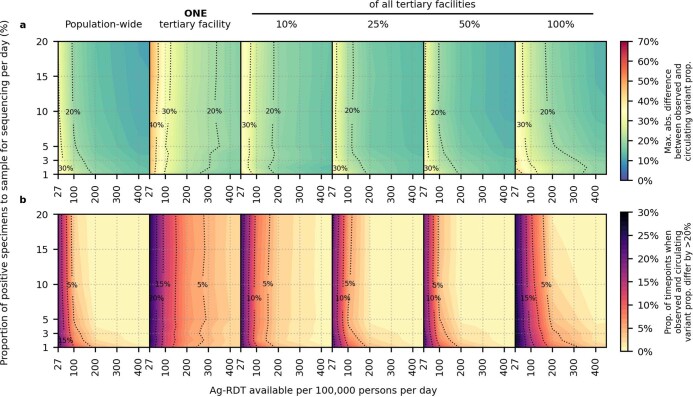
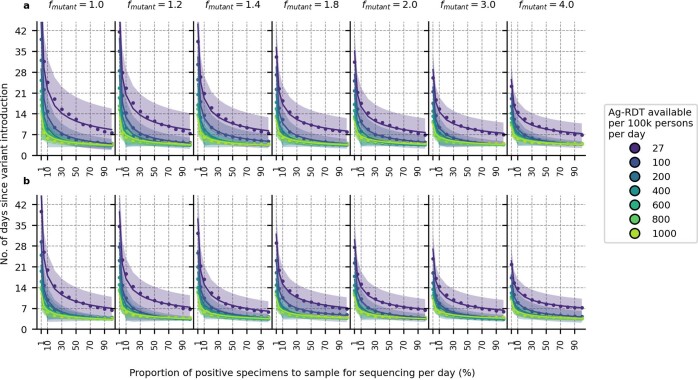
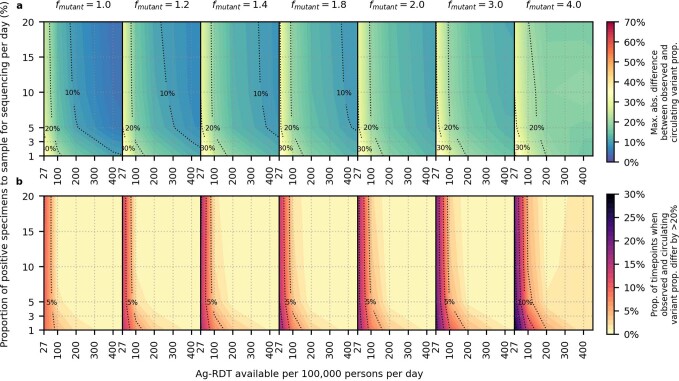
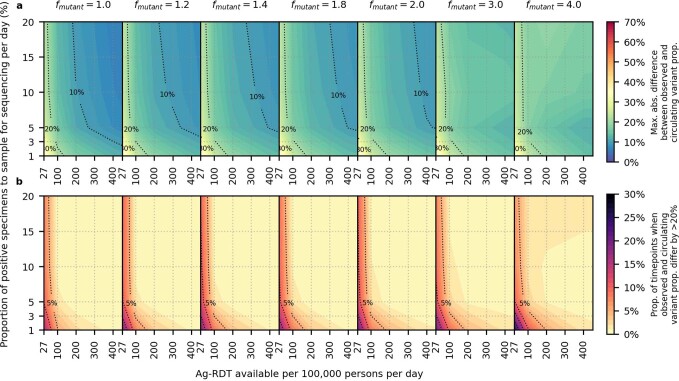
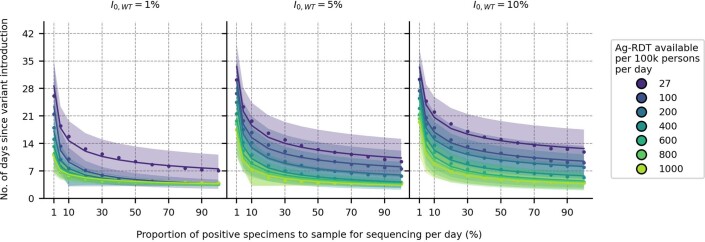
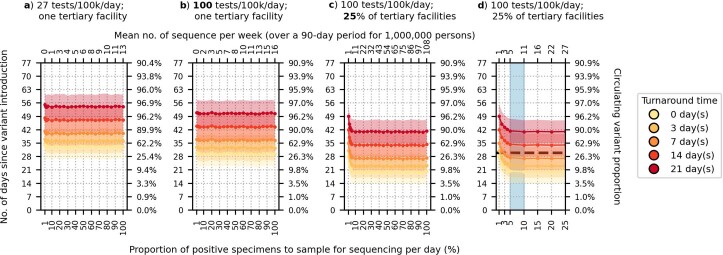
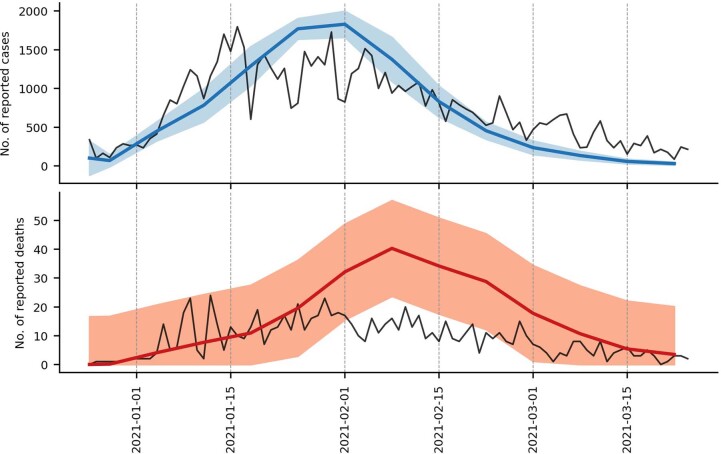
The first step in SARS-CoV-2 genomic surveillance is testing to identify people who are infected. However, global testing rates are falling as we emerge from the acute health emergency and remain low in many low- and middle-income countries (mean = 27 tests per 100,000 people per day). We simulated COVID-19 epidemics in a prototypical low- and middle-income country to investigate how testing rates, sampling strategies and sequencing proportions jointly impact surveillance outcomes, and showed that low testing rates and spatiotemporal biases delay time to detection of new variants by weeks to months and can lead to unreliable estimates of variant prevalence, even when the proportion of samples sequenced is increased. Accordingly, investments in wider access to diagnostics to support testing rates of approximately 100 tests per 100,000 people per day could enable more timely detection of new variants and reliable estimates of variant prevalence. The performance of global SARS-CoV-2 genomic surveillance programs is fundamentally limited by access to diagnostic testing.


Conflict of interest statement

A.T., E.H., S.C., B.R. and B.E.N. declare that they are employed by FIND, the global alliance for diagnostics. All remaining authors declare no competing interests.

Figures

Fig. 1
Fig. 1. Global disparities in SARS-CoV-2 testing rates.
a,b, The color of each country represents the average total number of SARS-CoV-2 tests performed per 100,000 persons per day between 1 December 2021 and 31 March 2022 when the Omicron VOC spread around the world (a), and between 1 April 2022 and 6 May 2022 when most countries were past peak Omicron wave of infections (b). Raster map from naturalearthdata.com.
Fig. 2
Fig. 2. Performance of current guidance on number of positive specimens to sequence for variant detection with testing rate at 27 tests per 100,000 persons per day.
First day of detection since variant introduction at 95% confidence and the corresponding circulating variant proportion using guidance from the World Health Organization (WHO)/European Centre for Disease Prevention and Control (ECDC),, Brito et al. and Wohl et al. (Table 1) under different genomic surveillance strategies with varying sampling coverage (that is, all collected specimens from all healthcare facilities are sent to one facility to be sampled for sequencing (population-wide strategy); or only one tertiary facility or 10, 25, 50 or 100% of tertiary sentinel facilities would sample the specimens they collected for sequencing). Turnaround time (that is, time from specimen collection to acquisition of sequencing data) was assumed to be negligible. We performed 1,000 random independent simulations for each guidance/surveillance strategy. a,b, We simulated epidemics for wild-type SARS-CoV-2/Alpha (a) and Delta/Omicron (b). Gray regions denote that we could not reliably detect the variant virus with 95% confidence using the guidance in question under the assumed genomic surveillance strategy.
Fig. 3
Fig. 3. Impact of SARS-CoV-2 testing rates and proportion of positive specimens to sequence on variant detection.
For each mean daily test availability (differently colored), the expected day (points and line) and the s.d. (shaded region) when the first variant specimen to be sequenced is sampled since its introduction is plotted against the proportion of positive specimens to be sampled for sequencing daily. Different genomic surveillance strategies with varying sampling coverage (that is, all specimens collected from all healthcare facilities sent to one facility to be sampled for sequencing (population-wide strategy); or only one tertiary facility, or 10, 25, 50 or 100% of tertiary sentinel facilities would sample the specimens they collected for sequencing) were simulated. a, Wild-type SARS-CoV-2/Alpha. b, Delta/Omicron. The plotted results were computed from 1,000 random independent simulations for each surveillance strategy.
Fig. 4
Fig. 4. Impact of SARS-CoV-2 testing rates on the capacity to monitor changes in variant prevalence based on diagnostic test availability and proportion of test-positive samples sequenced.
Different genomic surveillance strategies (that is, all specimens collected from all healthcare facilities sent to one facility to be sampled for sequencing (population-wide strategy); or only one tertiary facility or 10, 25, 50 or 100% of tertiary sentinel facilities would sample the specimens they collected for sequencing) were simulated. a, Maximum absolute difference between observed and circulating variant proportions. b, Proportion of time points when sequencing was performed that the absolute difference between observed and circulating variant proportions is greater than 20%. All results were computed from 1,000 random independent simulations for each surveillance strategy.
Fig. 5
Fig. 5. Recommended approach to enhance genomic surveillance robustness.
In each plot, the operating curves of the expected day when the first Alpha variant sequence is generated are plotted for different proportions of specimens to sample for sequencing per day and turnaround times. We assumed that the Alpha variant was circulating at 1% initially, with wild-type SARS-CoV-2 in the background. We also assumed that positive specimens sampled within each week for sequencing are consolidated into a batch before they are referred for sequencing. Turnaround time refers to the time between collection of each weekly consolidated batch of positive specimens to the acquisition of its corresponding sequencing data. The vertical axes denote the number of days passed since the introduction of the Alpha variant (left) and its corresponding circulating proportion (right). The horizontal axes denote the proportion of positive specimens to sample for sequencing per day (bottom) and the corresponding mean number of sequences to be generated per week per 1,000,000 people over a 90-day epidemic period. a, Specimen pools for sequencing from one tertiary sentinel facility with testing rate at 27 tests per 100,000 persons per day. b, Specimen pools for sequencing from one tertiary sentinel facility with testing rate at 100 tests per 100,000 persons per day. c, Specimen pools for sequencing from 25% of all tertiary sentinel facilities with testing rate at 100 tests per 100,000 per day. d, Zoomed-in plot of c to highlight sequencing proportions varying between 1 and 25%. Sequencing 5–10% of positive specimens (blue shaded region) would ensure that we would expectedly detect Alpha in 30 days (horizontal dashed line) if turnaround time is kept within 1 week. All results were computed from 1,000 random independent simulations for each surveillance strategy. The shaded region depicts the s.d. across simulations.
Extended Data Fig. 1
Extended Data Fig. 1. Impact of SARS-CoV-2 Ag-RDT testing rates and daily proportion of positive specimens to sample for sequencing on observed Omicron variant proportions.
Different genomic surveillance strategies (that is all specimens collected from all healthcare facilities sent to one facility to be sampled for sequencing (population-wide strategy); only one, 10%, 25%, 50% or 100% of all tertiary facilities acting as sentinel sites that would sample the specimens they collected for sequencing) were simulated. (A) Maximum absolute difference between observed and circulating variant proportions. (B) Proportion of timepoints when sequencing was performed that the absolute difference between observed and circulating variant proportions is greater than 20%. All results were computed from 1,000 random independent simulations for each surveillance strategy.
Extended Data Fig. 2
Extended Data Fig. 2. Sensitivity analyses on variant detection operating curve for different relative transmissibility factor.
For each Ag-RDT availability (differently colored), the expected day (points and line) and the standard deviation (shaded region) when the first Omicron variant specimen (in the background of extant Delta variant) is sampled for sequencing since its introduction is plotted against the proportion of positive specimens to be sampled for sequencing daily. All specimens collected from the population from all healthcare facilities were sent to one facility to be sampled for sequencing (population-wide genomic surveillance strategy). Different transmissibility factor of Omicron relative to Delta (fmutant) were assumed. (A) 10% and (B) 40% of the population had immunity against Omicron initially. The plotted results were computed from 1,000 random independent simulations for each surveillance strategy.
Extended Data Fig. 3
Extended Data Fig. 3. Sensitivity analyses on accuracy of observed variant proportions for different relative transmissibility factor.
Omicron-like virus properties assumed for variant and initial proportion of population with some degree of protection against the variant virus assumed at 10%. All specimens collected from the population from all healthcare facilities were sent to one facility to be sampled for sequencing (population-wide genomic surveillance strategy). Different transmissibility factor of Omicron relative to Delta (fmutant) were assumed. (A) Maximum absolute difference between observed and circulating variant proportions. (B) Proportion of timepoints when sequencing was performed that the absolute difference between observed and circulating variant proportions is greater than 20%. All results were computed from 1,000 random independent simulations for each surveillance strategy.
Extended Data Fig. 4
Extended Data Fig. 4. Sensitivity analyses on accuracy of observed variant proportions for different relative transmissibility factor.
Omicron-like virus properties assumed for variant and initial proportion of population with some degree of protection against the variant virus assumed at 40%. All specimens collected from the population from all healthcare facilities were sent to one facility to be sampled for sequencing (population-wide genomic surveillance strategy). Different transmissibility factor of Omicron relative to Delta (fmutant) were assumed. (A) Maximum absolute difference between observed and circulating variant proportions. (B) Proportion of timepoints when sequencing was performed that the absolute difference between observed and circulating variant proportions is greater than 20%. All results were computed from 1,000 random independent simulations for each surveillance strategy.
Extended Data Fig. 5
Extended Data Fig. 5. Impact of prevalence of extant variant of concern (I0,WT) at the time of new variant introduction.
For each Ag-RDT availability (differently colored), the expected day (points and line) and the standard deviation (shaded region) when the first Omicron variant specimen (in the background of Delta) is sampled for sequencing since its introduction is plotted against the proportion of positive specimens to be sampled for sequencing daily. Each panel shows a different prevalence of the Delta variant (I0,WT) at the point of Omicron introduction. Sampling for sequencing was drawn from the population-wide scenario. The plotted results were computed from 1,000 random independent simulations for each surveillance strategy.
Extended Data Fig. 6
Extended Data Fig. 6. Recommended approach to enhance genomic surveillance robustness.
In each plot, the operating curves of the expected day when the first Omicron BA.1 variant sequence is generated are plotted for different proportion of specimens to sample for sequencing per day and turnaround times. We assumed that the Omicron BA.1 variant was circulating at 1% initially with Delta variant in the background. We also assumed that positive specimens sampled within each week for sequencing are consolidated into a batch before they are referred for sequencing. Turnaround time refers to the time between collection of each weekly consolidated batch of positive specimens to the acquisition of its corresponding sequencing data. The vertical axes denote the number of days passed since the introduction of the Omicron variant (left) and its corresponding circulating proportion (right). The horizontal axes denote the proportion of positive specimens to sample for sequencing per day (bottom) and the corresponding mean number of sequences to be generated per week per 1,000,000 people over a 90-day epidemic period. (A) Specimen pools for sequencing from one tertiary facility with testing rate at 27 tests per 100,000 persons per day (tests/100 k/day). (B) Specimen pools for sequencing from one tertiary sentinel facility with testing rate at 100 tests/100k/day. (C) Specimen pools for sequencing from 25% of all tertiary facilities acting as sentinel sites with testing rate at 100 tests/100k/day. (D) Zoomed-in plot of (C) for sequencing proportions varying between 1–25%. Sequencing 5–10% of positive specimens (blue shaded region) would ensure that we would expectedly detect Omicron within 30 days if turnaround time is kept within one week. All results were computed from 1,000 random independent simulations for each surveillance strategy. The shaded region depicts the standard deviation across simulations.
Extended Data Fig. 7
Extended Data Fig. 7. Transmissions attributed to infectors of different disease status.
Proportion of transmissions events (data points) attributed to different disease status of infectors across all independent epidemic simulations (n = 280). Bar plots show the mean proportion with error bars denoting ± standard deviation.
Extended Data Fig. 8
Extended Data Fig. 8. Model validation.
We compared the mean number of reported cases (blue line, top panel) and deaths (red line, bottom panel) estimated by our simulations (10 simulations in total; see Supplementary Text) against the actual case and death counts (black lines) in Lusaka, Zambia during the second wave of infections between 25 December 2020 and 24 March 2021. Actual case and death counts were retrieved from the Zambia COVID-19 Dashboard (https://www.arcgis.com/apps/dashboards/3b3a01c1d8444932ba075fb44b119b63). The blue and red shaded regions in each plot denotes the standard deviation of reported cases (top panel) and deaths (bottom panel) respectively.

Update of

References

    1. Robishaw JD, et al. Genomic surveillance to combat COVID-19: challenges and opportunities. Lancet Microbe. 2021;2:e481–e484. doi: 10.1016/S2666-5247(21)00121-X. - DOI - PMC - PubMed
    1. Davies NG, et al. Estimated transmissibility and impact of SARS-CoV-2 lineage B.1.1.7 in England. Science. 2021;372:eabg3055. doi: 10.1126/science.abg3055. - DOI - PMC - PubMed
    1. Cherian S, et al. SARS-CoV-2 spike mutations, L452R, T478K, E484Q and P681R, in the second wave of COVID-19 in Maharashtra, India. Microorganisms. 2021;9:1542. doi: 10.3390/microorganisms9071542. - DOI - PMC - PubMed
    1. Viana R, et al. Rapid epidemic expansion of the SARS-CoV-2 Omicron variant in southern Africa. Nature. 2022;603:679–686. doi: 10.1038/s41586-022-04411-y. - DOI - PMC - PubMed
    1. Brito, A. F. et al. Global disparities in SARS-CoV-2 genomic surveillance. Nat. Commun.13, 7003 (2022). - PMC - PubMed

Publication types