

Ensemble feature selection with data-driven thresholding for Alzheimer's disease biomarker discovery
- PMID: 36624372
- PMCID: PMC9830744
- DOI: 10.1186/s12859-022-05132-9
Ensemble feature selection with data-driven thresholding for Alzheimer's disease biomarker discovery
Abstract
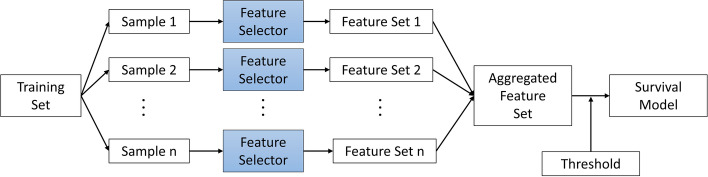
Background: Feature selection is often used to identify the important features in a dataset but can produce unstable results when applied to high-dimensional data. The stability of feature selection can be improved with the use of feature selection ensembles, which aggregate the results of multiple base feature selectors. However, a threshold must be applied to the final aggregated feature set to separate the relevant features from the redundant ones. A fixed threshold, which is typically used, offers no guarantee that the final set of selected features contains only relevant features. This work examines a selection of data-driven thresholds to automatically identify the relevant features in an ensemble feature selector and evaluates their predictive accuracy and stability. Ensemble feature selection with data-driven thresholding is applied to two real-world studies of Alzheimer's disease. Alzheimer's disease is a progressive neurodegenerative disease with no known cure, that begins at least 2-3 decades before overt symptoms appear, presenting an opportunity for researchers to identify early biomarkers that might identify patients at risk of developing Alzheimer's disease.
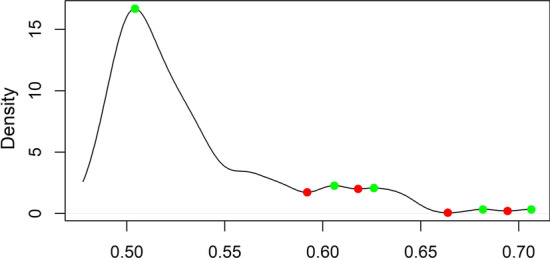
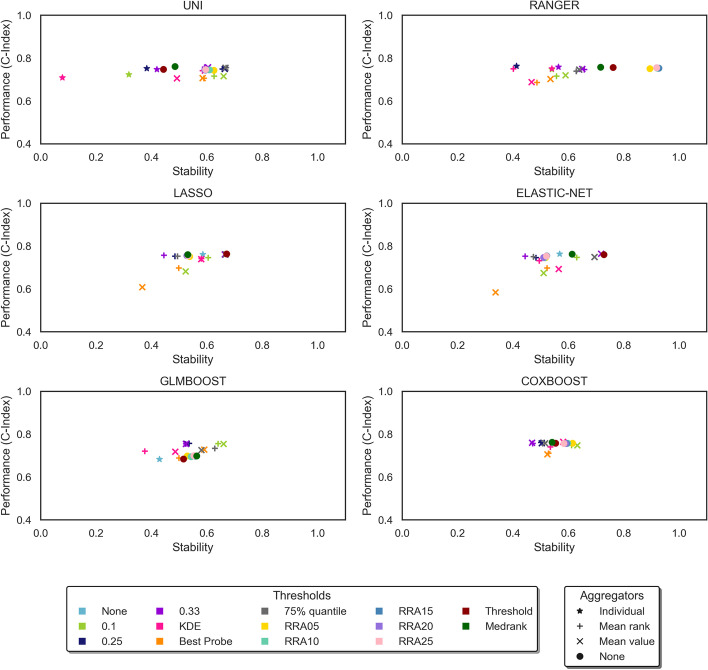
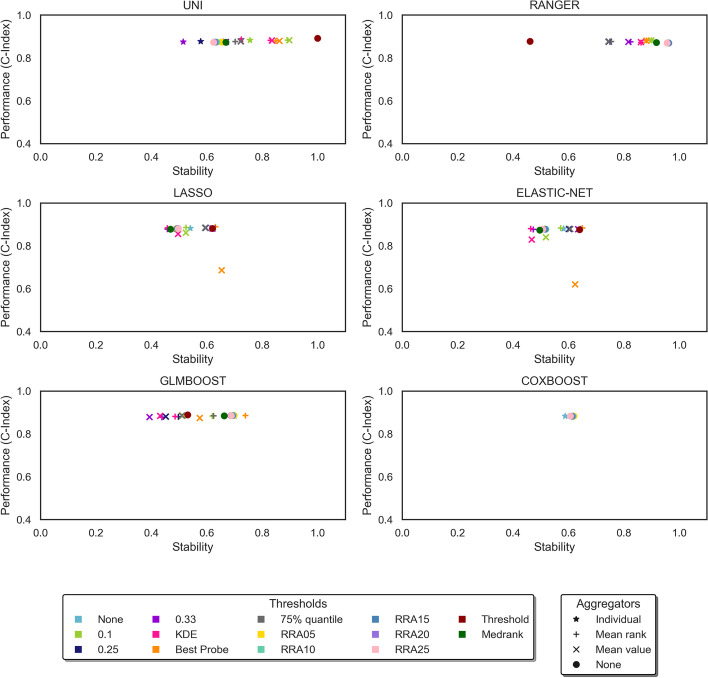
Results: The ensemble feature selectors, combined with data-driven thresholds, produced more stable results, on the whole, than the equivalent individual feature selectors, showing an improvement in stability of up to 34%. The most successful data-driven thresholds were the robust rank aggregation threshold and the threshold algorithm threshold from the field of information retrieval. The features identified by applying these methods to datasets from Alzheimer's disease studies reflect current findings in the AD literature.
Conclusions: Data-driven thresholds applied to ensemble feature selectors provide more stable, and therefore more reproducible, selections of features than individual feature selectors, without loss of performance. The use of a data-driven threshold eliminates the need to choose a fixed threshold a-priori and can select a more meaningful set of features. A reliable and compact set of features can produce more interpretable models by identifying the factors that are important in understanding a disease.
Keywords: Alzheimer's disease; Data-driven thresholding; Ensemble feature selection; Stability.
© 2023. The Author(s).
Conflict of interest statement
The authors declare that they have no competing interests.
Figures
References
-
- Guyon I, Elisseeff A, De AM. An introduction to variable and feature selection. J Mach Learn Res. 2003;3:1157–1182.
-
- Awada W, Khoshgoftaar TM, Dittman D, Wald R, Napolitano A. A review of the stability of feature selection techniques for bioinformatics data. In International Conference on Information Reuse & Integration (IRI) 2012;356–63.
-
- Kalousis A, Prados J, Hilario M. Stability of feature selection algorithms: a study on high-dimensional spaces. Knowl Inf Syst. 2007;12(1):95–116. doi: 10.1007/s10115-006-0040-8. - DOI
-
- Yu L, Ding C, Loscalzo S. Stable feature selection via dense feature groups. Proceedings of the 14th ACM SIGKDD international conference on knowledge discovery and data mining. 2008;803–11.
MeSH terms
Substances
Grants and funding
LinkOut - more resources
Full Text Sources
Medical
