

Characterization of Danube Swabian population samples on a high-resolution genome-wide basis
- PMID: 36624381
- PMCID: PMC9830925
- DOI: 10.1186/s12864-022-09092-5
Characterization of Danube Swabian population samples on a high-resolution genome-wide basis
Abstract
Background: German-derived ethnicities are one of the largest ethnic groups in Hungary, dating back to the formation of the Kingdom of Hungary, which took place at the beginning of the 11th century. Germans arrived in Hungary in many waves. The most significant immigration wave took place following the collapse of the Ottoman Empire in East-Central Europe which closed the 150 year long Ottoman occupation. To date, there are no comprehensive genome-wide studies investigating the genetic makeup of the Danube Swabians. Here we analyzed 47 Danube Swabian samples collected from elderly Swabian individuals living in the Dunaszekcső-Bár area, in Danube side villages of Southwest Hungary. These Swabians, according to self-declaration, did not admix with other ethnic groups for 3-6 succeeding generations. Using Illumina Infinium 720 K Beadchip genotype data, we applied allele frequency-based and haplotype-based genome-wide marker data analyses to investigate the ancestry and genetic composition of the collected Danube Swabian samples.
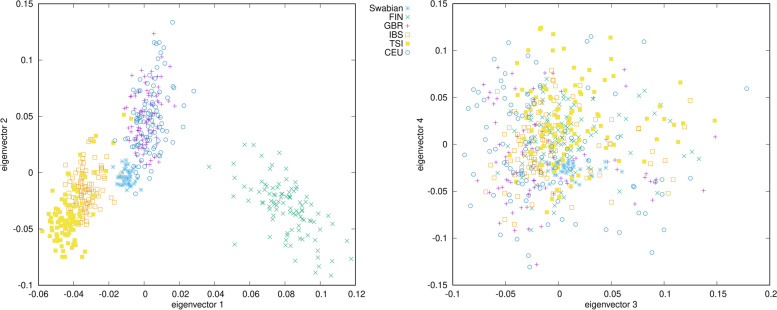
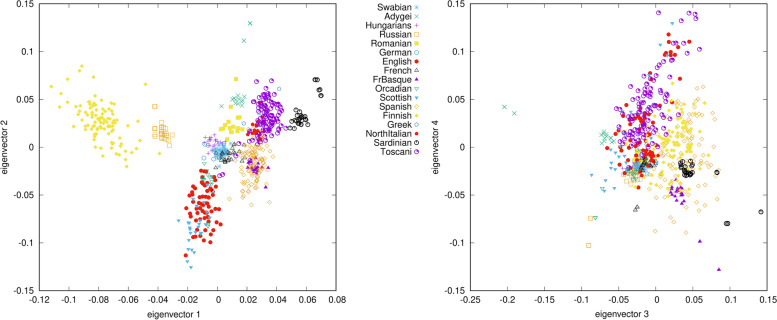
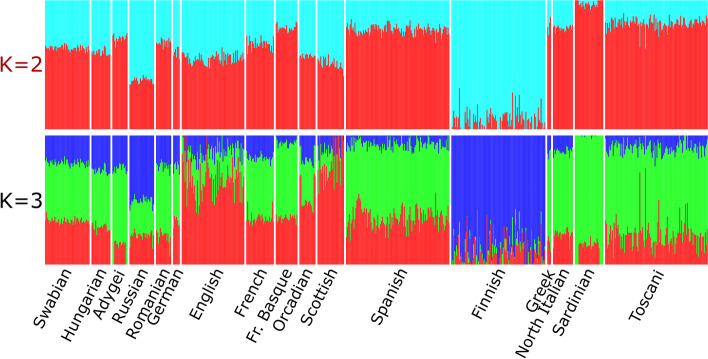
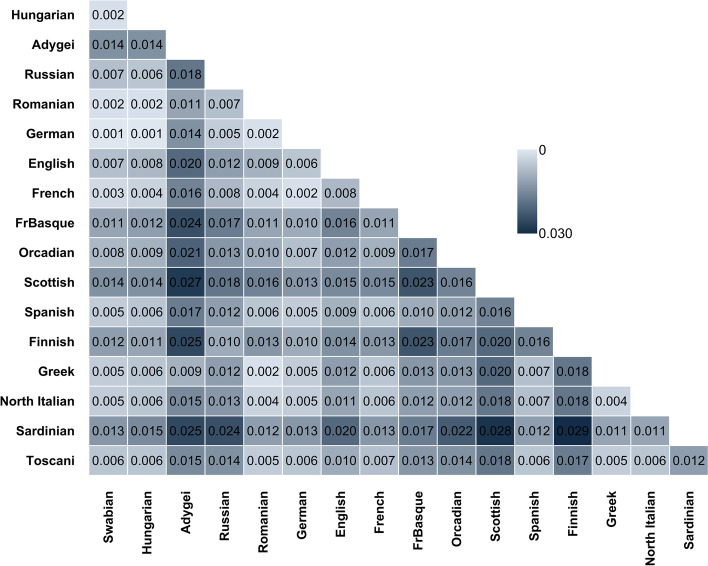
Results: Haplotype-based analyses like identity by descent segment analysis show that the investigated Danube Swabians possess significant German and other West European ancestry, but their Hungarian ancestry is also prominent. Our results suggest that their main source of ancestry can be traced back to Western Europe, presumably to the region of Germany.
Conclusion: This is the first analysis of Danube Swabian population samples based on genome-wide autosomal data. Our results establish the basis for conducting further comprehensive research on Danube Swabians and on other German ethnicities of the Carpathian basin, which can help reconstruct their origin, and identify their major archaic genomic patterns.
Keywords: Admixture; Ethnic group; Genome-wide data; Haplotype; Population genetics; Swabians.
© 2023. The Author(s).
Conflict of interest statement
The authors declare that they have no competing interests.
Figures


References
-
- Lajtai M. Nemzetiségi viszonyok és a statisztikai adatgyűjtés Magyarországon [Ethnic relations and statistical data collection in Hungary] Statisztikai Sz. 2020;98:547–72. doi: 10.20311/stat2020.6.hu0547. - DOI
-
- Senz JV. Geschichte der Donauschwaben. 7th ed. Amalthea; 1993.
-
- Bezerédy G. Dunaszekcső és Bár története. Baranya Megyei Levéltár; 1975.
-
- Belügyminisztérium Nyilvántartások Vezetéséért Felelős Helyettes Államtitkárság. Magyarország állandó lakossága 2021. január 1-jén [The stationary population of Hungary on January 1, 2021] [Internet]. Belügyminisztérium Nyilvántartások Vezetéséért Felelős Helyettes Államtitkárság; 2021. Available from: https://www.nyilvantarto.hu/hu/statisztikak?stat=kozerdeku.
MeSH terms
Grants and funding
LinkOut - more resources
Full Text Sources
