. 2023 Jan 9;20(1):2.
doi: 10.1186/s12987-022-00404-1.

Apicobasal transferrin receptor localization and trafficking in brain capillary endothelial cells

Affiliations

Apicobasal transferrin receptor localization and trafficking in brain capillary endothelial cells

Simone S E Nielsen et al. Fluids Barriers CNS. .

Erratum in

Abstract

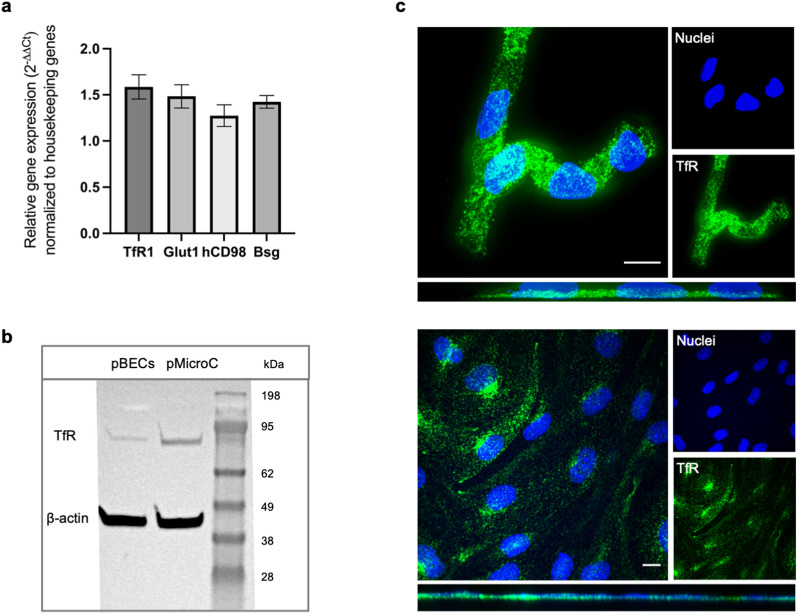
The detailed mechanisms by which the transferrin receptor (TfR) and associated ligands traffic across brain capillary endothelial cells (BECs) of the CNS-protective blood-brain barrier constitute an important knowledge gap within maintenance and regulation of brain iron homeostasis. This knowledge gap also presents a major obstacle in research aiming to develop strategies for efficient receptor-mediated drug delivery to the brain. While TfR-mediated trafficking from blood to brain have been widely studied, investigation of TfR-mediated trafficking from brain to blood has been limited. In this study we investigated TfR distribution on the apical and basal plasma membranes of BECs using expansion microscopy, enabling sufficient resolution to separate the cellular plasma membranes of these morphological flat cells, and verifying both apical and basal TfR membrane domain localization. Using immunofluorescence-based transcellular transport studies, we delineated endosomal sorting of TfR endocytosed from the apical and basal membrane, respectively, as well as bi-directional TfR transcellular transport capability. The findings indicate different intracellular sorting mechanisms of TfR, depending on the apicobasal trafficking direction across the BBB, with the highest transcytosis capacity in the brain-to-blood direction. These results are of high importance for the current understanding of brain iron homeostasis. Also, the high level of TfR trafficking from the basal to apical membrane of BECs potentially explains the low transcytosis which are observed for the TfR-targeted therapeutics to the brain parenchyma.

Keywords: Apicobasal polarity; Blood–brain barrier; Brain drug delivery; Brain endothelial cells; Expansion microscopy; Intracellular trafficking; Transferrin receptor (TfR).


Conflict of interest statement

The authors declare no competing interests.

Figures

Fig. 1
Fig. 1
In vitro BBB model integrity. Schematic illustration of the applied non-contact co-culture (NCC) in vitro blood–brain barrier (BBB) model setup including primary porcine brain endothelial cells (pBECs) and astrocytes (a), with validation of the barrier integrity by transendothelial electrical resistance (TEER) (Ω cm2) presented as mean values (± SEM) and vertical line marking the day of inducement (b), and confocal microscopic imaging with 60 × magnification of immunofluorescent stainings (c) visualizing the tight- and adherens junctional (TJ and AJ) proteins claudin-5, ZO-1, occludin and p120 catenin (red), and Hoechst stain of nuclei (blue), with scale bar equal to 10 μm
Fig. 2
Fig. 2
TfR expression in brain endothelial cells. Expression of the transferrin receptor and other receptor targets in the applied in vitro model was investigated by qPCR (a) with graph showing the relative mRNA gene expression levels (2−ΔΔCt), with data normalized to the housekeeping genes β2-microglobulin, Ribosomal Protein L4, TATA-Box Binding Protein, and Hypoxanthine Phosphoribosyl- transferase 1. TfR protein level expressions were investigated by Western blotting (b) using anti-TfR and ß-actin antibody on pBEC and pMicroC lysate. Normal IF staining and confocal microscopy of pMicroC and NCC established pBECs furthermore revealed TfR expression (green), with Hoechst stain of nuclei (blue) (c). Scale bar is equal to 10 μm
Fig. 3
Fig. 3
Validation of the in vitro model polarization by directional Rhodamine 123 transport. The apical-to-basal A, B and basal-to-apical B, Atransendothelial permeability of two concentrations of the P-glycoprotein substrate Rhodamine 123 (3 and 30 µM) was assessed in the applied in vitro BBB model. The apparent permeability (Papp) for B, A transport was significantly higher than for A, B transport for both concentrations, indicating efflux pump activity and apicobasal polarity for the efflux transporter. Data are presented as mean values (± SEM). Significance was tested using t-test
Fig. 4
Fig. 4
Apical and Basal TfR membrane domain localization in Brain Endothelial Cells using Expansion Microscopy. Normal immunofluorescence (IF) confocal micrographs (a, b, pre-expansion) served to control for sufficient isotropic expansion (c) and staining pattern of expansion specimens (dk). Representative pre-expansion IF images show BECs established on collagen IV pre-coated filter membranes in non-contact co-culture (NCC) with astrocytes under normal and retended endoplasmic-Golgi trafficking conditions from Brefeldin A (BFA) treatment (c) with images presented as maximum intensity z-projections of nuclei (blue), collagen IV (red) and TfR (green) stainings, obtained by confocal microscopic imaging with 60 × magnification (UPlanSApo 60X, NA 1.20, water objective lens). Top view illustrates the rough overview of TfR distribution patterns while the below orthogonal view illustrates the limitation of a detailed overview using the normal IF technique. Expansion Microscopy (ExM) allowed visualization of the detailed TfR localization, with confocal micrographs of expanded BEC specimens in orthogonal view (eg, ik) showing nuclei staining (blue), collagen IV staining (red) marking the basal membrane localization, and TfR staining (green). Representative single slides present the capability of differentiating the apical and basal membranes and visualize TfR distribution, with white arrows marking basal TfR. Scale bar is equal to 10 μm for micrograph a–c and 1.6 μm for micrograph dk
Fig. 5
Fig. 5
Quantification of Apical and Basal TfR membrane distribution. Quantification of TfR membrane localization based on Fiji line scans of the mean intensity of TfR signals in the apical and basal domains of BECs a, with graph b showing the basal membrane domain signals normalized to the apical membrane domain signals (%) under normal (- BFA) and BFA conditions (+ BFA). Statistical significance was tested using t-test
Fig. 6
Fig. 6
Immunofluorescence evaluation of TfR transcellular transport capability in BECs. Representative confocal images of apical and basal internalized TfR (green) and EEA1 (red) co-localization at 10 min a, analyzed using IMARIS spot segmentation and co-localization analysis. Hoechst stain of nuclei is blue. Graph shows the semi-quantification of TfR internalized from either the apical membrane (dark grey) or basal membrane (light grey), and co-localization with the markers of the intracellular compartments b. Significance was tested using two-way ANOVA with Tukey’s multiple comparison test
Fig. 7
Fig. 7
IF evaluation of TfR transcellular transport capability in BECs. Schematic illustration of the experimental approach for the receptor transcellular transport capability in the apical-to-basal (A-B) and basal-to-apical (B-A) direction using an immunocytochemistry assay a. Micrographs were obtained from confocal microscopy using 40 × magnification, b, with representative images showing the transcellular transport capability (green), control with secondary antibody only (Ctrl), and Hoechst staining of nuclei. Scale bar is equal to 10 μm. c Semi-quantitative analysis using spot detection, with data presented as spots/cell (5) normalized within each experimental replicate, and presented as mean ± SEM. Statistical significance was tested using t-test

References

    1. Duck KA, Connor JR. Iron uptake and transport across physiological barriers. Biometals. 2016;29:573–591. doi: 10.1007/s10534-016-9952-2. - DOI - PMC - PubMed
    1. Johnsen KB, Burkhart A, Thomsen LB, Andresen TL, Moos T. Targeting the transferrin receptor for brain drug delivery. Prog Neurobiol. 2019;181:101665. doi: 10.1016/j.pneurobio.2019.101665. - DOI - PubMed
    1. Nichols E, et al. Estimation of the global prevalence of dementia in 2019 and forecasted prevalence in 2050: an analysis for the global burden of disease study 2019. Lancet Public Heal. 2022;7:e105–e125. doi: 10.1016/S2468-2667(21)00249-8. - DOI - PMC - PubMed
    1. Pardridge WM. A historical review of brain drug delivery. Pharmaceutics. 2022 doi: 10.3390/pharmaceutics14061283. - DOI - PMC - PubMed
    1. Giugliani R, et al. Iduronate-2-sulfatase fused with anti-hTfR antibody, pabinafusp alfa, for MPS-II: a phase 2 trial in Brazil. Mol Ther. 2021;29:2378–2386. doi: 10.1016/j.ymthe.2021.03.019. - DOI - PMC - PubMed

MeSH terms

LinkOut - more resources