

Identification of Oxidative Stress-Related Biomarkers in Diabetic Kidney Disease
- PMID: 36624863
- PMCID: PMC9825216
- DOI: 10.1155/2022/1067504
Identification of Oxidative Stress-Related Biomarkers in Diabetic Kidney Disease
Abstract
Background: Diabetic kidney disease (DKD) is a leading cause of end-stage renal disease throughout the world. In kidney disease, oxidative stress has been linked to both antioxidant depletions and increased reactive oxygen species (ROS) production. Thus, the objective of this study was to identify biomarkers related to oxidative stress in DKD.
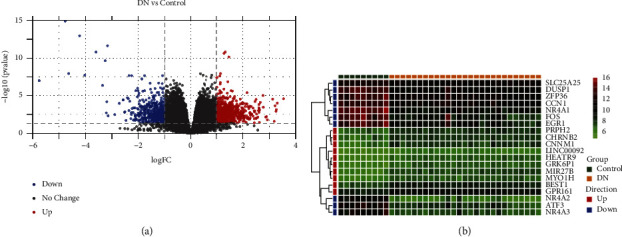
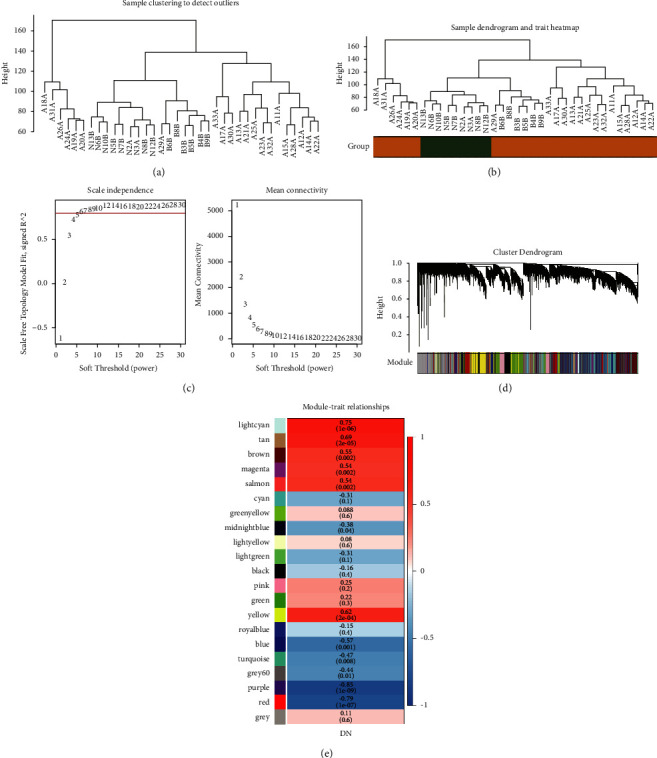
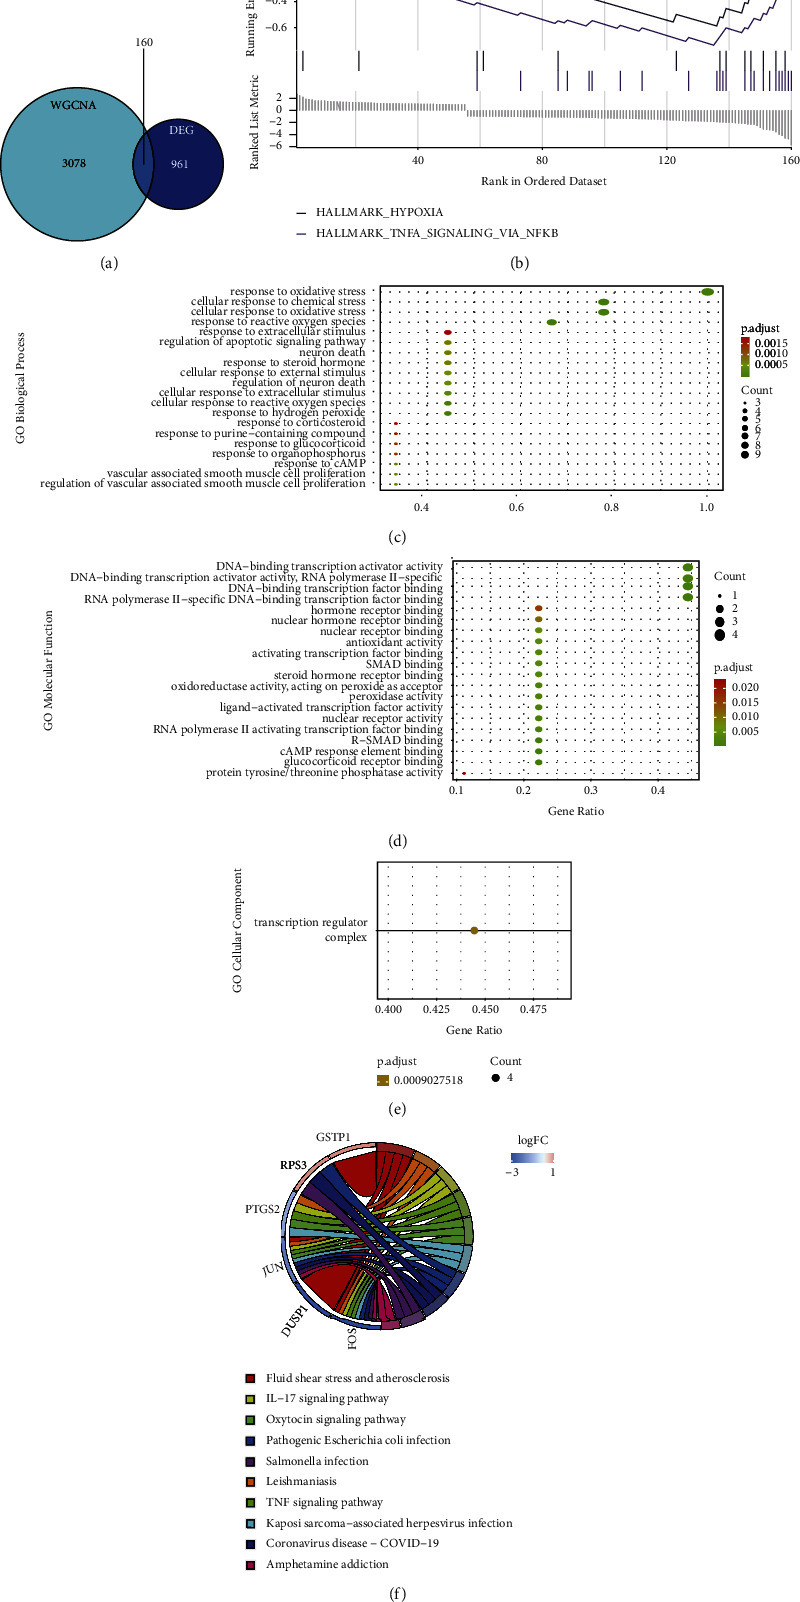
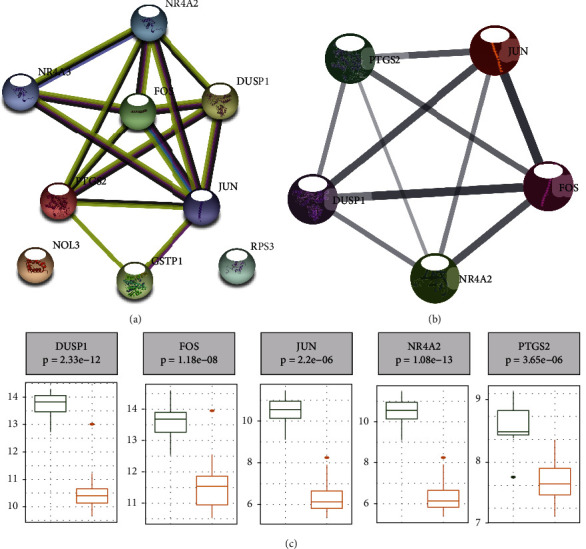
Methods: The gene expression profile of the DKD was extracted from the Gene Expression Omnibus (GEO) database. The identification of the differentially expressed genes (DEGs) was performed using the "limma" R package, and weighted gene coexpression network analysis (WGCNA) was used to find the gene modules that were most related to DKD. Gene ontology (GO) and Kyoto Encyclopedia of Genes and Genomes (KEGG) pathway enrichment analysis was performed using "Org.Hs.eg.db" R package. The protein-protein interaction (PPI) network was constructed using the STRING database. The hub genes were identified by the Molecular Complex Detection (MCODE) plug-in of Cytoscape software. The diagnostic capacity of hub genes was verified using the receiver operating characteristic (ROC) curve. Correlations between diagnostic genes were analyzed using the "corrplot" package. In addition, the miRNA gene transcription factor (TF) network was used to explain the regulatory mechanism of hub genes in DKD.
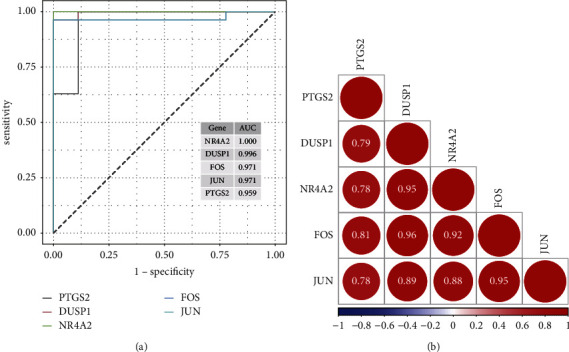
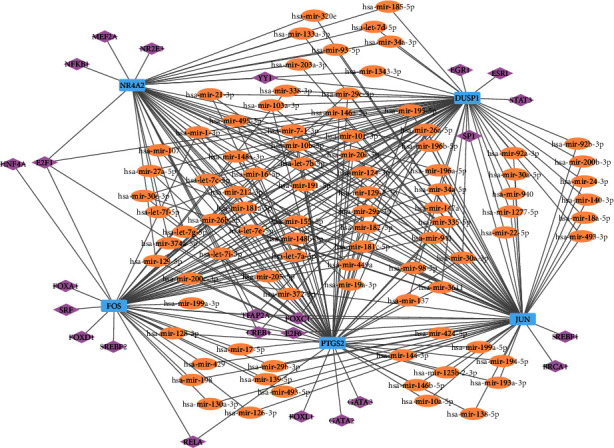
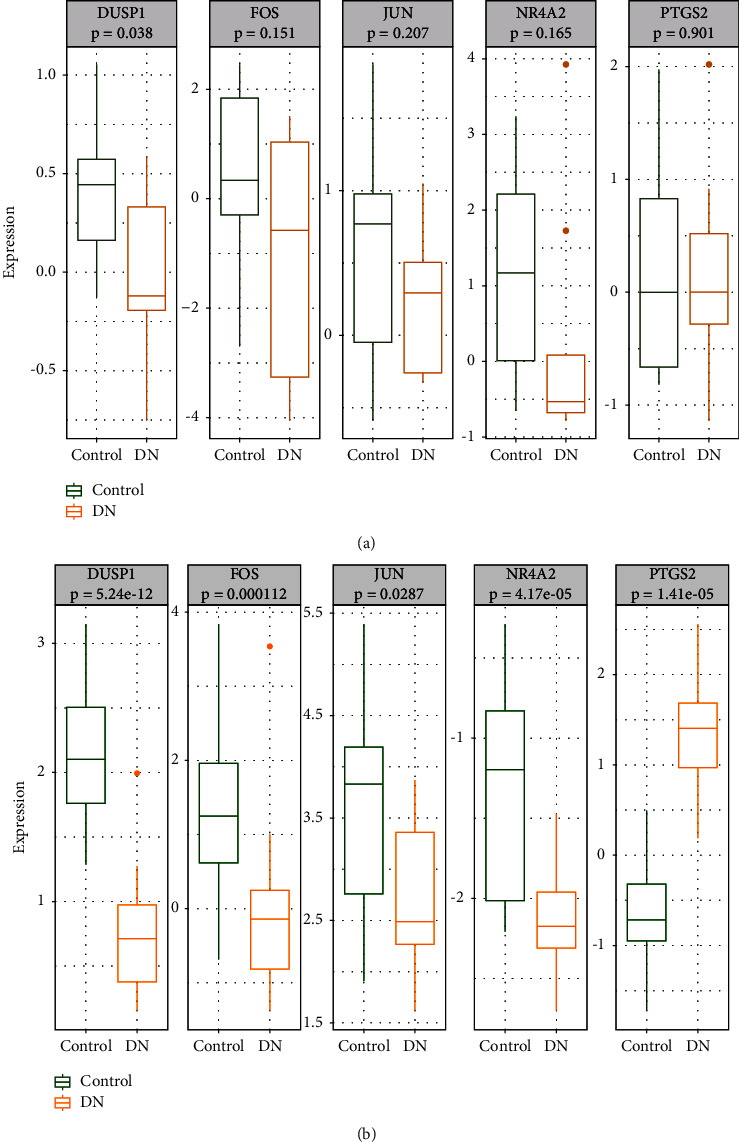
Results: DEGs analysis and WGCNA-identified 160 key genes were identified in DKD patients. Among them, nine oxidative stress-related genes were identified as candidate hub genes for DKD. Using the PPI network, five hub genes, NR4A2, DUSP1, FOS, JUN, and PTGS2, were subsequently identified. All the hub genes were downregulated in DKD and had a high diagnostic value of DKD. The regulatory mechanism of hub genes was analyzed from the miRNA gene-TF network.
Conclusion: Our study identified NR4A2, DUSP1, FOS, JUN, and PTGS2 as hub genes of DKD. These genes may serve as potential therapeutic targets for DKD patients.
Copyright © 2022 Xiaoju Ma et al.
Conflict of interest statement
The authors declare that they have no conflicts of interest.
Figures
Similar articles
-
Screening and Identification of Hub Genes in the Development of Early Diabetic Kidney Disease Based on Weighted Gene Co-Expression Network Analysis.Front Endocrinol (Lausanne). 2022 Jun 3;13:883658. doi: 10.3389/fendo.2022.883658. eCollection 2022. Front Endocrinol (Lausanne). 2022. PMID: 35721731 Free PMC article.
-
Identification and Validation of Oxidative Stress-Related Hub Genes in Parkinson's Disease.Mol Neurobiol. 2025 May;62(5):5466-5483. doi: 10.1007/s12035-024-04622-6. Epub 2024 Nov 18. Mol Neurobiol. 2025. PMID: 39556279
-
Single-cell RNA and transcriptome sequencing profiles identify immune-associated key genes in the development of diabetic kidney disease.Front Immunol. 2023 Mar 29;14:1030198. doi: 10.3389/fimmu.2023.1030198. eCollection 2023. Front Immunol. 2023. PMID: 37063851 Free PMC article.
-
Identification of hub genes in diabetic kidney disease via multiple-microarray analysis.Ann Transl Med. 2020 Aug;8(16):997. doi: 10.21037/atm-20-5171. Ann Transl Med. 2020. PMID: 32953797 Free PMC article.
-
Integrated miRNA-mRNA network revealing the key molecular characteristics of ossification of the posterior longitudinal ligament.Medicine (Baltimore). 2020 May 22;99(21):e20268. doi: 10.1097/MD.0000000000020268. Medicine (Baltimore). 2020. PMID: 32481304 Free PMC article.
Cited by
-
Single-Cell Spatial MIST for Versatile, Scalable Detection of Protein Markers.Biosensors (Basel). 2023 Aug 27;13(9):852. doi: 10.3390/bios13090852. Biosensors (Basel). 2023. PMID: 37754086 Free PMC article.
References
-
- Huang H. W., Yang C. M., Yang C. H. Fibroblast growth factor type 1 ameliorates high-glucose-induced oxidative stress and neuroinflammation in retinal pigment epithelial cells and a streptozotocin-induced diabetic rat model. International Journal of Molecular Sciences . 2021;22(13):p. 7233. doi: 10.3390/ijms22137233. - DOI - PMC - PubMed
-
- Winiarska A., Knysak M., Nabrdalik K., Gumprecht J., Stompor T. Inflammation and oxidative stress in diabetic kidney disease: the targets for SGLT2 inhibitors and GLP-1 receptor agonists. International Journal of Molecular Sciences . 2021;22(19):p. 10822. doi: 10.3390/ijms221910822. - DOI - PMC - PubMed
LinkOut - more resources
Full Text Sources
Research Materials
Miscellaneous
