. 2023 Feb 3;132(3):267-289.
doi: 10.1161/CIRCRESAHA.122.321504. Epub 2023 Jan 10.

Ponatinib Drives Cardiotoxicity by S100A8/A9-NLRP3-IL-1β Mediated Inflammation

Affiliations

Ponatinib Drives Cardiotoxicity by S100A8/A9-NLRP3-IL-1β Mediated Inflammation

Sultan Tousif et al. Circ Res. .

Abstract

Background: The tyrosine kinase inhibitor ponatinib is the only treatment option for chronic myelogenous leukemia patients with T315I (gatekeeper) mutation. Pharmacovigilance analysis of Food and Drug Administration and World Health Organization datasets has revealed that ponatinib is the most cardiotoxic agent among all Food and Drug Administration-approved tyrosine kinase inhibitors in a real-world scenario. However, the mechanism of ponatinib-induced cardiotoxicity is unknown.

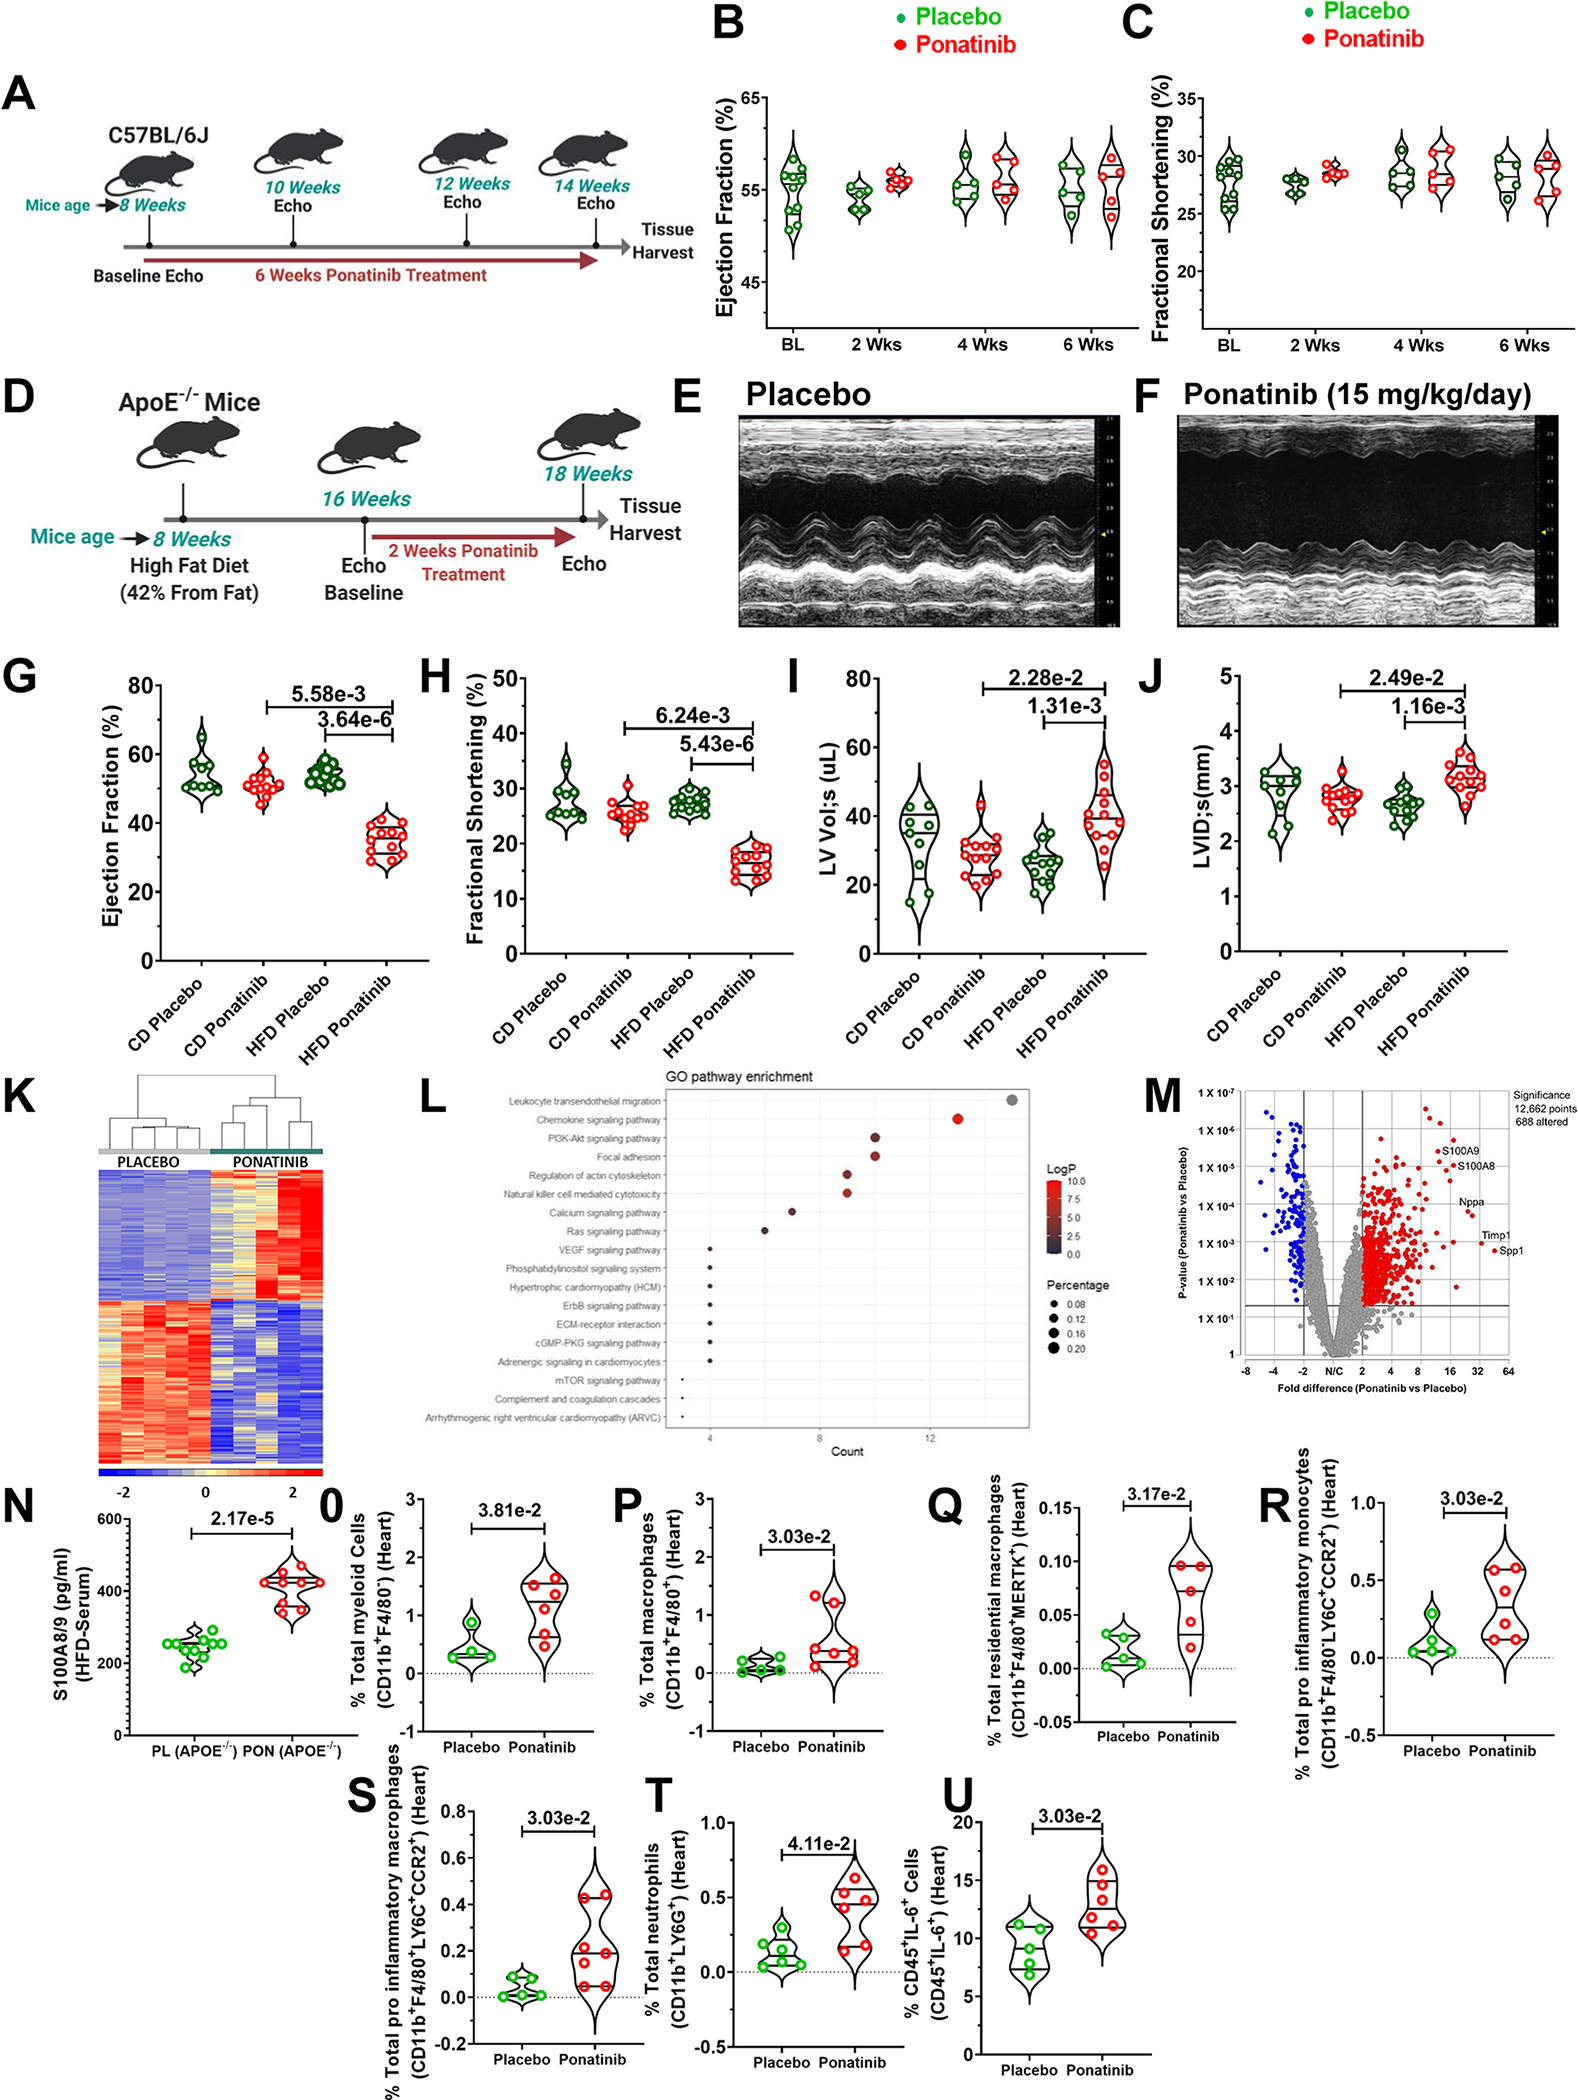
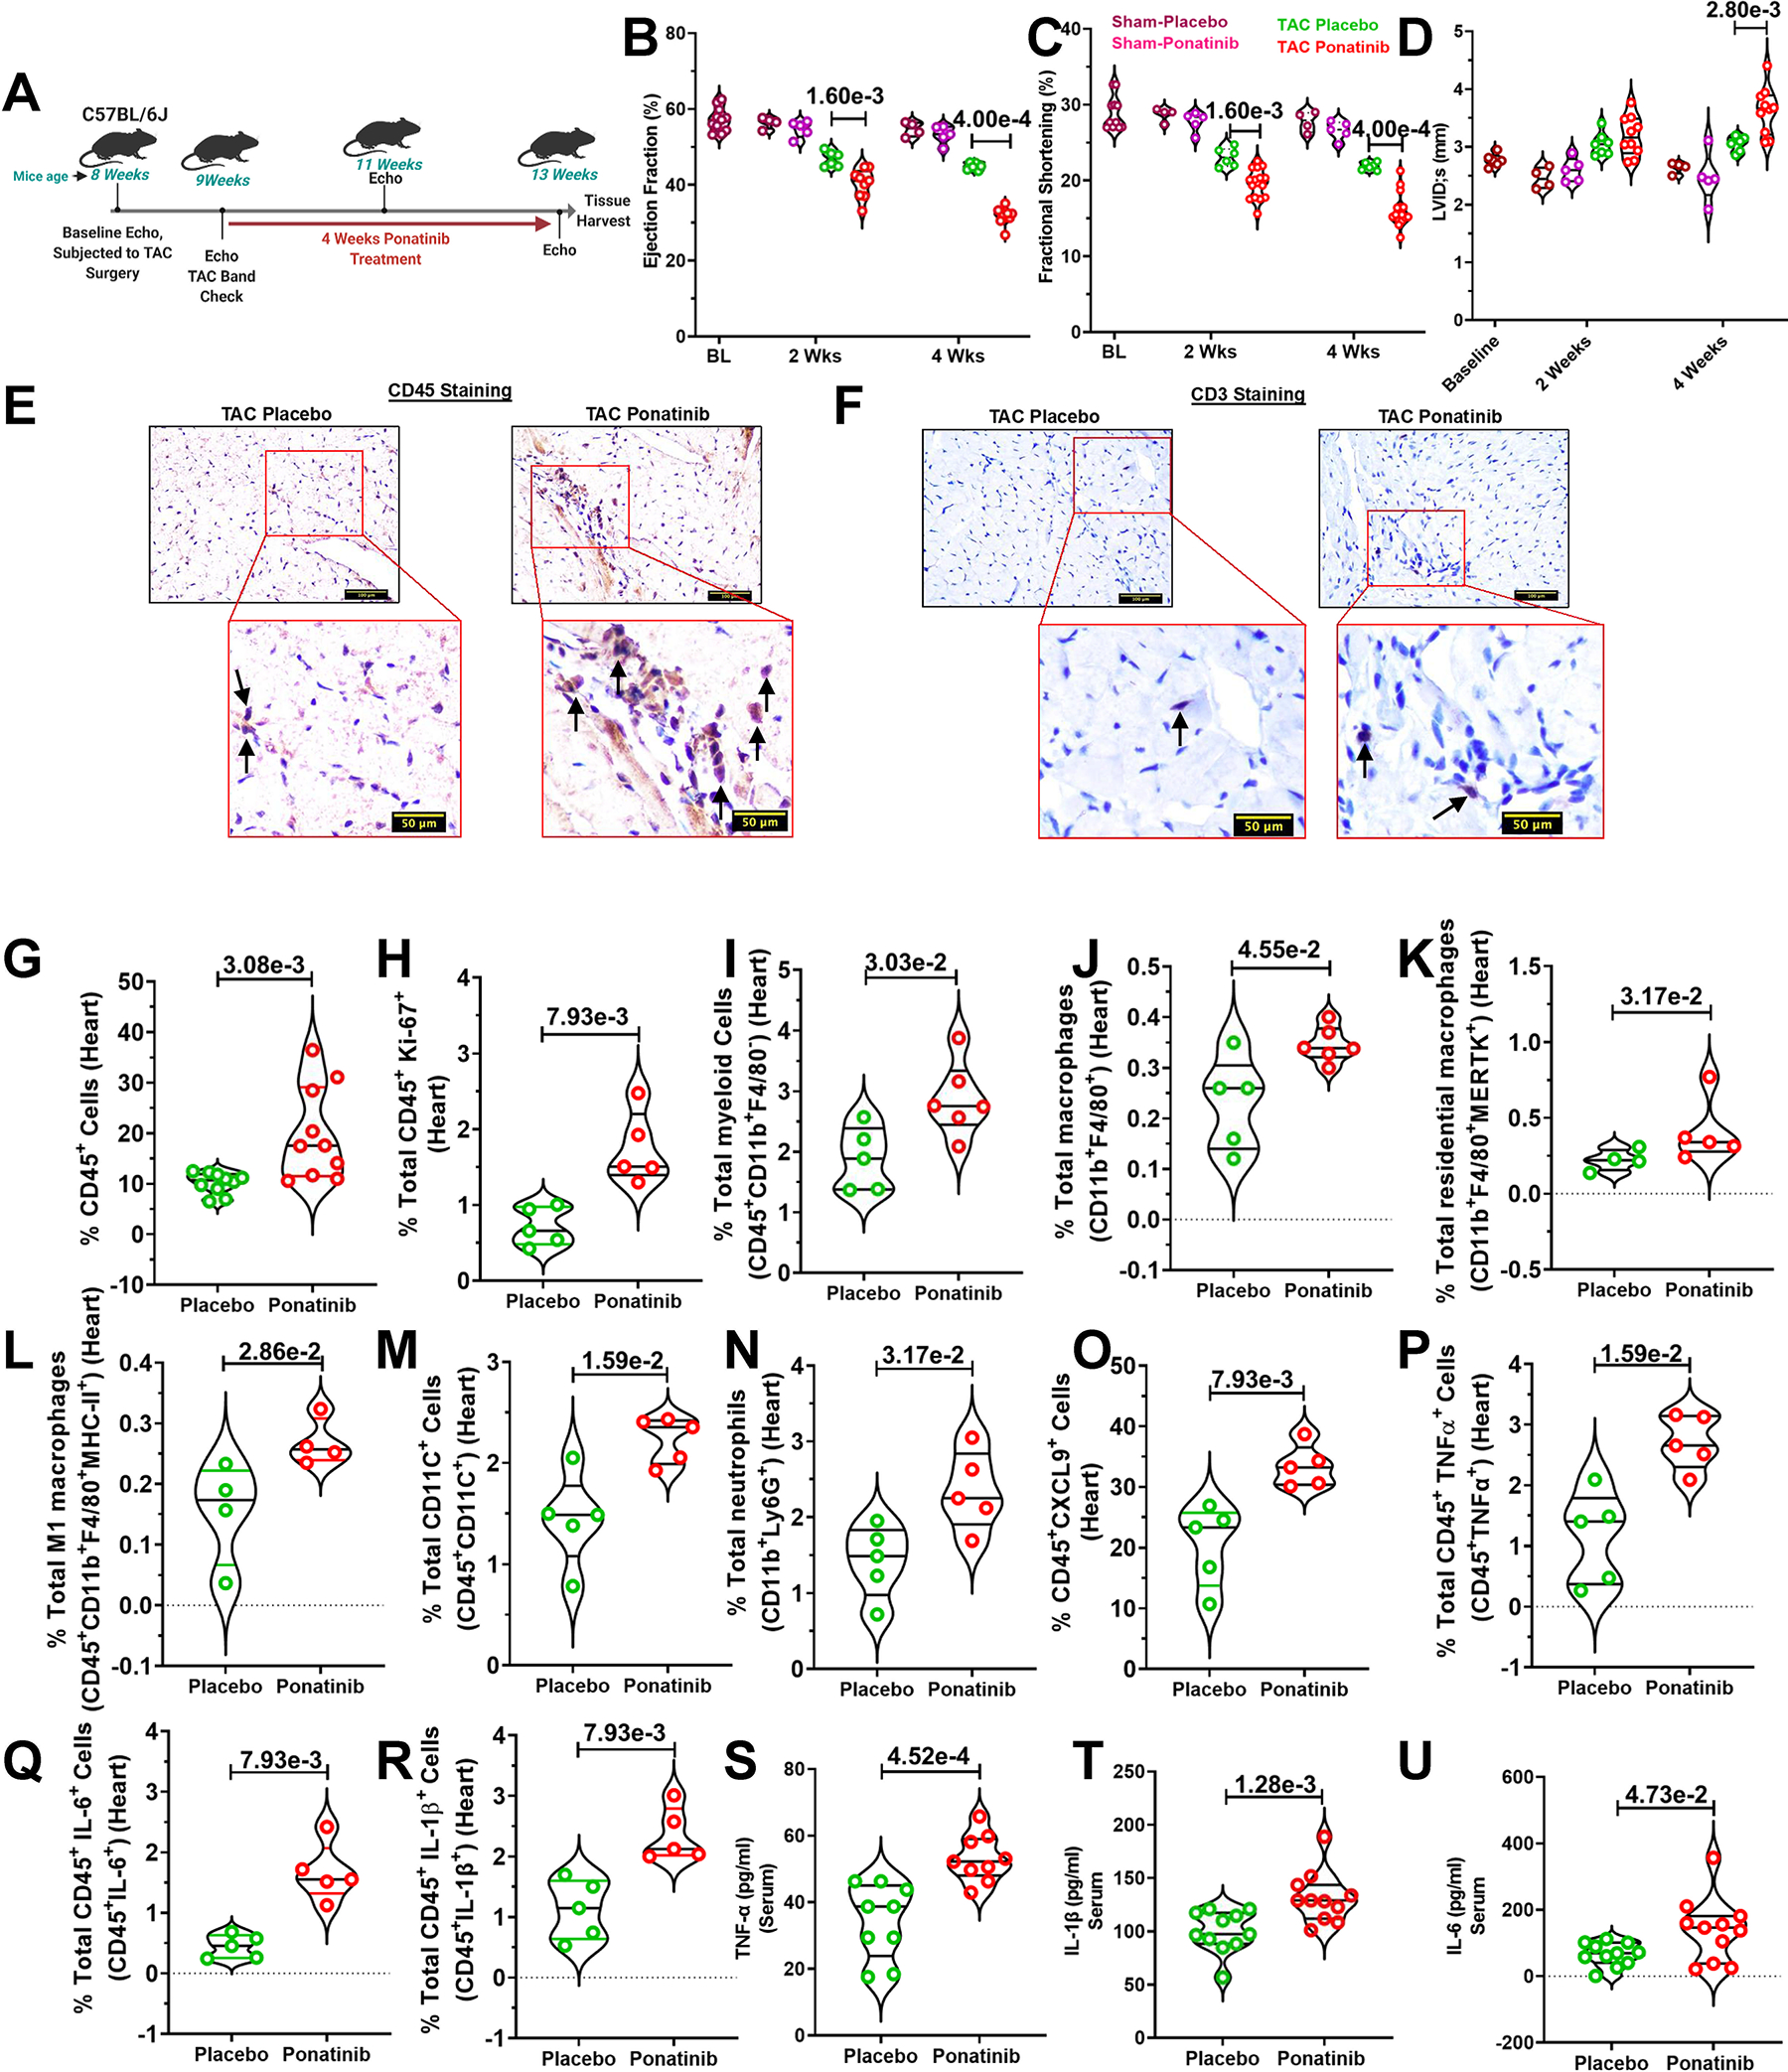
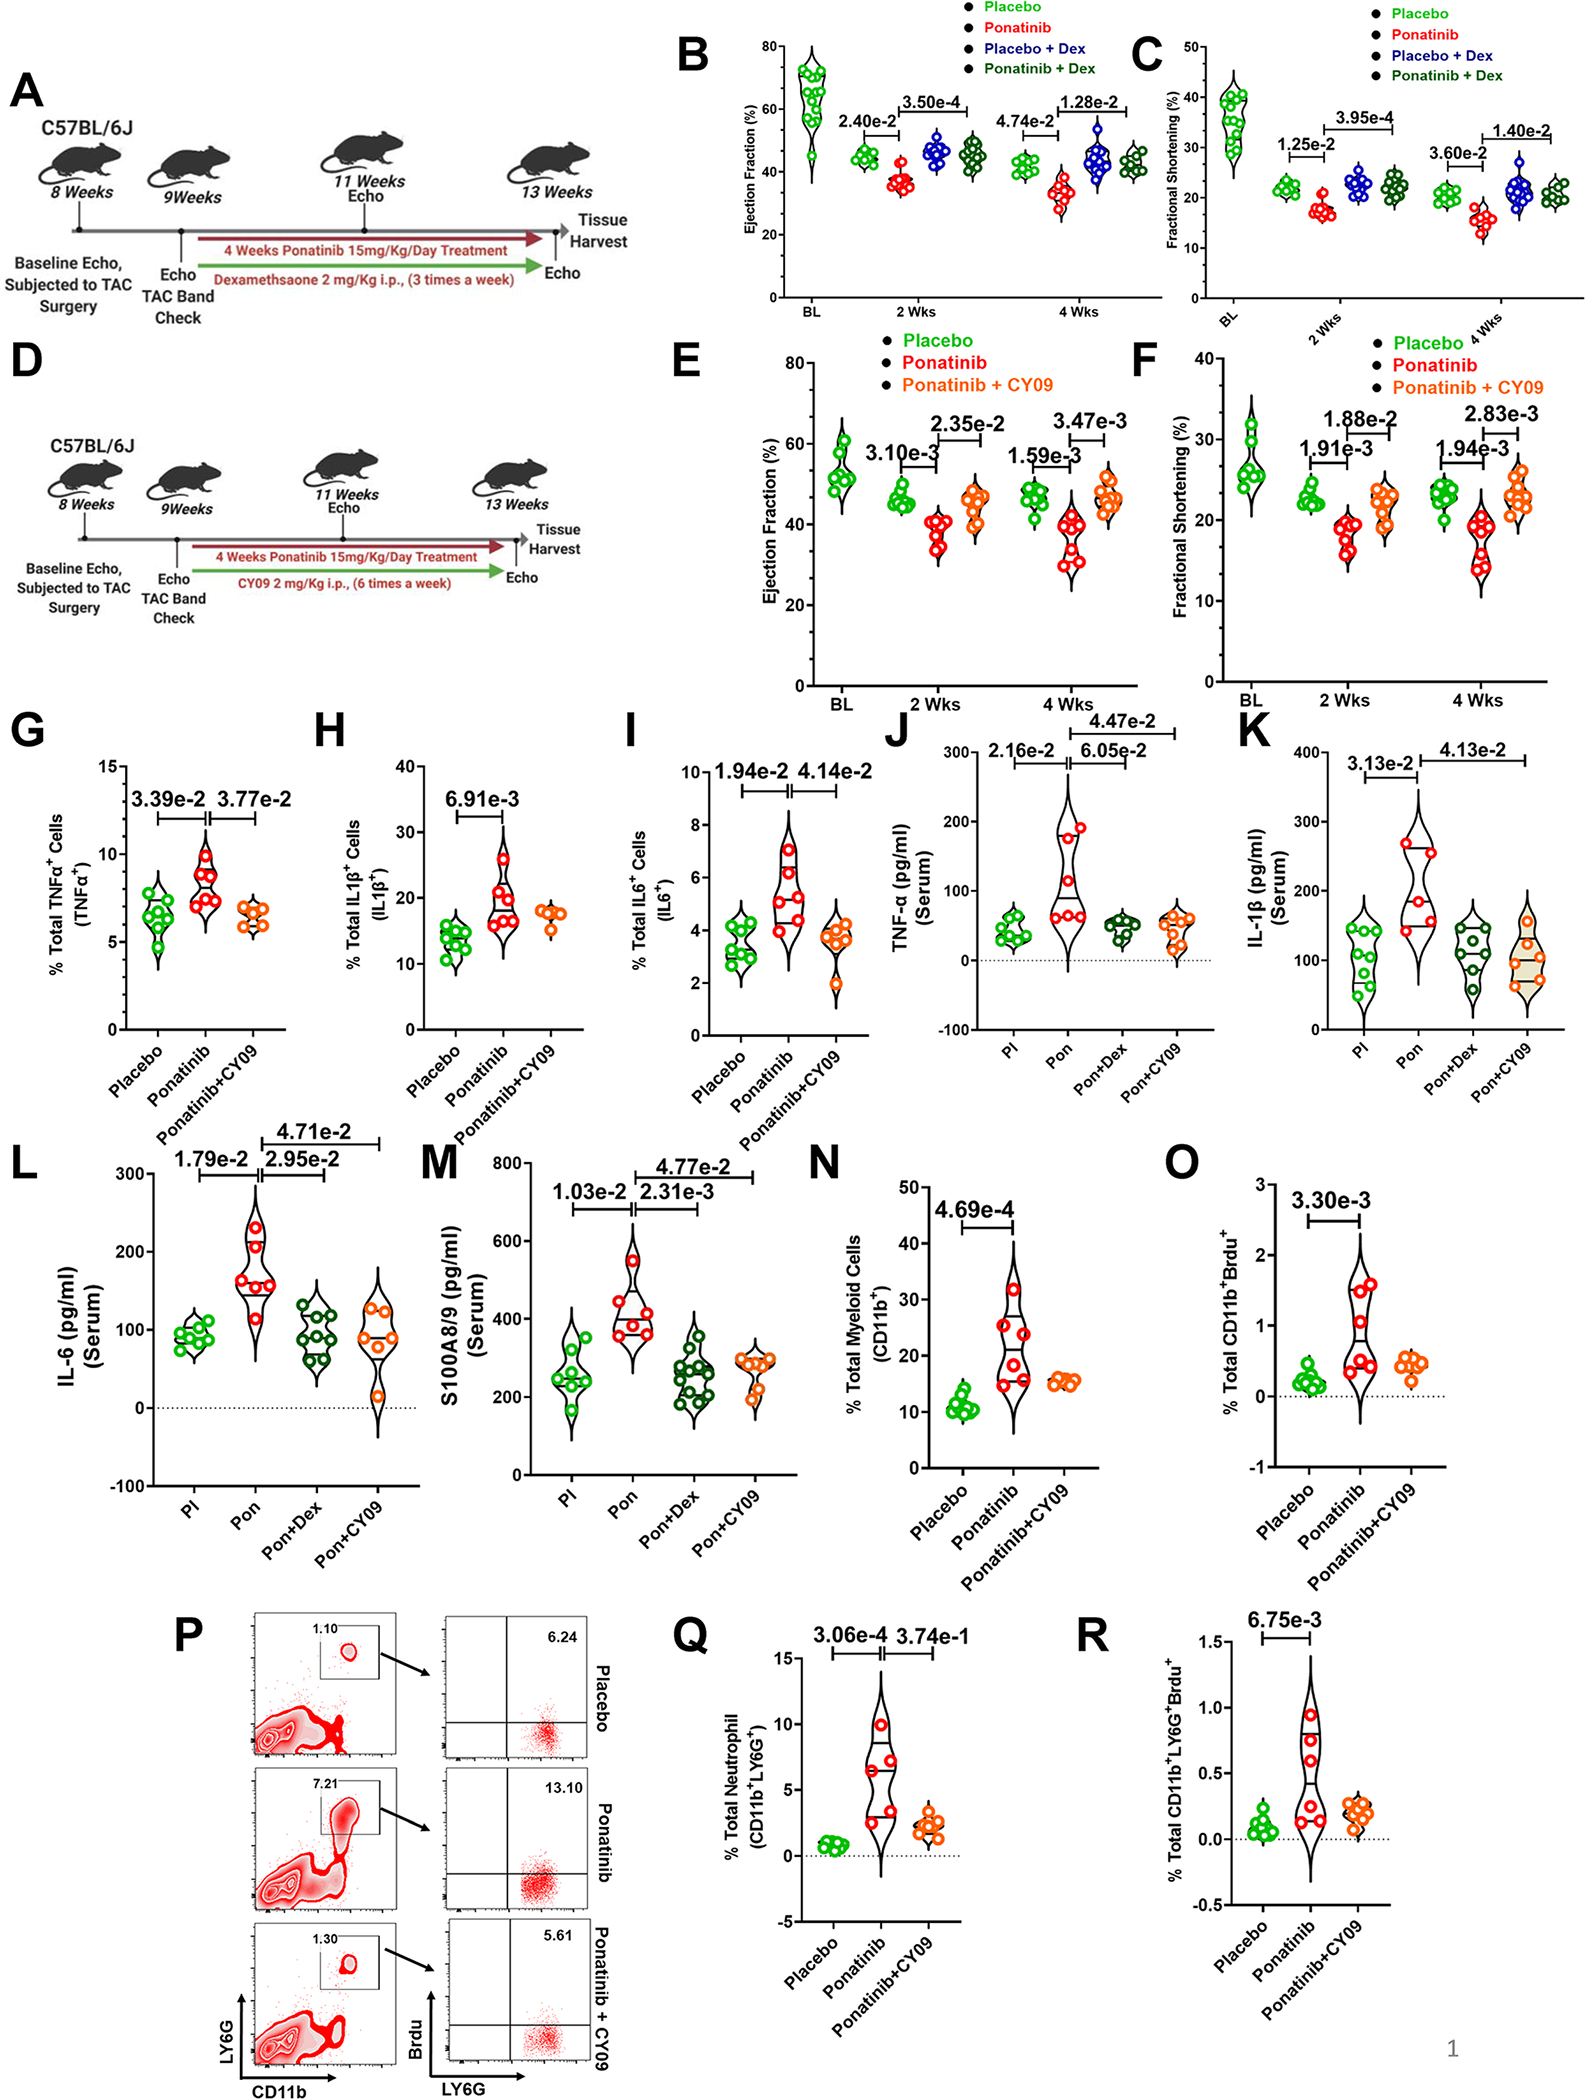
Methods: The lack of well-optimized mouse models has hampered the in vivo cardio-oncology studies. Here, we show that cardiovascular comorbidity mouse models evidence a robust cardiac pathological phenotype upon ponatinib treatment. A combination of multiple in vitro and in vivo models was employed to delineate the underlying molecular mechanisms.

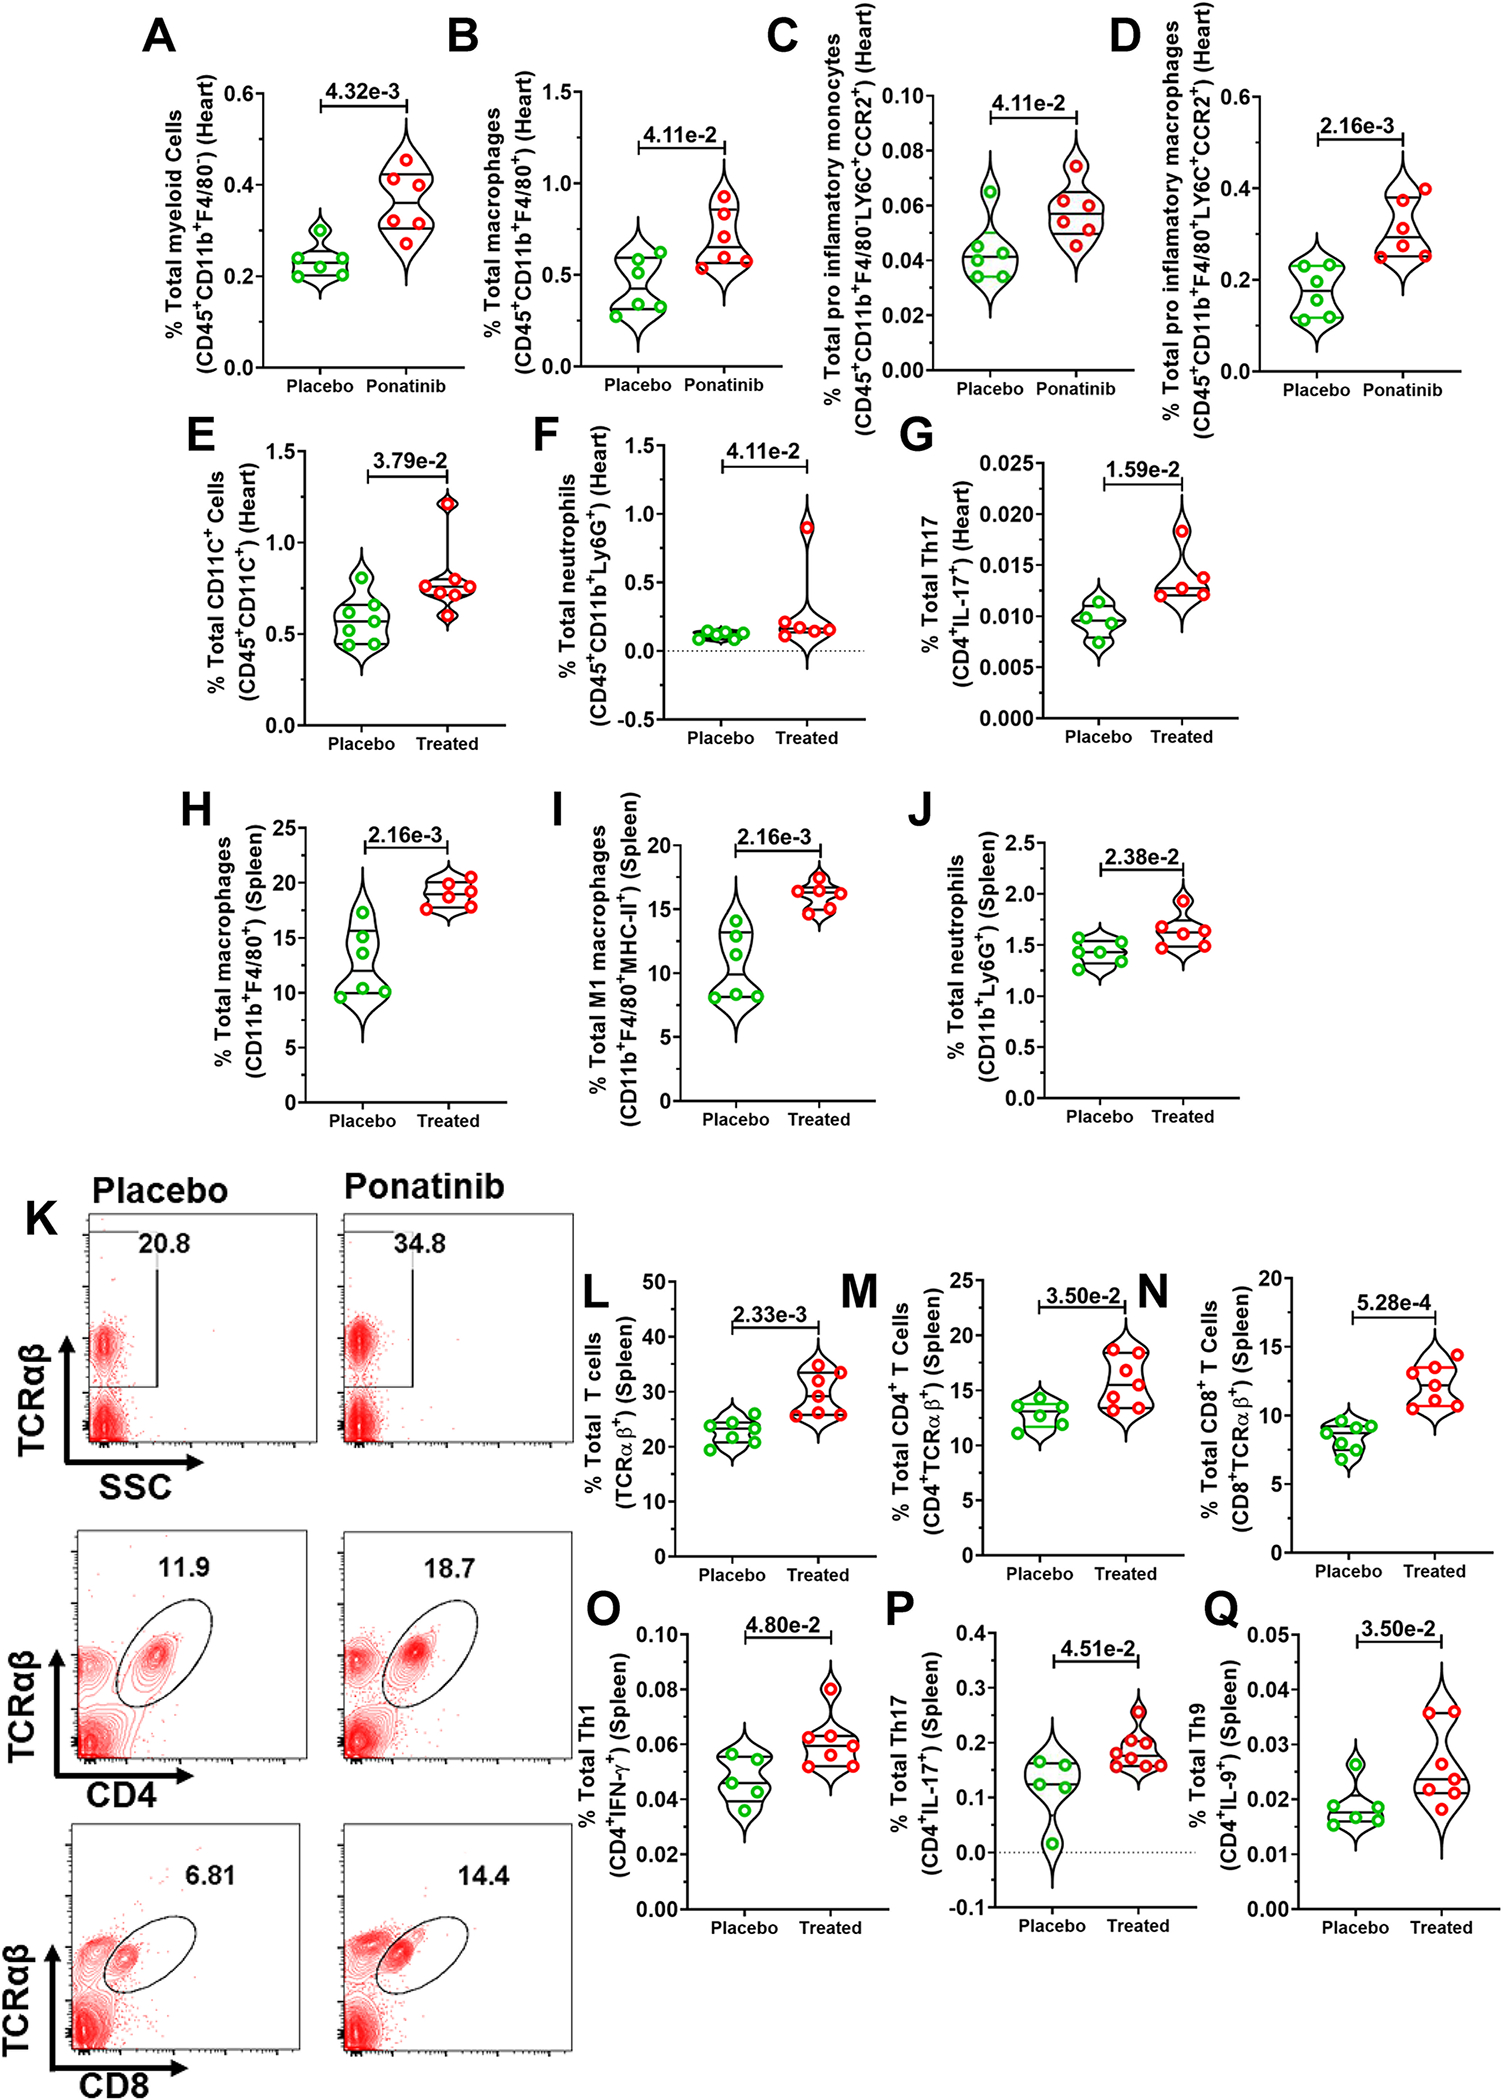
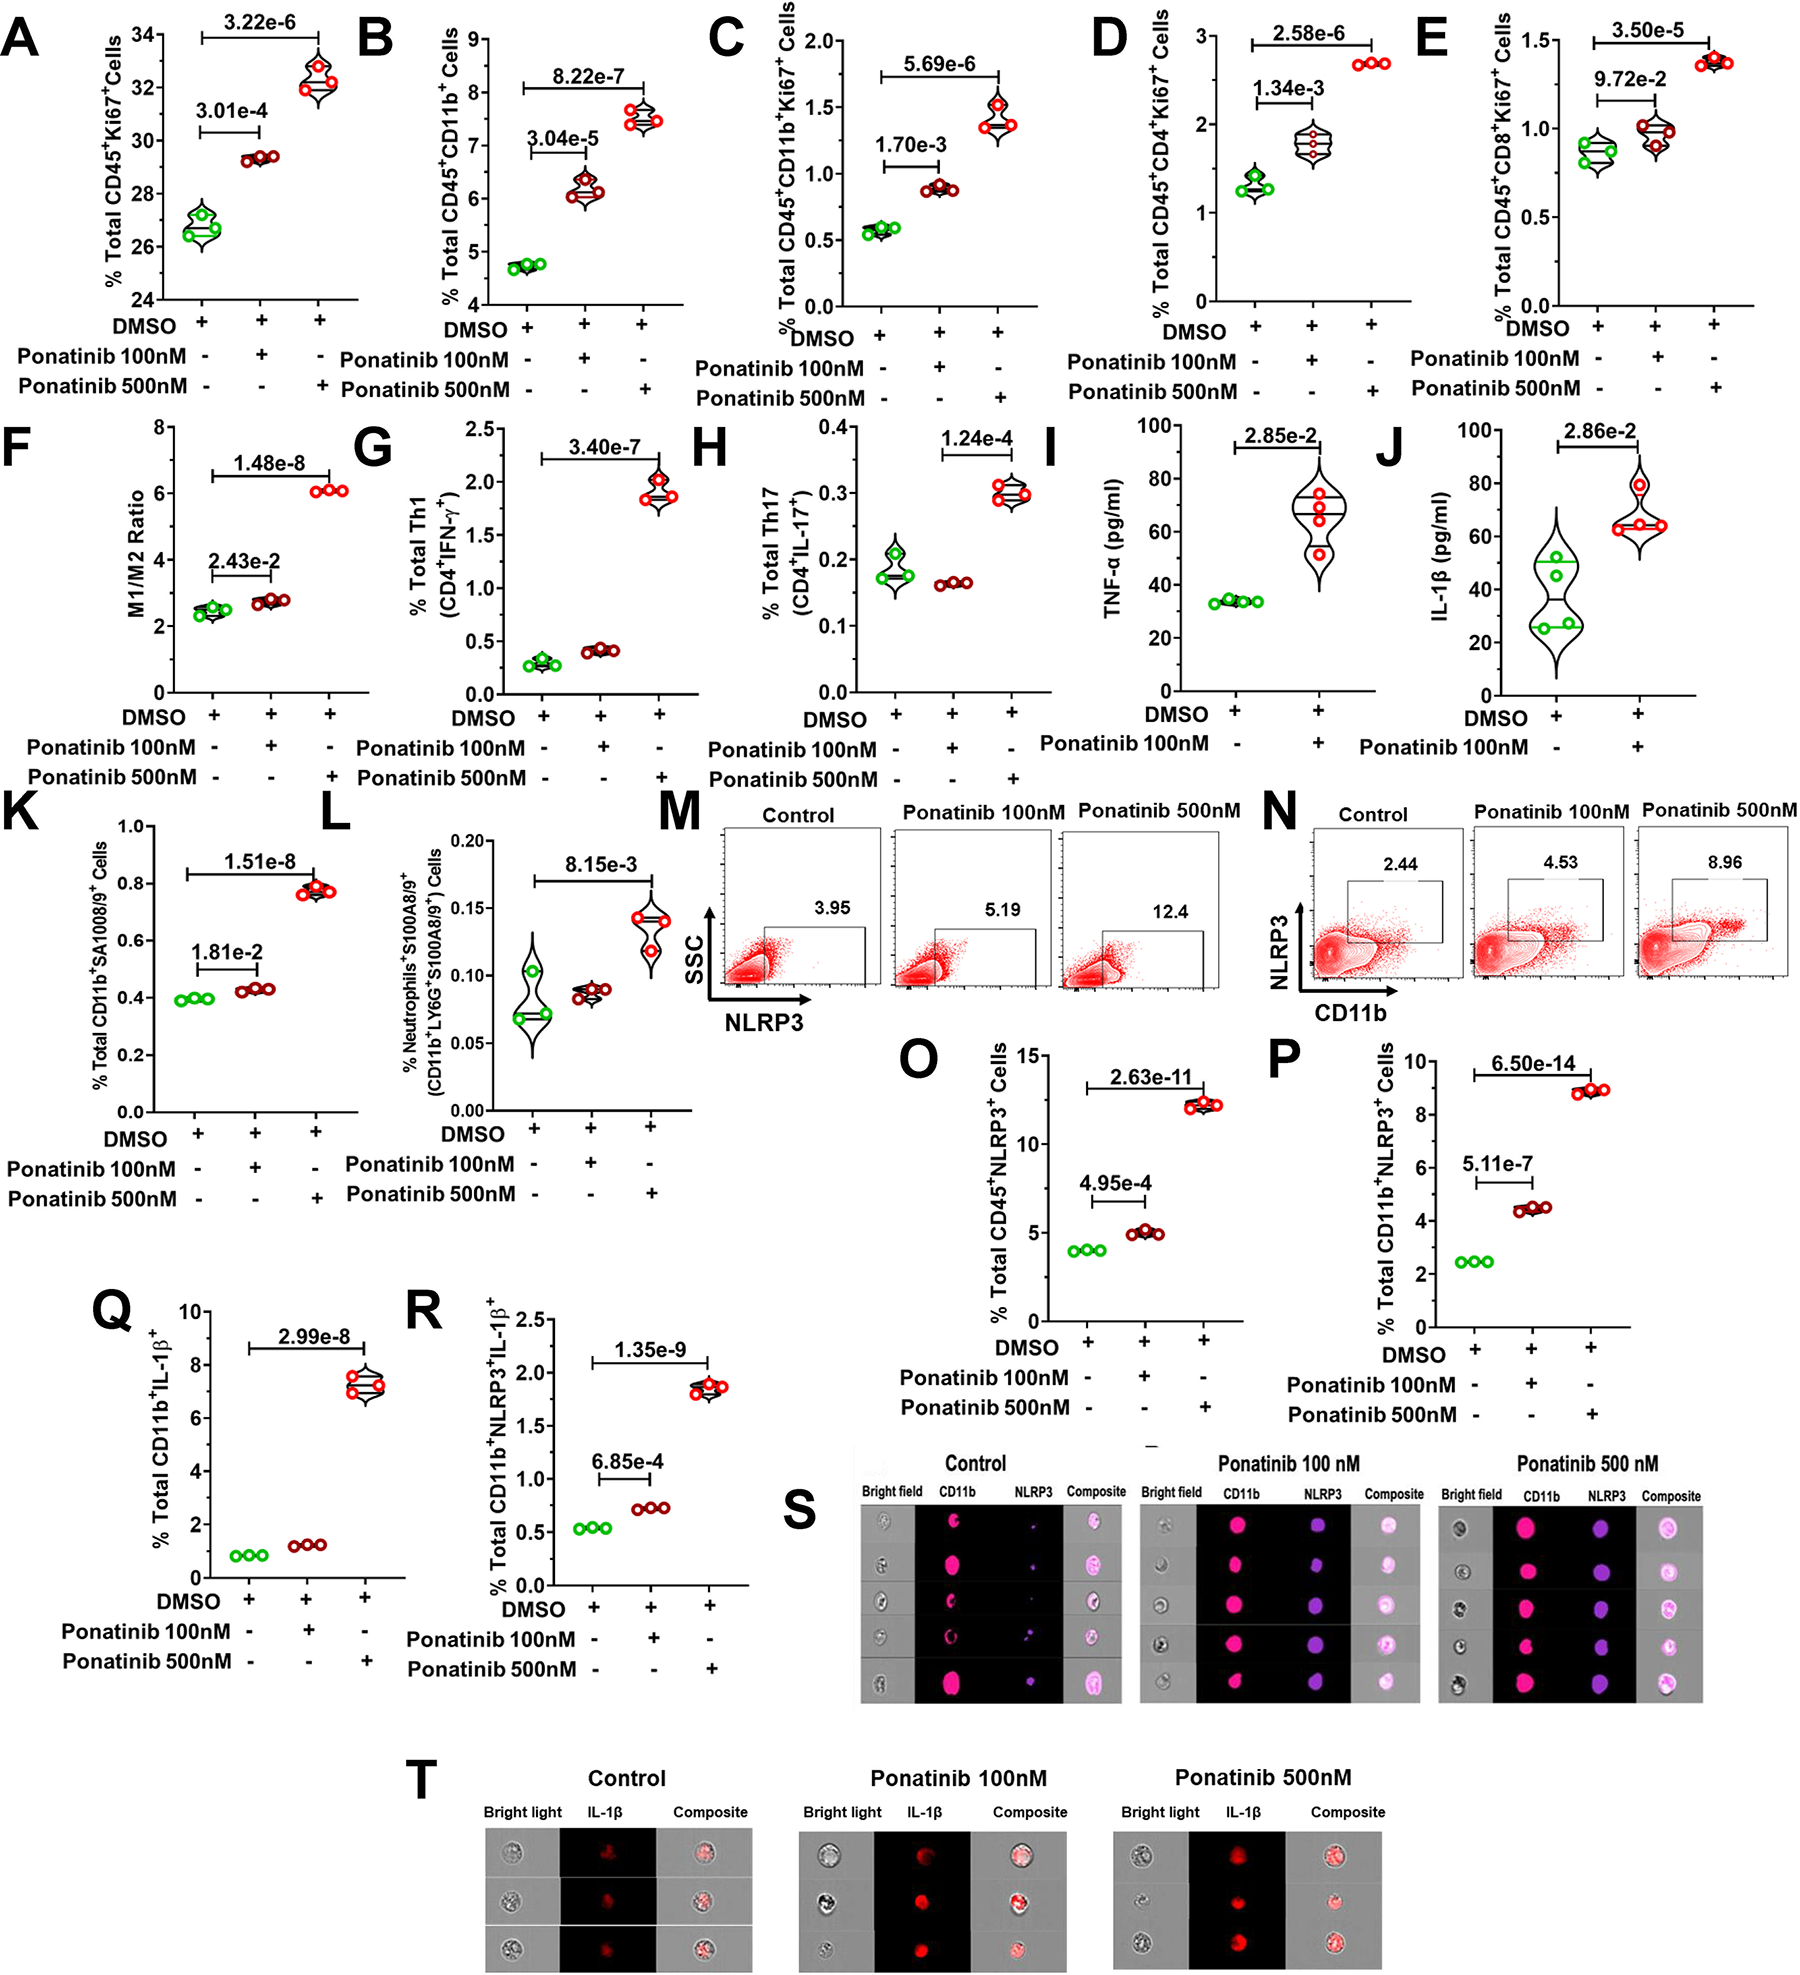
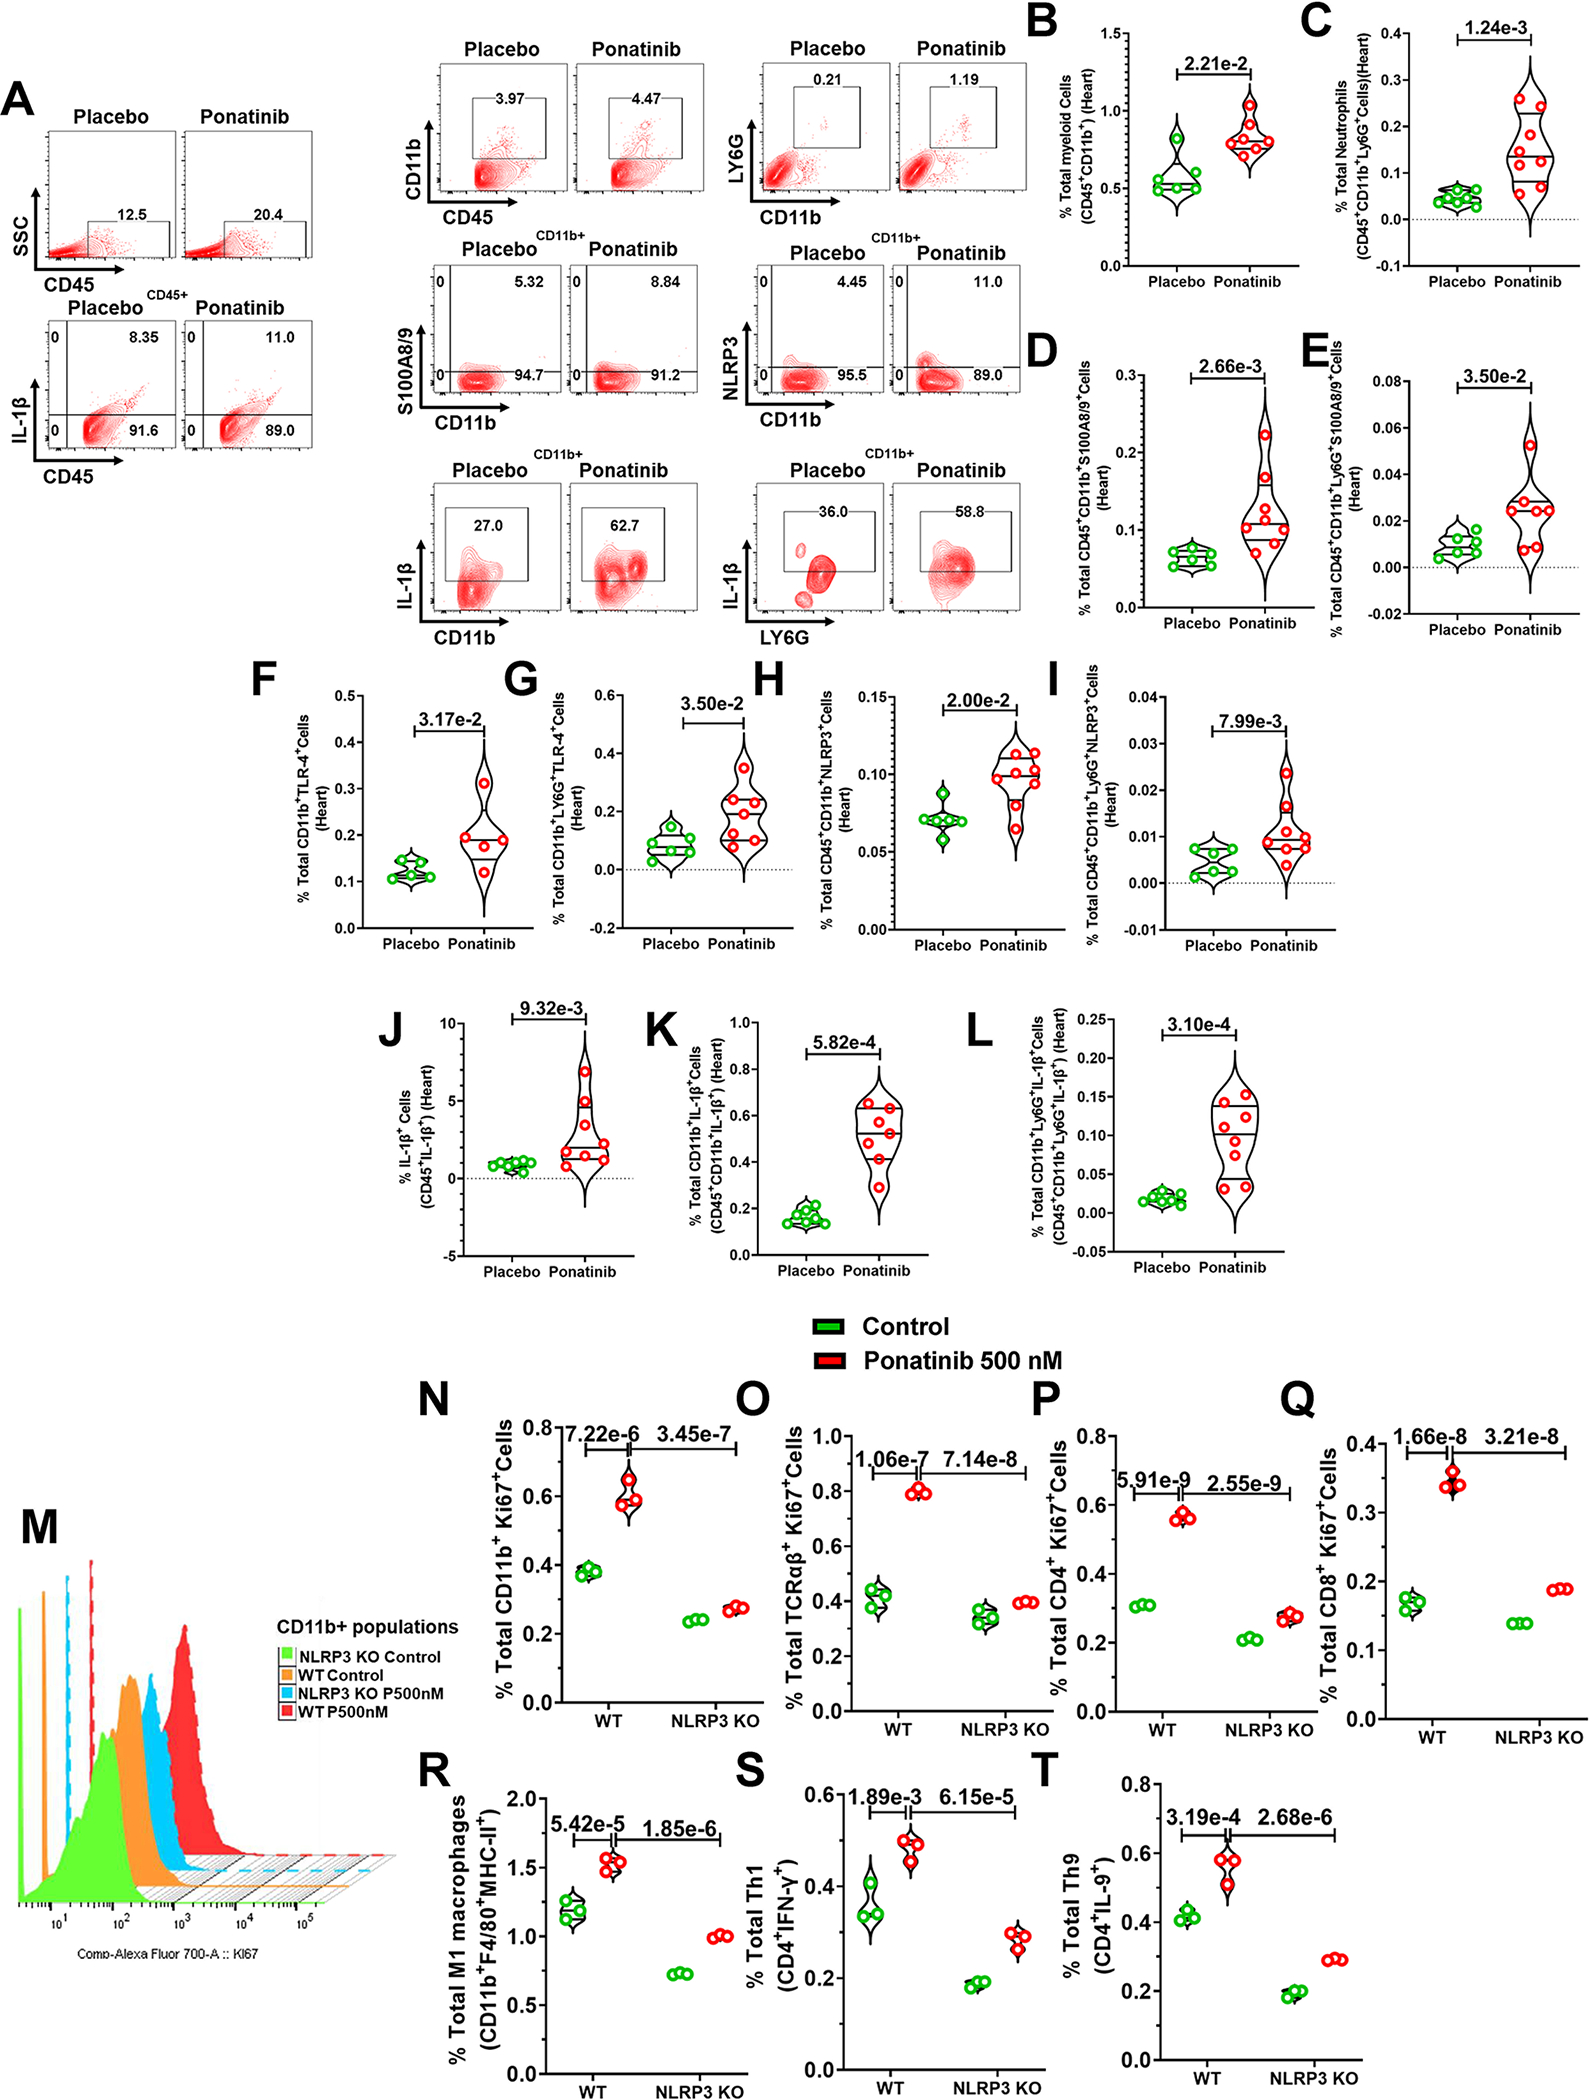
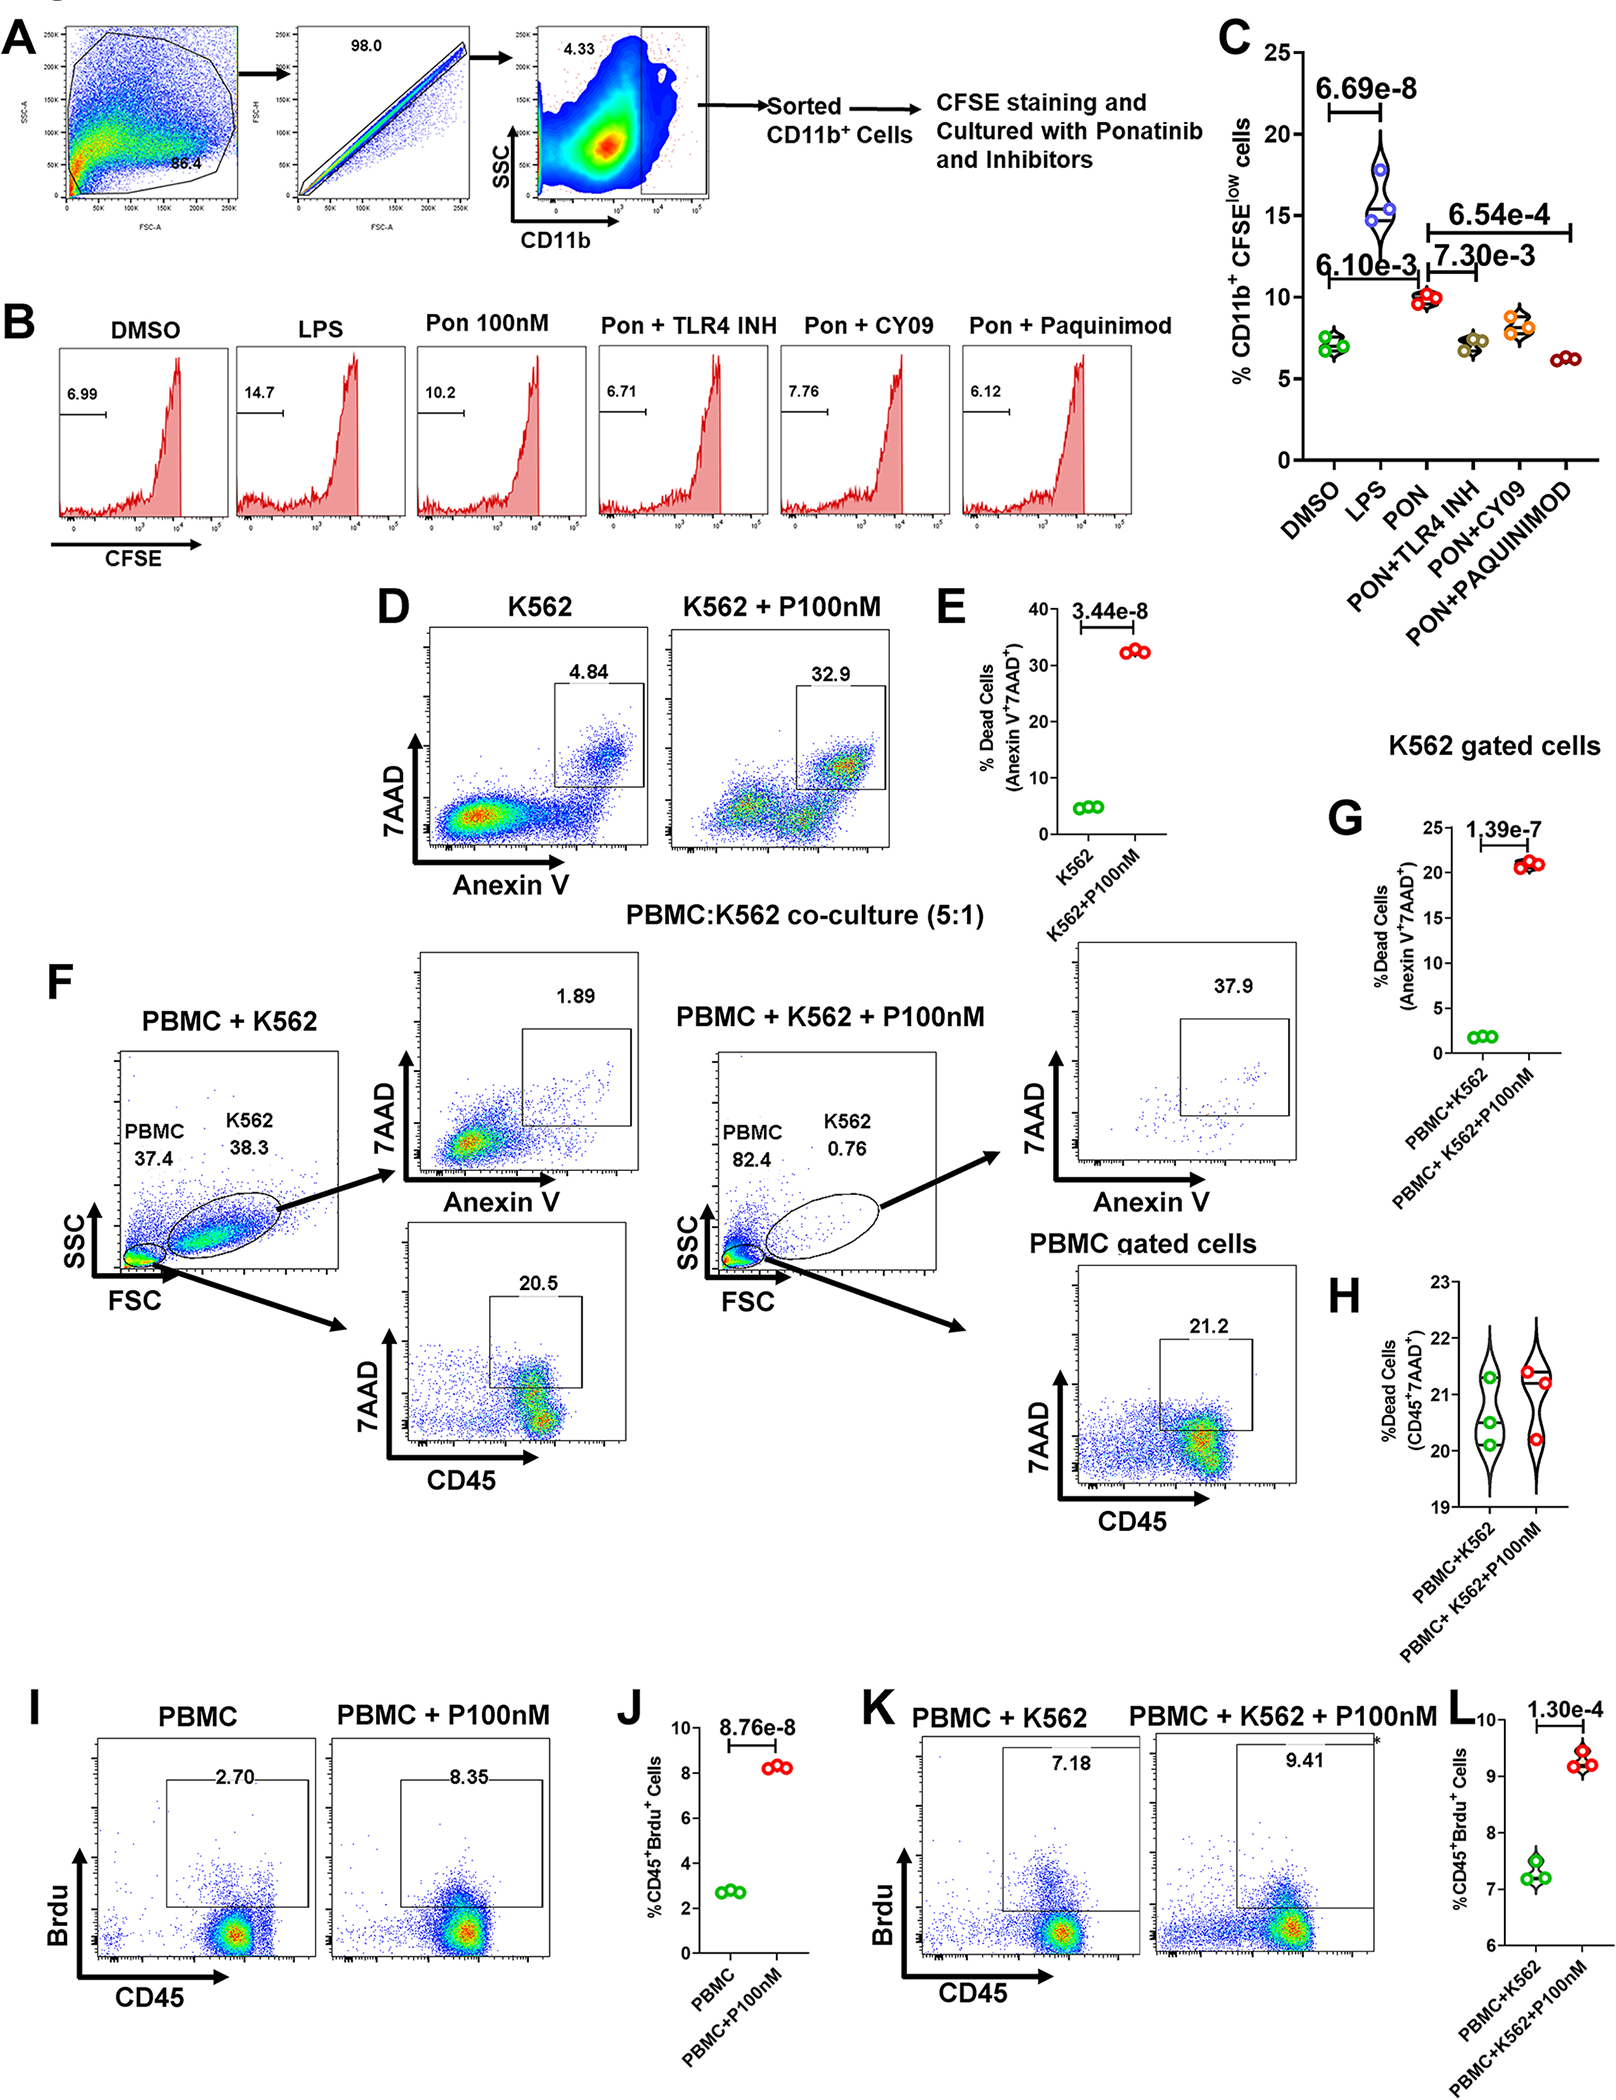
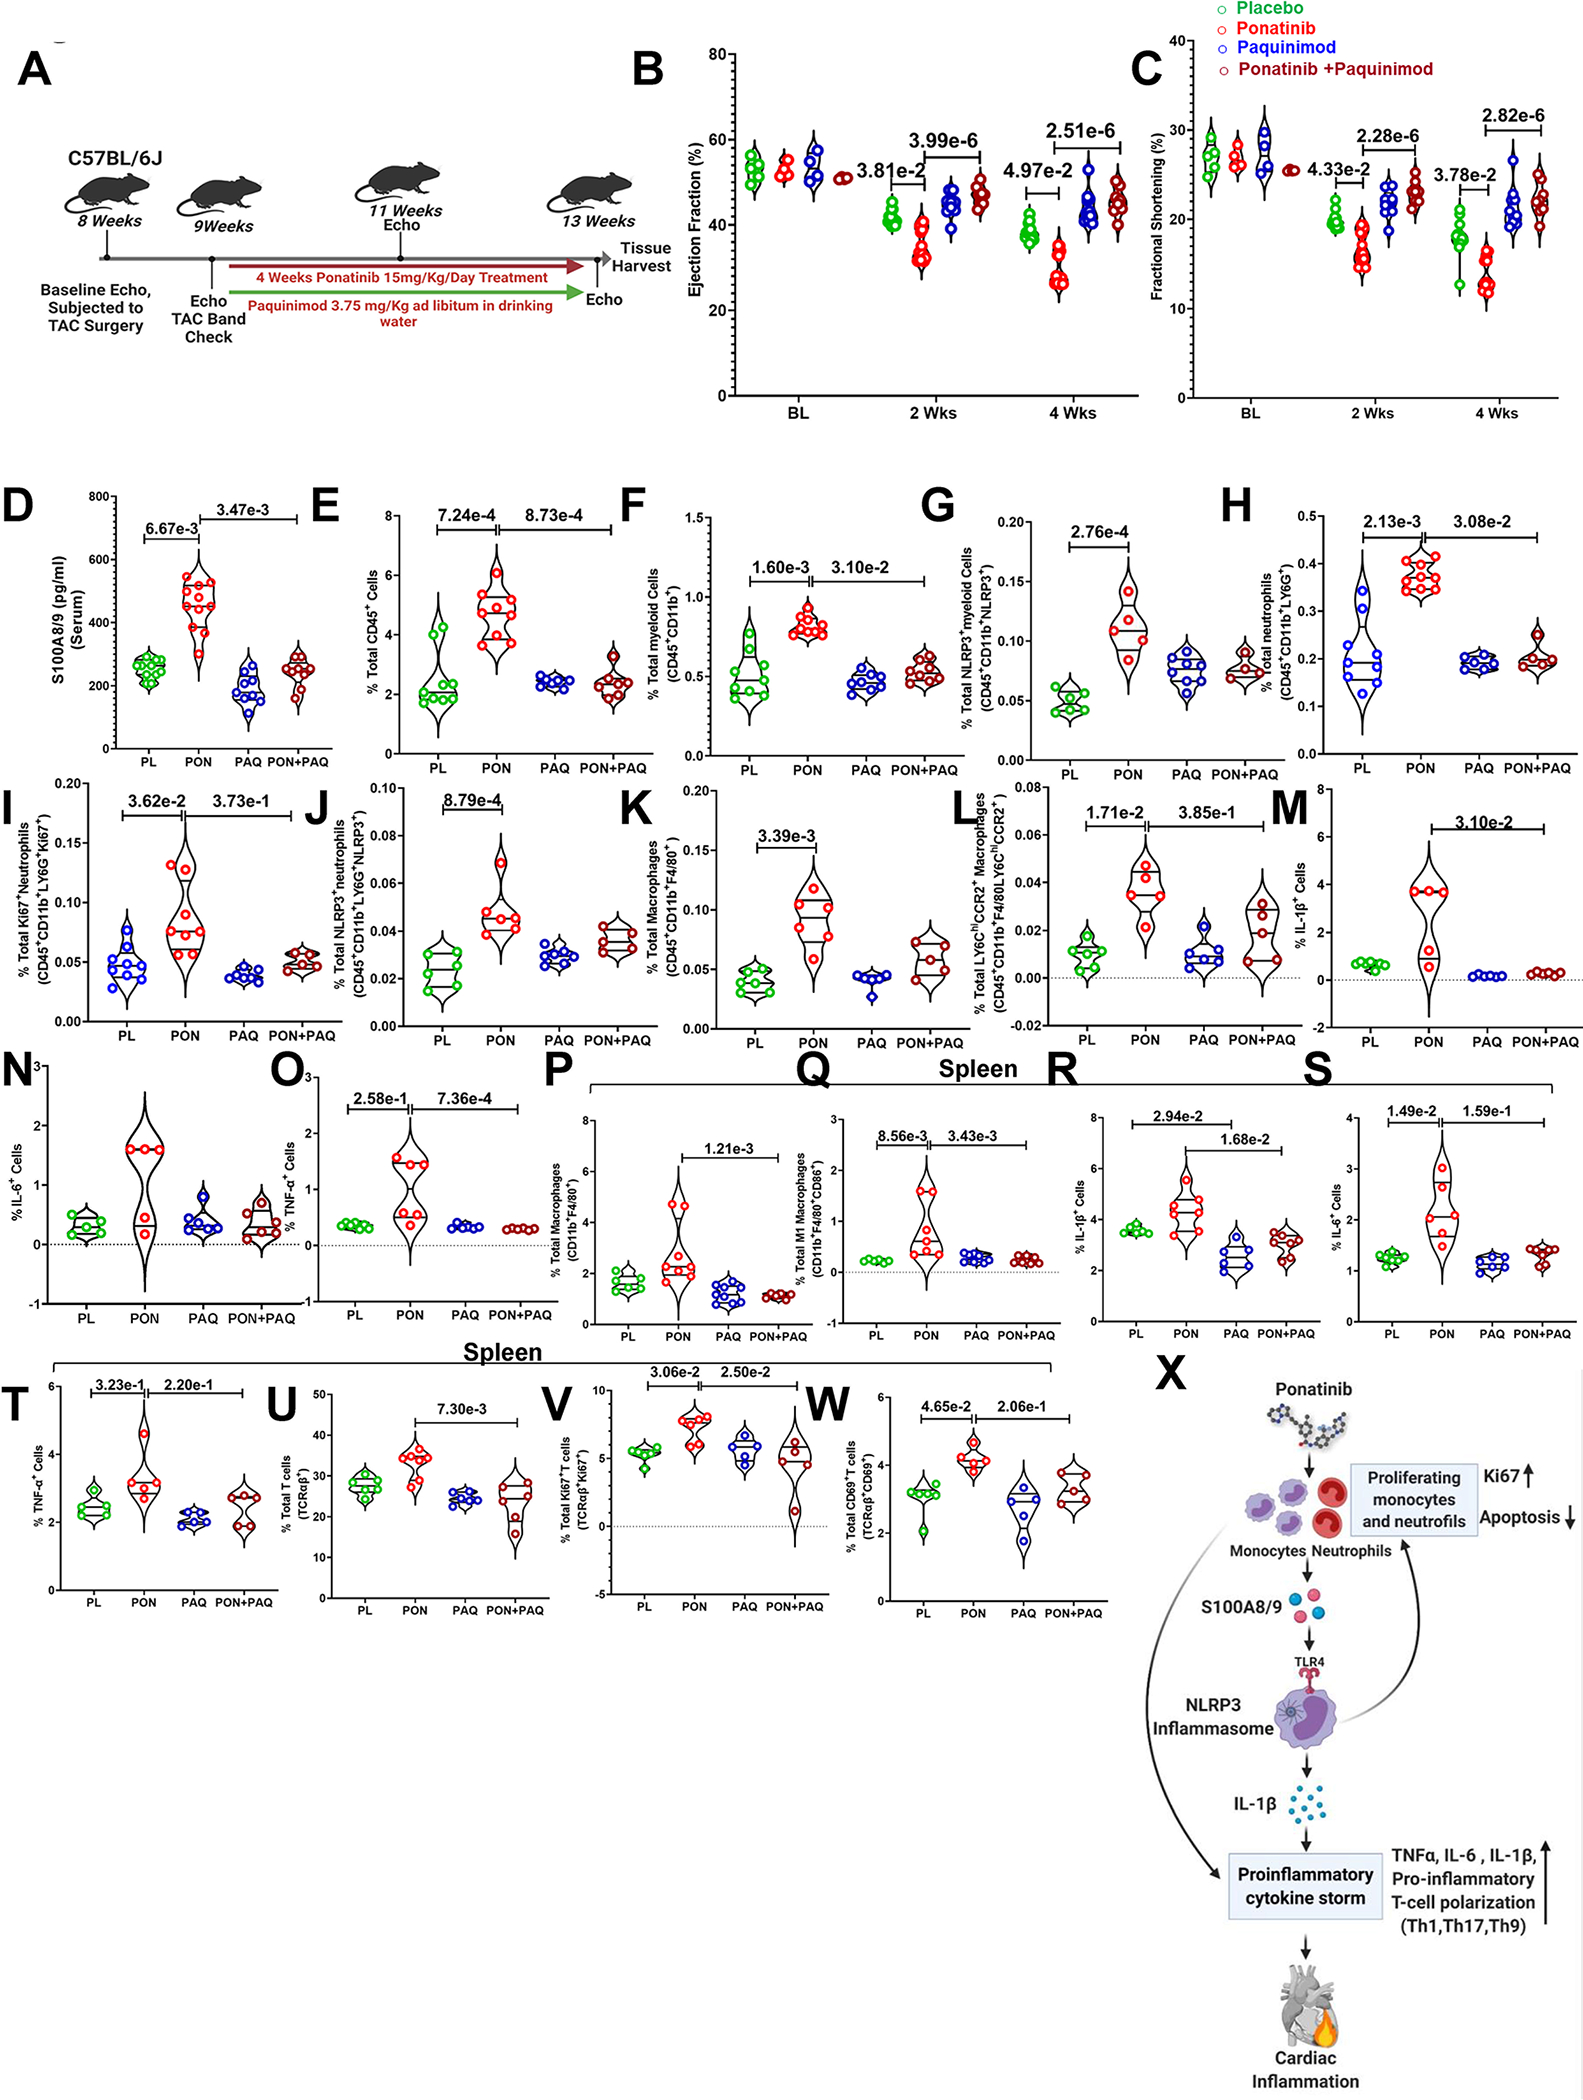
Results: An unbiased RNA sequencing analysis identified the enrichment of dysregulated inflammatory genes, including a multifold upregulation of alarmins S100A8/A9, as a top hit in ponatinib-treated hearts. Mechanistically, we demonstrate that ponatinib activates the S100A8/A9-TLR4 (Toll-like receptor 4)-NLRP3 (NLR family pyrin domain-containing 3)-IL (interleukin)-1β signaling pathway in cardiac and systemic myeloid cells, in vitro and in vivo, thereby leading to excessive myocardial and systemic inflammation. Excessive inflammation was central to the cardiac pathology because interventions with broad-spectrum immunosuppressive glucocorticoid dexamethasone or specific inhibitors of NLRP3 (CY-09) or S100A9 (paquinimod) nearly abolished the ponatinib-induced cardiac dysfunction.

Conclusions: Taken together, these findings uncover a novel mechanism of ponatinib-induced cardiac inflammation leading to cardiac dysfunction. From a translational perspective, our results provide critical preclinical data and rationale for a clinical investigation into immunosuppressive interventions for managing ponatinib-induced cardiotoxicity.

Keywords: cardiotoxicity; heart failure; inflammation; paquinimod; ponatinib.


Figures

Fig. 1|
Fig. 1|. Ponatinib induces cardiac dysfunction in High Fat Diet (HFD) fed ApoE−/− by promoting myeloid and T cell frequency.
(A) An experimental scheme using 8-week-old male and female C57Bl/6J mice subjected to ponatinib treatment (15 mg/Kg/day) for 4 weeks. (B-C) Ejection Fraction and Fractional Shortening as measured by echocardiography at 2, 4, and 6 weeks. No statistically significant difference was observed in the control and ponatinib-treated group, as measured by the Mann-Whitney U test for each time point and represented as mean±SEM. Basal (BL) (N=10), placebo, and ponatinib (N=5) at 2 weeks, 4 weeks, and 6 weeks. (D) Schematic of experiment performed in which 8-week-old male and female ApoE−/− mice were subjected to high-fat diet (HFD). Chow Diet (CD) animals were used as control. After 8 weeks on HFD, mice were given ponatinib treatment (15mg/Kg/day) for 2 weeks. (E-F) Representative images of echocardiographic measurements in HFD groups. (G-J) Ejection Fraction, Fractional Shortening, Left ventricle volume in systolic (LV Lol;s), and Left ventricle internal diameter in systolic (LVID;s) were measured by echocardiography. Significance was determined by using Kruskal-Wallis followed by Dunn test and represented as mean±SEM CD placebo (N= 9); CD ponatinib, HFD placebo, and HFD ponatinib (N= 12). (K) RNA sequencing (RNA-Seq) analysis of LV samples from HFD placebo and HFD ponatinib groups was performed at 2 weeks after ponatinib treatment by taking LV samples from HFD placebo and HFD ponatinib groups. N=5 per group. The hierarchical clustering of 544 genes was detected as a notably differential between the HFD placebo and HFD ponatinib groups. (L) Dot enrichment plot. (M) Volcano plot of differentially expressed genes. (N) ELISA for quantitative measurement of S100A8/9 from the serum sample of ponatinib treated HFD- fed ApoE−/− mice, placebo (PL) (N=10), and ponatinib (PON) (N=9). (O-U) Quantitation of immune cells as a percentage of total cells (immune and nonimmune) isolated from the digested heart of HFD placebo and HFD ponatinib groups. (O) total percentage of myeloid cells per heart (CD11b+F4/80), placebo (N=4) and ponatinib (N=6), (P) total percentage of macrophages (CD11b+F4/80+), placebo (N=5) and ponatinib (N=7), (Q) total percentage of residential macrophages (CD11b+F4/80+MERTK+), placebo (N=5) and ponatinib (N=5), (R) total pro-inflammatory monocytes (CD11b+F4/80LY6C+CCR2+), placebo (N=5) and ponatinib (N=6), (S) total pro-inflammatory macrophages (CD11b+F4/80+LY6C+CCR2+), placebo (N=5) and ponatinib (N=7), (T) total neutrophils (CD11b+LY6G+), placebo (N=6) and ponatinib (N=6), (U) percentage of IL-6 producing leukocytes (CD45+IL-6+), placebo (N=5) and ponatinib (N=6), Data (O-U) were analyzed using the Mann-Whitney U test and represented as mean±SEM.
Fig. 2|
Fig. 2|. Ponatinib promotes inflammation in naïve wild type C57BL/6J.
Eight-week-old male and female C57Bl/6J mice were subjected to ponatinib treatment (15 mg/Kg/day) for 2 weeks. After treatment, the whole heart of placebo and ponatinib-treated mice were digested to prepare a single-cell suspension. Cells were then stained with antibodies (CD45, CD11b, F4/80, LY6C, CCR2, LY6G, and IL-17), and flow cytometry was performed. Total percentages of (A) CD45+CD11b+F4/80 myeloid cells, placebo and ponatinib (N=6), (B) CD45+CD11b+F4/80+ macrophages, placebo and ponatinib (N=6), (C) CD45+CD11b+F4/80LY6C+CCR2+ cells as pro-inflammatory monocytes, placebo and ponatinib (N=6), (D) CD45+CD11b+F4/80+LY6C+CCR2+ cells as pro-inflammatory macrophages, placebo and ponatinib (N=6), (E) CD45+CD11C+ dendritic cells, placebo and ponatinib (N=7), (F) CD45+CD11b+ LY6G+ neutrophils, placebo and ponatinib (N=6), and (G) CD4+IL-17+ Th17 cells, placebo (N=4) and ponatinib (N=5). (H-J) Spleen of placebo and ponatinib treated naïve C57BL/6 wild-type mice were macerated to prepare a single-cell suspension. Cells were then stained with antibodies (CD11b, F4/80, MHC-II, and LY6G) and flow cytometry was performed. Total percentages of (H) CD11b+F4/80+ macrophages, placebo and ponatinib (N=6), (I) CD11b+F4/80+MHC-II+ cells as M1 macrophages, and, placebo and ponatinib (N=6), (J) CD11b+ LY6G+ neutrophils cells, placebo and ponatinib (N=6). (K) Representative figure of flow cytometry showing gating strategy to measure total T cells, CD4+ and CD8+ T cells in the spleen of ponatinib treated and placebo mice post 2 weeks treatment. We analyzed the total percentage of (L) TCRαβ+ T cells, placebo and ponatinib (N=7), (M) TCRαβ+ CD4+ T cells, placebo (N=6) and ponatinib (N=7), (N) TCRαβ+ CD8+ T cells, placebo and ponatinib (N=7),(O) CD4+IFN-γ+ Th1 cells, placebo (N=5) and ponatinib (N=7), (P) CD4+IL-17+ Th17 cells, placebo (N=5) and ponatinib (N=8), and (Q) CD4+IL-9+ Th9 cells, placebo (N=6) and ponatinib (N=7). Data (A-Q) were analyzed using the Mann-Whitney U test and represented as mean±SEM.
Fig. 3|
Fig. 3|. Ponatinib-induced inflammation promotes cardiac dysfunction in pressure overload WT mice.
(A) Schematic outline of the experiment performed. Eight-week-old male and female C57Bl/6J mice were subjected to TAC surgery followed by ponatinib treatment (15 mg/Kg/day) for 4 weeks. (B-C) Ejection Fraction and Fractional Shortening and Left ventricle internal diameter in systolic (LVID; s) as measured by echocardiography at 2 and 4 weeks, basal (BL) (N=11); At 2 and 4 weeks, sham placebo (N=4), sham ponatinib (N=5), TAC placebo (N=6), and TAC ponatinib (N=9); At 4 weeks, sham placebo (N=4), sham ponatinib (N=5), TAC placebo (N=6), and TAC ponatinib (N=9). (D) Left ventricle internal diameter in systolic (LVID; s), Basal (BL) (N=6), At 2 weeks, sham placebo (N=4), sham ponatinib (N=5), TAC placebo (N=7), and TAC ponatinib (N=10); At 4 weeks, sham placebo (N=4), sham ponatinib (N=5), TAC placebo (N=6), and TAC ponatinib (N=10). Significance was compared between TAC Placebo vs TAC Ponatinib for 2 weeks and 4 weeks separately by using the Mann-Whitney U test and represented as mean±SEM. (E) CD45-positive leukocytes and (F) CD3-positive T cells in the heart of ponatinib-treated TAC mice and control. A black arrow in the inset image indicates a positive cell. The scale bar indicates 50 μm. (G-R) Quantitation of immune cells as a percentage of total cells isolated from the heart of TAC-placebo and TAC-ponatinib groups. Data represents quantitation of percent of (G) total leukocytes (CD45+), placebo and ponatinib (N=10),(H) total proliferative leukocytes (CD45+Ki67+), placebo and ponatinib (N=5), (I) total myeloid (CD45+CD11b+F4/80), placebo (N=5) and ponatinib (N=6), (J) total macrophages (CD11b+F4/80+), placebo (N=5) and ponatinib (N=6), (K) total residential macrophages (CD11b+F4/80+MERTK+), placebo (N=4) and ponatinib (N=5), (L) total M1 macrophages (CD11b+F4/80+MHC-II+), placebo and ponatinib (N=4), (M) total dendritic cells (CD45+CD11C+), placebo and ponatinib (N=5),(N) total neutrophils (CD11b+LY6G+), placebo and ponatinib (N=5), (O) total CXCL9 producing leukocytes (CD45+CXCL9+), placebo and ponatinib (N=5), (P) total TNF-α producing cells (CD45+TNF-α+), placebo and ponatinib (N=5),(Q), total IL-6 producing cells (CD45+IL-6+), placebo and ponatinib (N=5), (R) total IL-1β producing cells (CD45+IL-1β+), placebo and ponatinib (N=5). ELISA was performed from the serum obtained from the TAC Placebo and TAC Ponatinib animals after 4 weeks of ponatinib treatment. Data showing serum levels of (S) TNF-α, placebo and ponatinib (N=9), (T) IL-1β, placebo and ponatinib (N=11) (U) IL-6, placebo and ponatinib (N=11). Data (G-U) were analyzed using the Mann-Whitney U test and represented as mean±SEM.
Fig. 4|
Fig. 4|. Ponatinib promotes inflammation through the NLRP3 pathway.
Whole splenocytes of 8-week-old C57BL/6J mice, disaggregated and seeded with vehicle control (DMSO) and ponatinib (100 nM and 500 nM, 72h), and flow cytometry was performed. (A) Increased proliferation of leukocytes (CD45+Ki67+). (B) total % of myeloid cells (CD45+CD11b+) and proliferation (C) (CD45+CD11b+Ki67+). Increased frequency of (D) CD4+ T cell proliferation (CD45+CD4+Ki67+), (E) CD8+ T cell proliferation (CD45+CD8+Ki67+), (F) M1/M2 ratio, (G) total Th1 cells (CD4+IFN-γ+), and (H) Th17 cells (CD4+IL-17+). ELISA was performed for in vitro assessment of the concentration of (I) TNF-α and (J) IL-1β in media supernatant of ponatinib-treated splenocytes. (K) Total percentage of S100A8/9 producing myeloid (CD11b+S100A8/9+). (L) Total percentage of S100A8/9 producing neutrophils (CD11b+LY6G+S100A8/9+). (M, N) Flow cytometry analysis of NLRP3+ cells in ponatinib-treated splenocytes. The total percentage of (O) CD45+NLRP3+cells (P) CD11b+NLRP3+ cells (Q) IL-1β producing CD11B+ cells (CD11b+IL-1β+) and (R) NLRP3 expressing myeloid secreting IL-1β (CD11b+NLRP3+IL-1β+). Experiments repeated 3 times (N= 3). Experiment was repeated three times (N= 3), and Data (A-L, O-R) were analyzed by using ordinary one way ANOVA followed by Tukey’s multiple comparisions test and represented as mean±SEM. (S, T) Splenocytes were obtained from mouse and treated with ponatinib for 72 hours. Cells were then stained with antibodies (CD11b, NLRP3 and IL-1β) and ImageStream analysis was performed. Representative ImageStream pictures of single cell staining showing ponatinib treatment upregulate NLRP3 expression in, (S) CD11b+ myeloid cells, and (T) IL-1β producing cells.
Fig. 5|
Fig. 5|. Ponatinib activates the formation of NLRP3 inflammasome.
(A-L) Eight-week-old male and female C57Bl/6J mice were subjected to TAC surgery followed by ponatinib treatment (15 mg/Kg/day) for 4 weeks. Immune cells were isolated from the heart of TAC-placebo and TAC-ponatinib animal groups by enzymatic digestion after ponatinib treatment for 4 weeks. Next, cells were stained, and flow cytometry was performed. (A) Representative figure of flow cytometry showing gating strategy to measure IL-1β, CD11b, S100A8/9, and NLRP3 expressing immune cells. Data represents quantitation of percent of (B) total myeloid cells (CD45+CD11b+-), placebo (N=6) and ponatinib (N=7), (C) total neutrophils (CD45+CD11b+LY6G+), placebo (N=7) and ponatinib (N=8), (D) total S100A8/9 producing myeloid cells (CD45+CD11b+S100A8/9+), placebo (N=6) and ponatinib (N=8),(E) total S100A8/9 producing neutrophils (CD45+CD11b+LY6G+S100A8/9+), placebo (N=6) and ponatinib (N=7), (F) total TLR-4 expressing myeloid cells (CD11b+TLR-4+), placebo and ponatinib (N=5), (G) total TLR-4 expressing neutrophils (CD11b+LY6G+TLR-4+), placebo (N=6) and ponatinib (N=7), (H) total NLRP3+ myeloid cells (CD45+CD11b+NLRP3+),(I) total NLRP3+ neutrophils (CD45+CD11b+LY6G+NLRP3+), placebo (N=6) and ponatinib (N=8), (J) total IL-1β producing leukocytes (CD45+IL-1β+), placebo (N=6) and ponatinib (N=8), (K) total IL-1β producing myeloid cells (CD45+CD11b+IL-1β+), placebo and ponatinib (N=7), (L) total IL-1β producing neutrophils (CD45+CD11b+LY6G+IL-1β+), placebo (N=7) and ponatinib (N=8). Data (B-L) were analyzed using the Mann-Whitney U test and represented as mean±SEM. (M-T) Immune cells from NLRP3 KOs are resistant to ponatinib-induced proliferation. Splenocytes from NLRP3 KO and WT mice were treated with control (DMSO) and ponatinib (500 nM, 72hrs). Flow cytometry analyzed for the proliferation of myeloid cells and T cells with the staining of Ki67. (M) Staggered overlay diagram showing reduced proliferation in KO myeloid cells with ponatinib treatment. (N) Diminished ex vivo proliferation of CD11b+ myeloid cells in KO compared to WT. (O) Diminished ex vivo proliferation of TCRαβ+ T cell in KO compared to WT. (P) Diminished ex vivo proliferation of CD4+ T cell in KO compared to WT. (Q) Diminished ex vivo proliferation of CD8+ T cell in KO compared to WT. Decreased frequency of total (R) M1 macrophages, (S) Th1 cells, and (T) Th9 cells KO compared to WT. Experiment was repeated three times (N= 3). Data were analyzed by using ordinary two way ANOVA followed by Sidak’s multiple comparision test and represented as mean±SEM.
Fig. 6|
Fig. 6|. Ponatinib-induced myeloid cell proliferation is S100A8/9, TLR-4, and NLRP3 dependent, while Ponatinib concurrently activates human PBMCs with anticancer efficacy.
(A) Gating strategy for sorting CD11b+ cells from mouse splenocytes. (B) CFSE stained CD11b+ cells were cultured and treated with combination of antagonists and ponatinib for 72 hours (DMSO as control, LPS, Ponatinib 100nM, Ponatinib 100nM+ TLR4 inhibitor, Ponatinib 100nM+ CY09, Ponatinib 100nM+ Paquinimod). Histograms representing the percentage of diluted CFSE-stained CD11b+ cells. (C) Quantification of CD11b+ proliferation (percentage of CFSE low CD11b+ cells). Experiment was repeated three times (N= 3). Data were analyzed by using ordinary one way ANOVA followed by Tukey’s multiple comparisions test and represented as mean±SEM. (D) Human CML cells K562 were treated with ponatinib (100nM) for 72 hours. Next, cells were stained with Annexin V and 7AAD, and flow cytometry was performed. (E) Violin plot showing the percentage of dead K562 cells after ponatinib treatment. (F) Human K562 CML cells and PBMCs were co-cultured (1:5) and treated with ponatinib. Representative flow cytometry figures show gating strategy to measure dead cells in co-culture. (G-H) Data represents the quantitation of the percent of K562 dead cells and PBMCs. (I) Human PBMCs were treated with ponatinib (100nM) for 72 hours and BrdU was incorporated to culture 24 hours prior to flow cytometry analysis. (J) Violin plot shows the percent of proliferating immune cells (CD45+Brdu+). (K-L) Data represents a proliferation of immune cells in co-culture of human PBMCs and K562 cells post ponatinib treatment (100nM, 72 hours). Experiment was repeated three times (N= 3). Data (E, G, H, J, and L) were analyzed using the unpaired t test and represented as mean±SEM.
Fig. 7|
Fig. 7|. Dexamethasone and direct NLRP3 inflammasome inhibitor CY-09 rescued ponatinib-induced cardiotoxicities by suppressing excessive inflammation
(A) Schematic outline of experiments performed in this figure. Eight-week-old C57BL6 wild-type (WT) mice were subjected to TAC surgery followed by ponatinib treatment (15 mg/Kg/day) after 1 week. Mice were given dexamethasone (2 mg/Kg i.p.) three times a week and concurrently ponatinib for four weeks. Only TAC groups have been taken for this study. (BC) Ejection Fraction and Fractional Shortening as measured by echocardiography at 2 and 4 weeks. (B) Ejection Fraction, Basal (BL) (N=14); At 2 weeks, placebo (N=7), ponatinib (N=11), placebo Dex (N=14), and ponatinib+ Dex (N=13); At 4 weeks, placebo (N=8), ponatinib (N=7), placebo Dex (N=14) and ponatinib+ Dex (N=7) (C) Fractional Shortening, Basal (BL) (N=12); At 2 weeks, placebo (N=7), ponatinib (N=13), placebo Dex (N=14) and ponatinib+ Dex (N=13); At 4 weeks, placebo (N=8), ponatinib (N=7), placebo Dex (N=14) and ponatinib+ Dex (N=7). Significance was compared between TAC placebo vs TAC ponatinib and TAC ponatinib vs TAC ponatinib + Dex for 2 weeks and 4 weeks separately by using Kruskal-Wallis followed by Dunn test and represented as mean±SEM. (D) Experimental overview. Eight-week-old C57BL6 wild-type (WT) mice were subjected to TAC surgery. After 1 week, mice were given CY-09 (2 mg/Kg i.p.) six times a week and concurrently ponatinib for four weeks (15 mg/Kg/day). Only TAC groups have been taken for this study. (E-F) Ejection Fraction and Fractional Shortening as measured by echocardiography at 2 and 4 weeks. Basal (BL) (N=7); At 2 weeks, placebo (N=10), ponatinib (N=7) and ponatinib+CY09 (N=8); At 4 weeks, placebo (N=10), ponatinib (N=7), and ponatinib+CY09 (N=9). Significance was compared between TAC placebo vs TAC ponatinib and TAC ponatinib vs TAC ponatinib + CY09 for 2 weeks and 4 weeks separately by using Kruskal-Wallis followed by Dunn test and represented as mean±SEM. (G-I) Quantitation of immune cells as a percentage of total cells isolated from the heart of animal groups mentioned in the figures. Data represents quantitation of percent of the total (G) TNF-α producing leukocytes (CD45+TNF-α+); placebo (N=7), ponatinib (N=6), and ponatinib+CY09 (N=5), (H) IL-1β producing leukocytes (CD45+IL-1β+); placebo (N=7), ponatinib (N=6), and ponatinib+CY09 (N=5), (I) IL-6 producing leukocytes (CD4+IL6+); placebo (N=7), ponatinib (N=6), and ponatinib+CY09 (N=6). (J-M) ELISA was performed from the serum obtained from animal groups. Data showing serum levels of (J) TNF-α; placebo (N=7), ponatinib (N=6), ponatinib + Dex (N=6) and ponatinib+CY09 (N=7), (K) IL-1β; placebo (N=8), ponatinib (N=5), ponatinib + Dex (N=7) and ponatinib+CY09 (N=6),(L) IL-6; placebo (N=7), ponatinib (N=6), ponatinib + Dex (N=8) and ponatinib+CY09 (N=6), (M) S100A8/9; placebo (N=7), ponatinib (N=6), ponatinib + Dex (N=11) and ponatinib+CY09 (N=7). (N-R) Quantitation of immune cells as a percentage of total cells isolated from spleen of animal groups mentioned in the figures. Data represents % total of (N) myeloid cells (CD11b+); placebo (N=10), ponatinib (N=6), and ponatinib+CY09 (N=6), (O) proliferating myeloid cells (CD11b+Brdu+); placebo (N=9), ponatinib (N=6), and ponatinib+CY09 (N=7), (P) Flow cytometry plots representing neutrophil populations in spleen and a total percentage of (Q) neutrophils (CD11b+LY6G+); placebo (N=8), ponatinib (N=5), and ponatinib+CY09 (N=7), and (R) proliferating neutrophils (CD11b+LY6G+Brdu+); placebo (N=10), ponatinib (N=6), and ponatinib+CY09 (N=7). Data (G-I) and (Q-R) were analyzed by using Kruskal-Wallis followed by Dunn test and represented as mean±SEM.
Fig. 8|
Fig. 8|. Inhibition of S100A8/9 is critical to protect against ponatinib-induced cardiotoxicity.
(A) Experimental overview. Eight-week-old C57BL6 wild-type (WT) mice were subjected to TAC surgery. After 1 week, mice were given paquinimod (3.75 mg/Kg weight ad libitum in drinking water) and concurrently ponatinib for four weeks (15 mg/Kg/day). Only TAC groups have been taken for this study. (B-C) Ejection Fraction and Fractional Shortening as measured by echocardiography at 2 and 4 weeks. (B) Ejection Fraction - At Base line (BL), placebo (N=5), ponatinib (N=4), paquinimod (N=4) and ponatinib+ paquinimod (N=4); At 2 weeks, placebo (N=13), ponatinib (N=12), paquinimod (N=9) and ponatinib+ paquinimod (N=8); At 4 weeks, placebo (N=13), ponatinib (N=12), paquinimod (N=10) and ponatinib+ paquinimod (N=8). (C) Fractional Shortening; At Basal (BL), placebo (N=5), ponatinib (N=4), paquinimod (N=4) and ponatinib+ paquinimod (N=4); At 2 weeks, placebo (N=13), ponatinib (N=13), paquinimod (N=9) and ponatinib+ paquinimod (N=8); At 4 weeks, placebo (N=13), ponatinib (N=12), paquinimod (N=10) and ponatinib+ paquinimod (N=8). Significance was compared between TAC placebo vs TAC ponatinib and TAC ponatinib vs TAC ponatinib + paquinimod for 2 weeks and 4 weeks separately by using Kruskal-Wallis followed by Dunn test and represented as mean±SEM. (D) Data showing the concentration of S100A8/9 in serum placebo (N=5), ponatinib (N=4), paquinimod (N=4), and ponatinib + paquinimod (N=4) placebo (N=11), ponatinib (N=11), paquinimod (N=9), and ponatinib + paquinimod (N=9). (E-O) The figures mention quantitation of immune cells as a percentage of total cells isolated from the heart of animal groups. Data represents % total of (E) total leukocytes (CD45+); placebo (N=9), ponatinib (N=9), paquinimod (N=7), and ponatinib + paquinimod (N=7), (F) total myeloid cells (CD45+CD11b+); placebo (N=9), ponatinib (N=9), paquinimod (N=8), and ponatinib+ paquinimod (N=8), (G) total NLRP3+ myeloid cells (CD45+CD11b+NLRP3+); placebo (N=6), ponatinib (N=5), paquinimod (N=8), and ponatinib + paquinimod (N=4), (H) total neutrophils (CD45+CD11b+LY6G+); placebo (N=9), ponatinib (N=9), paquinimod (N=6), and ponatinib + paquinimod (N=5) (I) total proliferating neutrophils (CD45+CD11b+LY6G+Ki67+); placebo (N=9), ponatinib (N=5), paquinimod (N=7) and ponatinib+ paquinimod (N=5), (J) total NLRP3+ neutrophils (CD45+CD11b+LY6G+NLRP3+); placebo (N=6), ponatinib (N=6), paquinimod (N=7) and ponatinib+ paquinimod (N=5) (K) total macrophages (CD45+CD11b+F4/80+); placebo (N=6), ponatinib (N=6), paquinimod (N=6) and ponatinib + paquinimod (N=5), (L) total CCR2+ macrophages (CD45+CD11b+F4/80+Ly6Chi+CCR2+); placebo (N=6), ponatinib (N=5), paquinimod (N=6) and ponatinib+ paquinimod (N=5), (M) total IL-1β producing cells (IL-1β+); placebo (N=7), ponatinib (N=5), paquinimod (N=6) and ponatinib+ paquinimod (N=6), (N) total IL-6 producing cells (IL-6+); placebo (N=5), ponatinib (N=5), paquinimod (N=6), and ponatinib+ paquinimod (N=6), and (O) total TNF-α producing cells (TNF-α+); placebo (N=7), ponatinib (N=6) paquinimod (N=6), and ponatinib+ paquinimod (N=6). (P-W) Quantitation of immune cells as a percentage of total cells isolated from the spleen of animal groups mentioned in the figures. Data represents quantitation of percent of (P) total macrophages (CD11b+F4/80+); placebo (N=6), ponatinib (N=8), paquinimod (N=9), and ponatinib + paquinimod (N=6), (Q) total M1 macrophages (CD11b+F4/80+CD86+); placebo (N=6), ponatinib (N=7), paquinimod (N=8), and ponatinib + paquinimod (N=7) (R) total IL-1β producing cells (IL-1β+); placebo (N=6), ponatinib (N=7), paquinimod (N=6), and ponatinib + paquinimod (N=7). (S) total IL-6 producing cells (IL-6+); placebo (N=7), ponatinib (N=6), paquinimod (N=6), and ponatinib+ paquinimod (N=7), and (T) total TNF-α producing cells (TNF-α+); placebo (N=5), ponatinib (N=5), paquinimod (N=5), and ponatinib+ paquinimod (N=5), (U) total T-cells (TCRαβ+); placebo (N=6), ponatinib (N=7), paquinimod (N=6), and ponatinib+ paquinimod (N=6), (V) total proliferating T-cells (TCRαβ+Ki67+); placebo (N=6), ponatinib (N=6), paquinimod (N=5), and ponatinib+ paquinimod (N=5), and (W) total activated T-cells (TCRαβ+CD69+); placebo (N=6), ponatinib (N=5), paquinimod (N=5), and ponatinib+ paquinimod (N=5). Data (D-W) were analyzed by using Kruskal-Wallis followed by Dunn test and represented as mean±SEM. (X) Schematic depicting findings of the study.

References

    1. Douxfils J, Haguet H, Mullier F, Chatelain C, Graux C and Dogne JM. Association Between BCR-ABL Tyrosine Kinase Inhibitors for Chronic Myeloid Leukemia and Cardiovascular Events, Major Molecular Response, and Overall Survival: A Systematic Review and Meta-analysis. JAMA Oncol. 2016;2:625–632. - PubMed
    1. Moslehi JJ and Deininger M. Tyrosine Kinase Inhibitor-Associated Cardiovascular Toxicity in Chronic Myeloid Leukemia. J Clin Oncol. 2015;33:4210–8. - PMC - PubMed
    1. O’Hare T, Shakespeare WC, Zhu X, Eide CA, Rivera VM, Wang F, Adrian LT, Zhou T, Huang WS, Xu Q, Metcalf CA 3rd, Tyner JW, Loriaux MM, Corbin AS, Wardwell S, Ning Y, Keats JA, Wang Y, Sundaramoorthi R, Thomas M, Zhou D, Snodgrass J, Commodore L, Sawyer TK, Dalgarno DC, Deininger MW, Druker BJ and Clackson T. AP24534, a pan-BCR-ABL inhibitor for chronic myeloid leukemia, potently inhibits the T315I mutant and overcomes mutation-based resistance. Cancer Cell. 2009;16:401–12. - PMC - PubMed
    1. Hoy SM. Ponatinib: a review of its use in adults with chronic myeloid leukaemia or Philadelphia chromosome-positive acute lymphoblastic leukaemia. Drugs. 2014;74:793–806. - PubMed
    1. Dorer DJ, Knickerbocker RK, Baccarani M, Cortes JE, Hochhaus A, Talpaz M and Haluska FG. Impact of dose intensity of ponatinib on selected adverse events: Multivariate analyses from a pooled population of clinical trial patients. Leuk Res. 2016;48:84–91. - PubMed

References for Expanded Materials and Methods:

    1. Sreejit G, Abdel-Latif A, Athmanathan B, Annabathula R, Dhyani A, Noothi SK, Quaife-Ryan GA, Al-Sharea A, Pernes G, Dragoljevic D, Lal H, Schroder K, Hanaoka BY, Raman C, Grant MB, Hudson JE, Smyth SS, Porrello ER, Murphy AJ and Nagareddy PR. Neutrophil-Derived S100A8/A9 Amplify Granulopoiesis After Myocardial Infarction. Circulation. 2020;141:1080–1094. - PMC - PubMed
    1. Schelbergen RF, Geven EJ, van den Bosch MH, Eriksson H, Leanderson T, Vogl T, Roth J, van de Loo FA, Koenders MI, van der Kraan PM, van den Berg WB, Blom AB and van Lent PL. Prophylactic treatment with S100A9 inhibitor paquinimod reduces pathology in experimental collagenase-induced osteoarthritis. Ann Rheum Dis. 2015;74:2254–8. - PubMed
    1. Ren M, Qin H, Ren R and Cowell JK. Ponatinib suppresses the development of myeloid and lymphoid malignancies associated with FGFR1 abnormalities. Leukemia. 2013;27:32–40. - PMC - PubMed
    1. Gozgit JM, Wong MJ, Moran L, Wardwell S, Mohemmad QK, Narasimhan NI, Shakespeare WC, Wang F, Clackson T and Rivera VM. Ponatinib (AP24534), a multitargeted pan-FGFR inhibitor with activity in multiple FGFR-amplified or mutated cancer models. Mol Cancer Ther. 2012;11:690–9. - PubMed
    1. Singh AP, Glennon MS, Umbarkar P, Gupte M, Galindo CL, Zhang Q, Force T, Becker JR and Lal H. Ponatinib-induced cardiotoxicity: delineating the signalling mechanisms and potential rescue strategies. Cardiovasc Res. 2019;115:966–977. - PMC - PubMed

Publication types

MeSH terms