. 2023 Jan 10;8(1):e163962.
doi: 10.1172/jci.insight.163962.

Mucociliary transport deficiency and disease progression in Syrian hamsters with SARS-CoV-2 infection

Affiliations

Mucociliary transport deficiency and disease progression in Syrian hamsters with SARS-CoV-2 infection

Qian Li et al. JCI Insight. .

Abstract

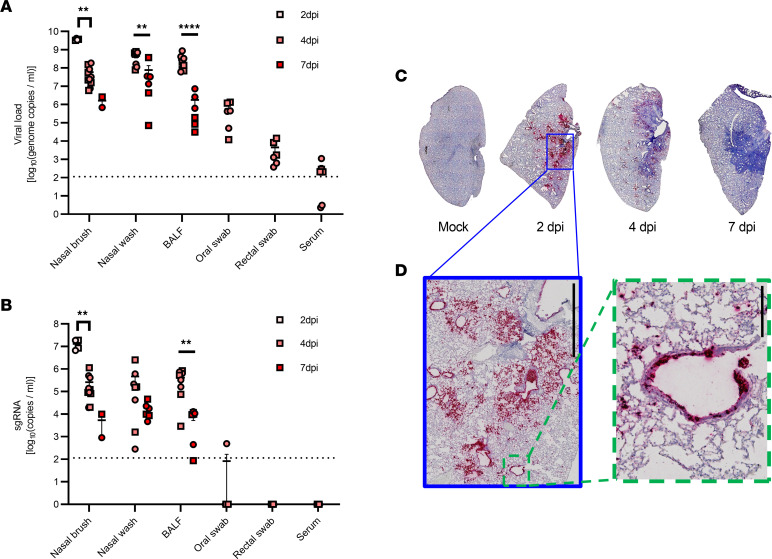
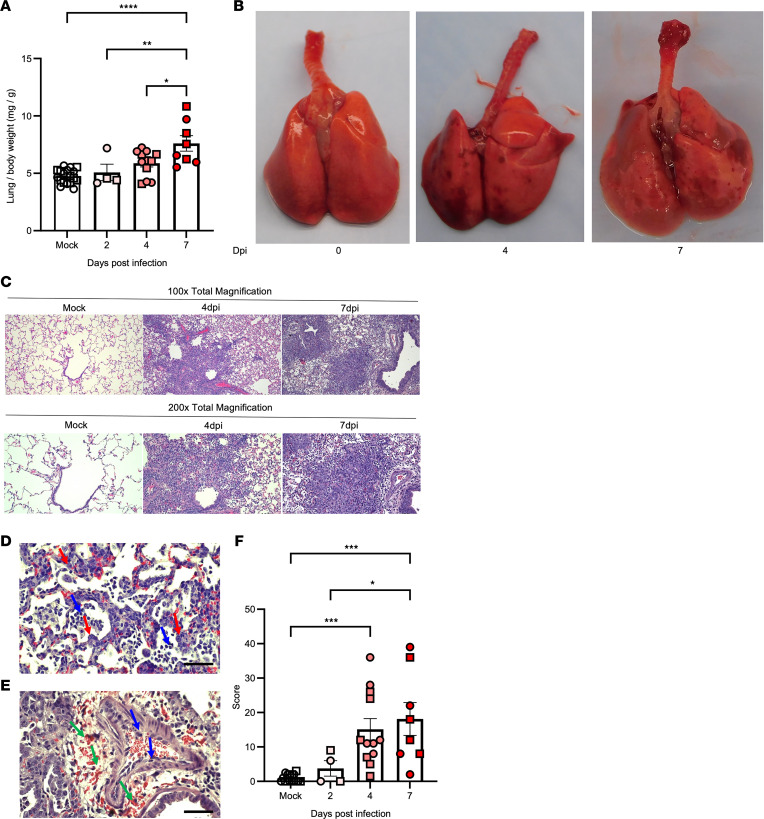
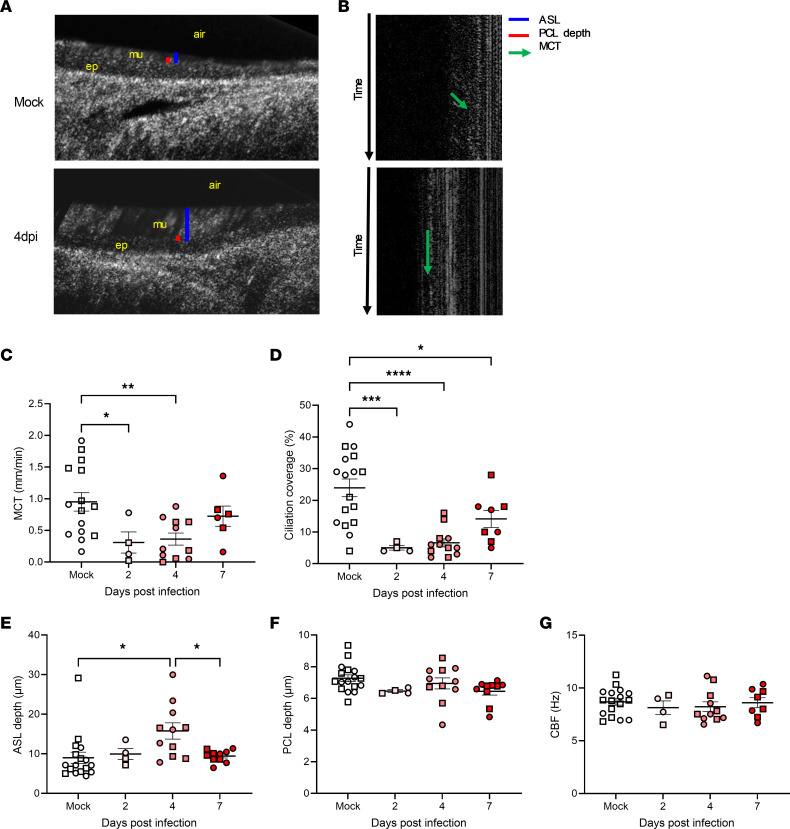
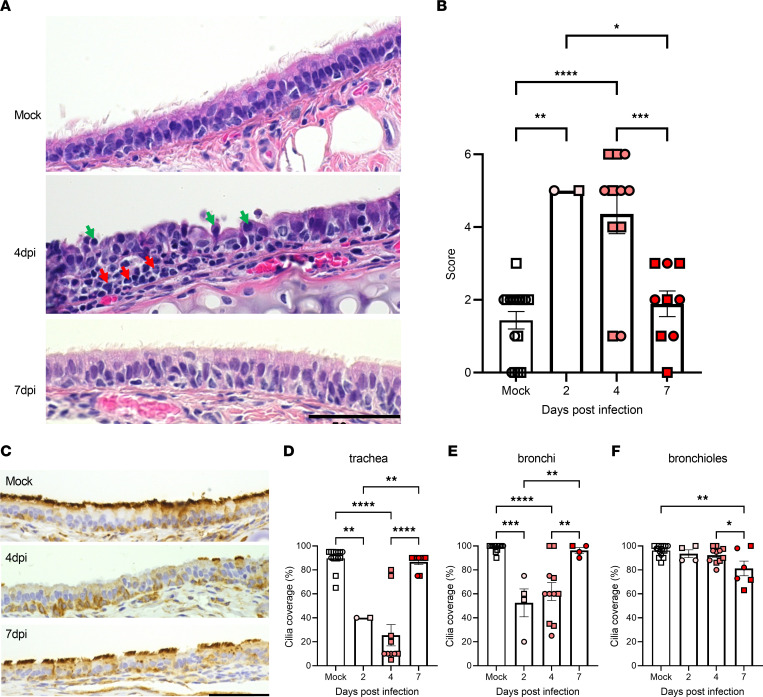
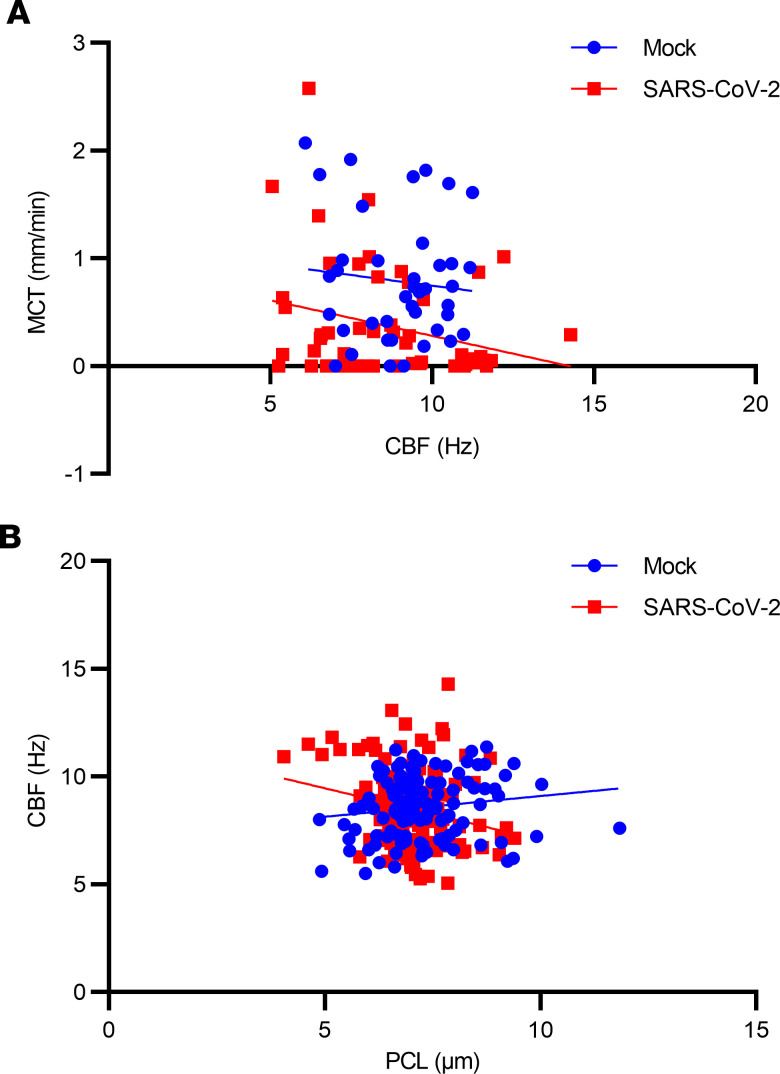
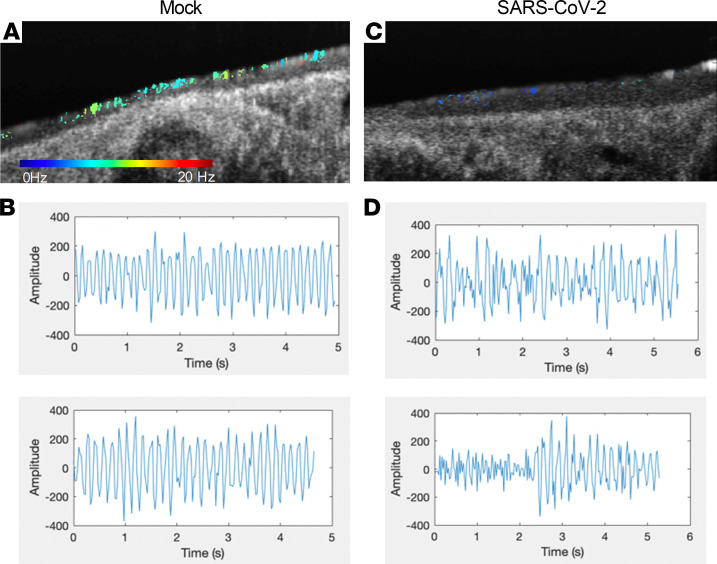
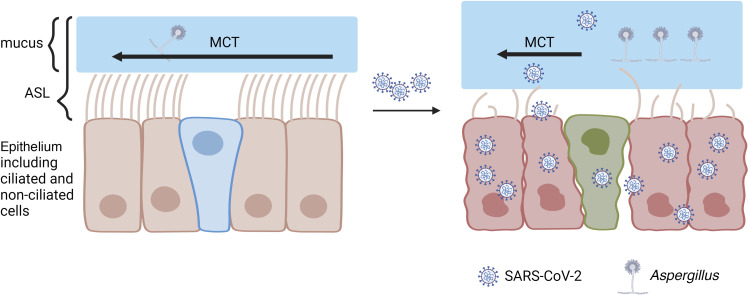
Substantial clinical evidence supports the notion that ciliary function in the airways is important in COVID-19 pathogenesis. Although ciliary damage has been observed in both in vitro and in vivo models, the extent or nature of impairment of mucociliary transport (MCT) in in vivo models remains unknown. We hypothesize that SARS-CoV-2 infection results in MCT deficiency in the airways of golden Syrian hamsters that precedes pathological injury in lung parenchyma. Micro-optical coherence tomography was used to quantitate functional changes in the MCT apparatus. Both genomic and subgenomic viral RNA pathological and physiological changes were monitored in parallel. We show that SARS-CoV-2 infection caused a 67% decrease in MCT rate as early as 2 days postinfection (dpi) in hamsters, principally due to 79% diminished airway coverage of motile cilia. Correlating quantitation of physiological, virological, and pathological changes reveals steadily descending infection from the upper airways to lower airways to lung parenchyma within 7 dpi. Our results indicate that functional deficits of the MCT apparatus are a key aspect of COVID-19 pathogenesis, may extend viral retention, and could pose a risk factor for secondary infection. Clinically, monitoring abnormal ciliated cell function may indicate disease progression. Therapies directed toward the MCT apparatus deserve further investigation.

Keywords: COVID-19; Respiration.


Conflict of interest statement

Conflict of interest: GJT and SMR have an unlicensed patent application (US20150253240A1) on the use of micro-optical coherence tomography (μOCT) as a diagnostic technology. GJT has an unlicensed patent application (MGH 23814, US application no. 15/894,574) on the μOCT probe. GJT is an inventor on patents 14/240,938, 12826303.5, 8896838, 8804126, 5819864, 6029983, and 9642531 that cover μOCT imaging. SMR is an inventor on patent 14/240,938 that covers μOCT imaging.

Figures

Figure 1
Figure 1. SARS-CoV-2 detection in hamsters through 7 dpi.
Golden Syrian hamsters were inoculated intranasally with 3 × 10⁵ PFU of SARS-CoV-2 or vehicle (mock), and samples were collected at 0, 2, 4, and 7 dpi. Genomic (A) and subgenomic (B) viral titers were quantitated by qRT2-PCR versus standard curve for nasal brush (n = 4, 10, and 2 for 2, 4, and 7dpi, respectively), nasal wash (n = 8 and 6 for 4 and 7 dpi, respectively), bronchial alveolar lavage fluid (BALF, n = 8 and 6 for 4 and 7 dpi, respectively), oral swab (n = 6 for 4 dpi), rectal swab (n = 6 for 4 dpi), and serum (n = 6 for 4 dpi). Viral titers in all types of samples from mock were under the detection limit and are not shown. Subgenomic viral titers in serum, rectal swab, and most oral swabs were below quantitation limits by PCR, and are shown as 0. The dotted line indicates the limits of the PCR method. Error bars show the SEM. Squares represent males and circles females. Values in log10(copies/mL) were used for statistical analysis. For nasal brush, P < 0.0001 and P = 0.0161 for genomic and subgenomic titers, respectively, by 2-way ANOVA, with **P < 0.01 (shown by a bracket) by Tukey’s post hoc test. For nasal wash and BALF, **P < 0.01 and ****P < 0.0001 (shown by straight lines) by unpaired t test. Representative images of the whole left lobe slices (n = 2 per time point) with SARS-CoV-2 detection by RNAscope (C), with high-power view (D) of the airway (left, scale bar: 2 mm) and parenchymal lung (right, scale bar: 0.2 mm) at 2 dpi.
Figure 2
Figure 2. Lung injury after SARS-CoV-2 infection in hamsters.
Golden Syrian hamsters were inoculated as in Figure 1, and lung damage was assessed by lung to body weight ratio (A, n = 18, 2, 12, and 8 for mock, 2, 4, and 7 dpi, respectively), gross pathology (B, representative of n = 18, 12, and 10 for mock, 4, and 7 dpi, respectively), and histopathological analysis of the left lung, including representative H&E images (CE, representatives of n = 18, 12, and 8 for mock, 4, and 7 dpi, respectively) and quantitation by a blinded pathologist (F, n = 16, 4, 12, and 8 for mock, 2, 4, and 7 dpi, respectively). (C) Total magnification ×100 (top) and ×200 (bottom) of lungs from mock, 4 dpi, and 7 dpi displaying progression to interstitial pneumonia. (D) Total magnification ×400 of alveolus and alveolar interstitium displaying type II pneumocyte hyperplasia (red arrows) and mononuclear infiltrate (blue arrows) and (E) a small-caliber artery displaying perivascular edema, hemorrhage (green arrows), and intimal arteritis (blue arrows). Scale bar: 50 μm. Error bars indicate SEM. Squares indicate males and circles females. (A and F) P < 0.0001 by 1-way ANOVA. *P < 0.05; **P < 0.01; ***P < 0.001; ****P < 0.0001 by Tukey’s post hoc test.
Figure 3
Figure 3. Mucociliary dysfunction in hamster airways after SARS-CoV-2 infection.
Golden Syrian hamsters were inoculated as in Figure 1. Following excision, tracheas were imaged by micro-optical coherence tomography (μOCT, AG). Representative μOCT images (n = 17 and 12 for mock and 4 dpi, respectively) from mock and 4 dpi (A) and M-mode projections of μOCT videos (B). ep, epithelium; mu, mucus. Mucociliary transport (MCT) rate (C, n = 15, 4, 11, and 6 for mock, 2, 4, and 7 dpi, respectively), degree of active ciliation coverage (D, n = 17, 4, 12, and 8 for mock, 2, 4, and 7 dpi, respectively), depths of airway surface liquid (ASL) (E, n = 17, 4, 11, and 10 for mock, 2, 4, and 7 dpi, respectively) and periciliary layer (PCL) (F, n = 17, 4, 11, and 10 for mock, 2, 4, and 7 dpi, respectively), and ciliary beat frequency (CBF) (G, n = 17, 4, 11, and 8 for mock, 2, 4, and 7 dpi, respectively) are quantitated. Error bars indicate SEM. Squares indicate males and circles females. P = 0.0099, P < 0.0001, P = 0.0117, P = 0.1106, P = 0.7808 by 1-way ANOVA for CH, respectively. *P < 0.05; **P < 0.01; ***P < 0.001; ****P < 0.0001 by Tukey’s post hoc test.
Figure 4
Figure 4. Tracheal injury after SARS-CoV-2 infection in hamsters.
After μOCT imaging in Figure 3, hamster tracheas were processed for histopathological analysis. Representative H&E images (A) and lesion quantitation by a blinded pathologist (B) are shown (n = 16, 2, 11, and 9 for mock, 2, 4, and 7 dpi, respectively). Red arrows indicate mononuclear inflammatory cells that expanded the submucosa and infiltrated the epithelial mucosal layer. Green arrows indicate apoptotic, desquamated epithelial cells that lost the attachment to adjacent epithelia. Unstained slides of tracheas and lungs from Figure 2 were labeled for α-tubulin by IHC to specifically focus on ciliary injury. Representative images are shown of trachea (C), and quantitation of cilia coverage along the apical surface of the tracheal (D, n = 14, 2, 10, and 9 for mock, 2, 4, and 7 dpi, respectively), bronchi (E, n = 13, 4, 11, and 4 for mock, 2, 4, and 7 dpi, respectively), and bronchiolar (F, n = 15, 4, 11, and 6 for mock, 2, 4, and 7 dpi, respectively) epithelia by a blinded investigator. Scale bars: 50 μm. Error bars indicate SEM. Squares indicate males and circles females. P < 0.0001 (B, D, and E) and P = 0.0047 (F) by 1-way ANOVA. *P < 0.05; **P < 0.01; ***P < 0.001; ****P < 0.0001 by Tukey’s post hoc test.
Figure 5
Figure 5. Association of mucociliary clearance functional parameters with delayed MCT in SARS-CoV-2 infection.
Values for each region of interest of each hamster trachea were obtained in Figure 3. Linear correlation analysis of MCT with CBF (A), and CBF with PCL depth (B) in the presence and absence of SARS-CoV-2 infection.
Figure 6
Figure 6. Abnormal ciliary beat frequency map and ciliary motion in SARS-CoV-2–infected hamsters.
μOCT images were acquired in Figure 3. Compared with mock controls (A), fewer cilia with intact and maintained ciliary beat frequency were evident in SARS-CoV-2–infected hamsters (C). Two representative waveform analyses of detected cilia exhibited consistent amplitude and frequency in trachea from mock controls (B) compared with erratic amplitude and irregular beat patterns in trachea from SARS-CoV-2–infected hamsters (D).
Figure 7
Figure 7. Summary of MCT pathogenesis and disease progression in hamsters.
Direct cytopathic effects of viral invasion and replication causes epithelium damage, including motile cilia loss and aberrant ciliary motion of residual cilia that results in MCT deficiency. Thickening of the mucus layer is likely due to the deficit in MCT, although increased mucus production by secretory cells also contributes. Delayed MCT and a thickened mucus layer contribute to viral retention, secondary infections (Aspergillus, as an example), and downstream pathogenesis. As viral titer and replication descend from proximal to distal airways over time, cilia loss induced by direct cytopathic effects of viral infection attenuates, whereas pathological injury likely via downstream mediators induced by infection increases. Images created with BioRender.com.

Update of

References

    1. Wang D, et al. Clinical characteristics of 138 hospitalized patients with 2019 novel coronavirus-infected pneumonia in Wuhan, China. JAMA. 2020;323(11):1061–1069. doi: 10.1001/jama.2020.1585. - DOI - PMC - PubMed
    1. Guan WJ, et al. Clinical characteristics of coronavirus disease 2019 in China. N Engl J Med. 2020;382(18):1708–1720. doi: 10.1056/NEJMoa2002032. - DOI - PMC - PubMed
    1. Huang C, et al. Clinical features of patients infected with 2019 novel coronavirus in Wuhan, China. Lancet. 2020;395(10223):497–506. doi: 10.1016/S0140-6736(20)30183-5. - DOI - PMC - PubMed
    1. Zhou F, et al. Clinical course and risk factors for mortality of adult inpatients with COVID-19 in Wuhan, China: a retrospective cohort study. Lancet. 2020;395(10229):1054–1062. doi: 10.1016/S0140-6736(20)30566-3. - DOI - PMC - PubMed
    1. Andersen KG, et al. The proximal origin of SARS-CoV-2. Nat Med. 2020;26(4):450–452. doi: 10.1038/s41591-020-0820-9. - DOI - PMC - PubMed

Publication types