. 2023 Feb 28;14(1):e0331822.
doi: 10.1128/mbio.03318-22. Epub 2023 Jan 10.

A Microtubule-Associated Protein Is Essential for Malaria Parasite Transmission

Affiliations

A Microtubule-Associated Protein Is Essential for Malaria Parasite Transmission

Jan Stephan Wichers-Misterek et al. mBio. .

Erratum in

Abstract

Mature gametocytes of Plasmodium falciparum display a banana (falciform) shape conferred by a complex array of subpellicular microtubules (SPMT) associated with the inner membrane complex (IMC). Microtubule-associated proteins (MAPs) define MT populations and modulate interaction with pellicular components. Several MAPs have been identified in Toxoplasma gondii, and homologues can be found in the genomes of Plasmodium species, but the function of these proteins for asexual and sexual development of malaria parasites is still unknown. Here, we identified a novel subpellicular MAP, termed SPM3, that is conserved within the genus Plasmodium, especially within the subgenus Laverania, but absent in other Apicomplexa. Conditional knockdown and targeted gene disruption of Pfspm3 in Plasmodium falciparum cause severe morphological defects during gametocytogenesis, leading to round, nonfalciform gametocytes with an aberrant SPMT pattern. In contrast, Pbspm3 knockout in Plasmodium berghei, a species with round gametocytes, caused no defect in gametocytogenesis, but sporozoites displayed an aberrant motility and a dramatic defect in invasion of salivary glands, leading to a decreased efficiency in transmission. Electron microscopy revealed a dissociation of the SPMT from the IMC in Pbspm3 knockout parasites, suggesting a function of SPM3 in anchoring MTs to the IMC. Overall, our results highlight SPM3 as a pellicular component with essential functions for malaria parasite transmission. IMPORTANCE A key structural feature driving the transition between different life cycle stages of the malaria parasite is the unique three-membrane pellicle, consisting of the parasite plasma membrane (PPM) and a double membrane structure underlying the PPM termed the inner membrane complex (IMC). Additionally, there are numerous linearly arranged intramembranous particles (IMPs) linked to the IMC, which likely link the IMC to the subpellicular microtubule cytoskeleton. Here, we identified, localized, and characterized a novel subpellicular microtubule-associated protein unique to the genus Plasmodium. The knockout of this protein in the human-pathogenic species P. falciparum resulted in malformed gametocytes and aberrant microtubules. We confirmed the microtubule association in the P. berghei rodent malaria homologue and show that its knockout results in a perturbed microtubule architecture, aberrant sporozoite motility, and decreased transmission efficiency.

Keywords: Plasmodium falciparum; gametocytogenesis; malaria; microtubule.


Conflict of interest statement

The authors declare no conflict of interest.

Figures

FIG 1
FIG 1
PfSPM3 localizes to the SPMTs of P. falciparum merozoites. (A) Phylogenetic relatedness of sequences homologous to SPM3 across species (fast minimum evolution tree based on Grishin protein distance) and similarity along homologous sequence stretches. (B) Localization of PfSPM3-GFP by live-cell microscopy during intracellular development cycle in 3D7-PfSPM3-GFP-glmS. (C) Colocalization of PfSPM3-GFP with TubulinTracker, microtubule-associated protein PfSPM1mCherry, the rhoptry marker protein ARO-mCherry, and the IMC marker proteins ALV5mCherry, PhIL1mCherry, and PF3D7_ 1345600mCherry. Nuclei were stained with Hoechst 33342. Bars, 2 μm. Zoom factor, 400%, with a scale bar of 1 μm. DIC, differential inference contrast.
FIG 2
FIG 2
PfSPM3 is dispensable for the asexual replication cycle. (A) Representative live-cell microscopy of 3D7-PfSPM3-GFP-glmS schizonts cultured either with or without (control) 2.5 mM GLCN at 40 h after addition of GLCN. Scale bar, 2 μm. (B) Growth of 3D7 and 3D7-PfSPM3-GFP-glmS parasites treated with or without 2.5 mM GLCN after two parasite replication cycles, as determined by flow cytometry. Shown are relative parasitemia values, which were obtained by dividing the parasitemia of GLCN-treated cultures by the parasitemia of the corresponding untreated ones. Values are means and standard deviations (SD) from independent growth experiments, with the number of experiments (n) indicated. P values were determined with a two-tailed unpaired t test with Welch’s correction. (C) Localization of truncated PfSPM3-TGD-GFP fusion protein by live-cell microscopy across the intraerythrocytic development in the 3D7-iGP background. (D) Growth curves of 3D7-iGP-PfSPM3-TGD versus 3D7-iGP parasites after two parasite replication cycles, as determined by flow cytometry. Three independent growth experiments were performed, and a summary is shown as percentage of growth compared to the parental parasite line. Values are means and SD from independent growth experiments, with the number of experiments (n) indicated. P values were determined with a one-sample t test. (E) Colocalization of the truncated PfSPM3-TGD-GFP fusion protein with TubulinTracker and the IMC marker proteins ALV5mCherry and PF3D7_ 1345600mCherry. Nuclei were stained with Hoechst 33342. Bar, 2 μm. Zoom factor, 400%, with a scale bar of 1 μm.
FIG 3
FIG 3
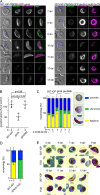
PfSPM3 deficiency interferes with gametocytogenesis and leads to nonfalciform morphology. (A) Live-cell microscopy of 3D7-iGP-PfSPM3-GFP gametocytes (day 7 to day 13 after gametocyte induction) cultured either with or without (control) 2.5 mM GLCN. Microtubules were visualized with TubulinTracker, and nuclei were stained with Hoechst 33342. Bar, 2 μm. (B) Gametocytemia at day 10 after gametocyte induction was determined by counting 1,096 to 2,632 (mean, 1,793) cells per condition in Giemsa-stained thin blood smears. The relative gametocytemia values were obtained by dividing the gametocytemia of GLCN-treated cultures by the gametocytemia of the corresponding untreated cultures. Values are means and SD from independent growth experiments, with the number of experiments (n) indicated. A two-tailed unpaired t test with Welch’s and Benjamini-Hochberg corrections was used to calculate multiplicity-adjusted P values for 3D7-iGP-PfSPM3-GFP-glmS or 3D7-iGP-PfSPM3-GFP-glmSM9 versus 3D7-iGP parasites all cultured with 2.5 mM GLCN. (C) Classification and quantification of gametocyte morphology within parasite populations of 3D7-iGP, 3D7-iGP-PfSPM3-GFP-glmS, and 3D7-iGP-PfSPM3-GFP-glmSM9 cultured either with or without (control) 2.5 mM GLCN. Between 589 and 2,632 erythrocytes and 19 to 69 (mean, 48) parasites per condition in Giemsa-stained thin blood smears were analyzed. Yellow, falciform; blue, pycnotic; green, abnormal. Representative images are shown on the right at day 10 after gametocyte induction. (D) Quantification of gametocyte morphology (yellow, falciform; blue, pycnotic; green, abnormal) at day 10 after gametocyte induction for 3D7-iGP (control) and 3D7-iGP-SPM3-TGD parasites. For each condition, the proportion of parasite stages in erythrocytes was determined in three independent experiments (total numbers of erythrocytes screened for 3D7-iGP were 2,694, 1,431, and 2,742; numbers for 3D7-iGP-SPM3-TGD were 1,328, 1,144, and 925) and displayed as a percentage. (E) Representative Giemsa smears of 3D7-iGP and 3D7-iGP-PfSPM3-TGD stage II to V gametocytes (day 5 to day 13 after gametocyte induction). Bar, 5 μm.
FIG 4
FIG 4
PbSPM3 localizes to SPMTs and is critical for sporozoite motility, salivary gland invasion, and transmission to mammalian hosts. (A) PbSPM3 localizes along microtubules in midgut and salivary gland sporozoites. Representative images of fixed sporozoites. Shown are 2D projections of an acquired Z-stack. MTs were stained with an antitubulin antibody. Nuclei were stained with Hoechst 33342. The merge image shows microtubules in magenta and PbSPM3-GFP in green. Bar, 5 μm. (B) Deletion of pbspm3 does not affect asexual blood stage growth rate. Asexual blood stage growth rates were calculated based on the parasitemia value at day 8 postinfection with a single infected red blood cell intravenously. PbANKA WT growth rates were plotted as a reference and were determined and previously published by our laboratory (55, 56, 69). Mean fold change within a single parasite replication cycle (24 h for P. berghei) with SD is presented. (C) Similar oocyst numbers and infection rates of wild-type and PbSPM3-KO-infected A. stephensi. Shown are pooled data from two (WT) and three (PbSPM3-KO) independent cage feeds. A total of 79 (WT) and 151 (PbSPM3-KO) mosquitoes were analyzed on day 11 and day 12 postinfection as technical replicates, of which 78.5% (62) and 88.1% (133) were infected, respectively (P = 0.08, Fisher’s exact test). For statistical analysis comparing oocyst numbers in infected midguts, a Mann-Whitney test was performed. The black line indicates the median, with error bars representing the IQR. (D) Ratio of salivary gland-resident versus midgut-resident sporozoites determined at day 18 and 20 postinfection from two (WT) and three (PbSPM3-KO) independent cage infections. The P value was determined with an unpaired t test with Welch’s correction. The black line indicates the median, with error bars representing the IQR. (E) Percentage of wild-type and PbSPM3-KO sporozoites isolated from salivary glands displaying movement after attachment or floating in the medium. Pooled data from two independent cage feeds (WT) with 139 sporozoites and three (PbSPM3-KO) with 109 sporozoites, with two technical replicates per cage infection. For statistical analysis comparing differences in gliding categories, a chi-square test was performed. (F) Different types of movement patterns observed in sporozoites analyzed for panel E. (G) Wild-type-like circular (top) and helical (bottom) movement patterns. Red arrows point to the apical end of the sporozoite. Bar, 10 μm. (H) Sporozoite speeds from continuously gliding wild-type and PbSPM3-KO sporozoites shown in panel F. As the PbSPM3-KO mutant had only four continuously gliding sporozoites in the total sporozoites analyzed from the three biological replicates, only four data points are shown, in comparison to 40 for the wild type. The P value was determined with the Mann-Whitney test. The black line indicates the median with the IQR. (I) Parasitemia curves and Kaplan-Meier plots showing increases in blood-stage parasitemia (top) and decrease of mouse survival (bottom) after natural transmission. Two and three independent infections for the wild type and PbSPM3-KO, respectively, using 3 to 4 mice per experiment (totals: WT, n = 7; PbSPM3-KO, n = 12). See also Table 1. Note that mice from two replicates remained negative over the course of parasitemia monitoring, and hence, the parasitemia curve of replicate 2 was slightly nudged for better visibility. Also, lines in Kaplan-Meier plots in panels J and I were slightly nudged for better visibility. (J) Parasitemia curves and Kaplan-Meier plots showing increases in blood-stage parasitemia (left) and mouse survival after injection of 1,000 sporozoites intravenously. Two independent infections for the wild type (gray and black) and PbSPM3-KO (red and orange) using 3 or 4 mice per experiment (totals: WT, n = 7; PbSPM3-KO, n = 8).
FIG 5
FIG 5
SPMTs dissociate from the IMC in PbSPM3-KO sporozoites. (A) Transmission electron micrographs showing cross sections through WT (left) and PbSPM3-KO (right) P. berghei sporozoites within oocysts at day 15 after mosquito infection. Single images are ordered according to increasing degree of microtubule displacement. Bar, 200 nm. Green, SPMTs; yellow, IMC; magenta, membrane of unknown origin. (B) Longitudinal section through a PbSPM3-KO midgut sporozoite. Note the dissociation of the microtubules from the IMC with increasing distance from the apical end. (C) Distance between microtubules and IMC, with the black line indicating the median. The dashed line indicates the preset cutoff value of 40 nm; distances of 40 nm or less were taken as representing microtubules close to the IMC, according to the findings in microtubule-IMC distance by Ferreira et al. (26). The gray background highlights all values not considered close to the IMC, with the corresponding percentages above. In total, 349 wild-type and 579 PbSPM3-KO microtubules were measured. Spread of microtubule-IMC distance was statistically analyzed using a linear mixed model. (D) Proposed model showing the dissociation of the microtubules from the IMC with increasing distance from the apical end in the PbSPM3-KO. The dashed line in the longitudinal section shows the position of the cross section pictured below it.

References

    1. WHO. 2020. World malaria report 2020.
    1. Ollomo B, Durand P, Prugnolle F, Douzery E, Arnathau C, Nkoghe D, Leroy E, Renaud F. 2009. A new malaria agent in African hominids. PLoS Pathog 5:e1000446. doi:10.1371/journal.ppat.1000446. - DOI - PMC - PubMed
    1. Liu W, Sundararaman SA, Loy DE, Learn GH, Li Y, Plenderleith LJ, Ndjango JBN, Speede S, Atencia R, Cox D, Shaw GM, Ayouba A, Peeters M, Rayner JC, Hahn BH, Sharp PM. 2016. Multigenomic delineation of Plasmodium species of the Laverania subgenus infecting wild-living chimpanzees and gorillas. Genome Biol Evol 8:1929–1939. doi:10.1093/gbe/evw128. - DOI - PMC - PubMed
    1. Liu W, Sherrill-Mix S, Learn GH, Scully EJ, Li Y, Avitto AN, Loy DE, Lauder AP, Sundararaman SA, Plenderleith LJ, Ndjango JBN, Georgiev AV, Ahuka-Mundeke S, Peeters M, Bertolani P, Dupain J, Garai C, Hart JA, Hart TB, Shaw GM, Sharp PM, Hahn BH. 2017. Wild bonobos host geographically restricted malaria parasites including a putative new Laverania species. Nat Commun 8:1635. doi:10.1038/s41467-017-01798-5. - DOI - PMC - PubMed
    1. Otto TD, Gilabert A, Crellen T, Böhme U, Arnathau C, Sanders M, Oyola SO, Okouga AP, Boundenga L, Willaume E, Ngoubangoye B, Moukodoum ND, Paupy C, Durand P, Rougeron V, Ollomo B, Renaud F, Newbold C, Berriman M, Prugnolle F. 2018. Genomes of all known members of a Plasmodium subgenus reveal paths to virulent human malaria. Nat Microbiol 3:687–697. doi:10.1038/s41564-018-0162-2. - DOI - PMC - PubMed

Publication types

Substances