Review
. 2023 Feb;306(2):e222462.
doi: 10.1148/radiol.222462. Epub 2023 Jan 10.

Current and Emerging Knowledge in COVID-19

Affiliations
Review

Current and Emerging Knowledge in COVID-19

Yeon Joo Jeong et al. Radiology. 2023 Feb.

Abstract

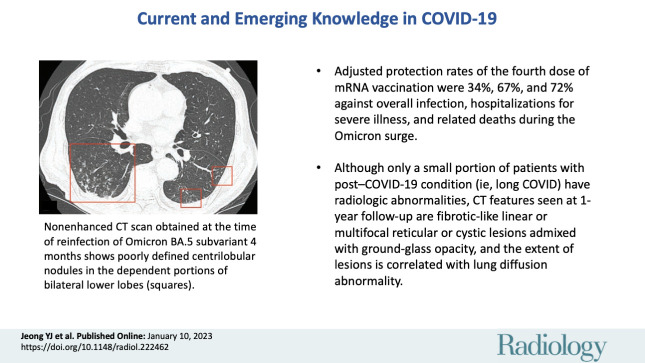
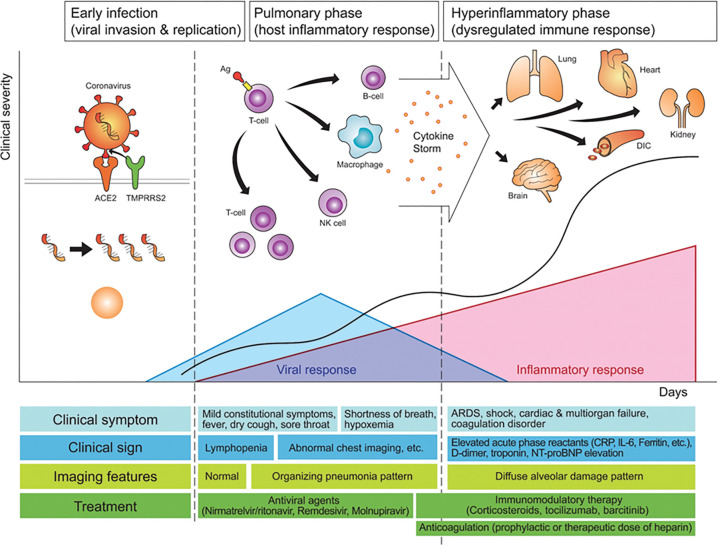
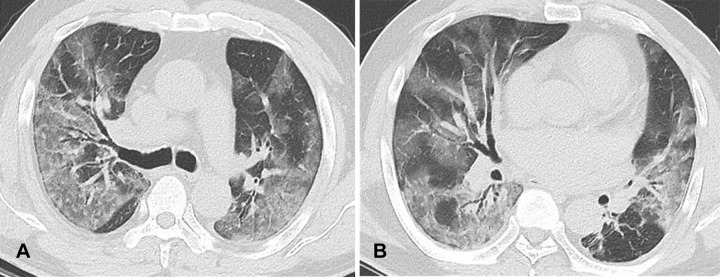
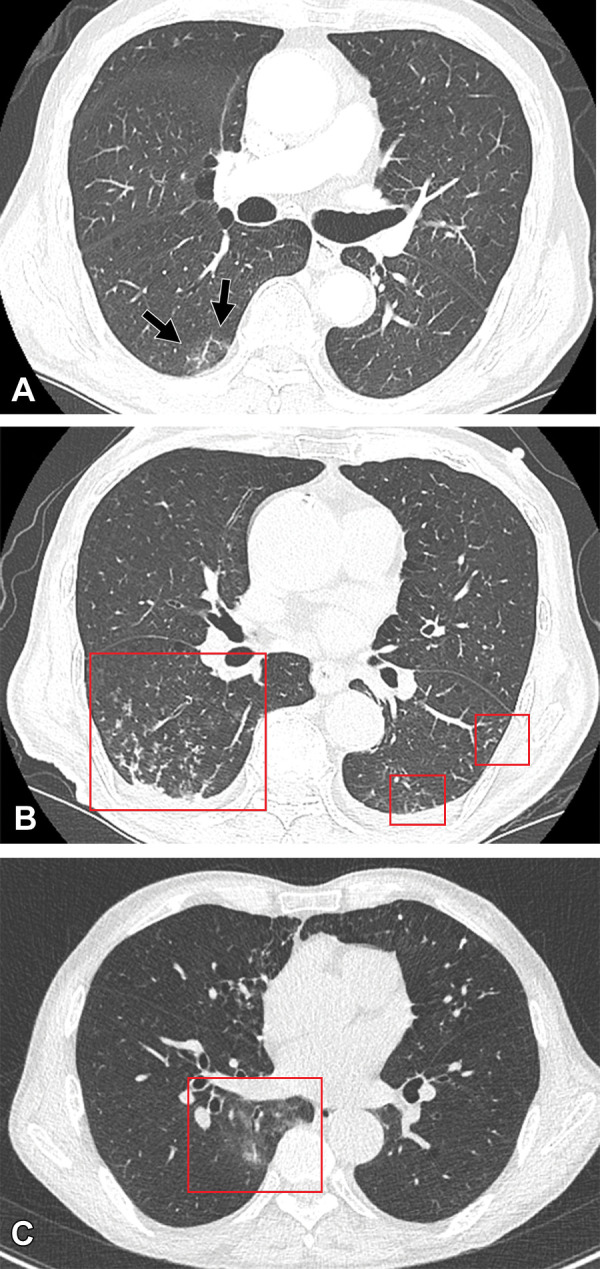
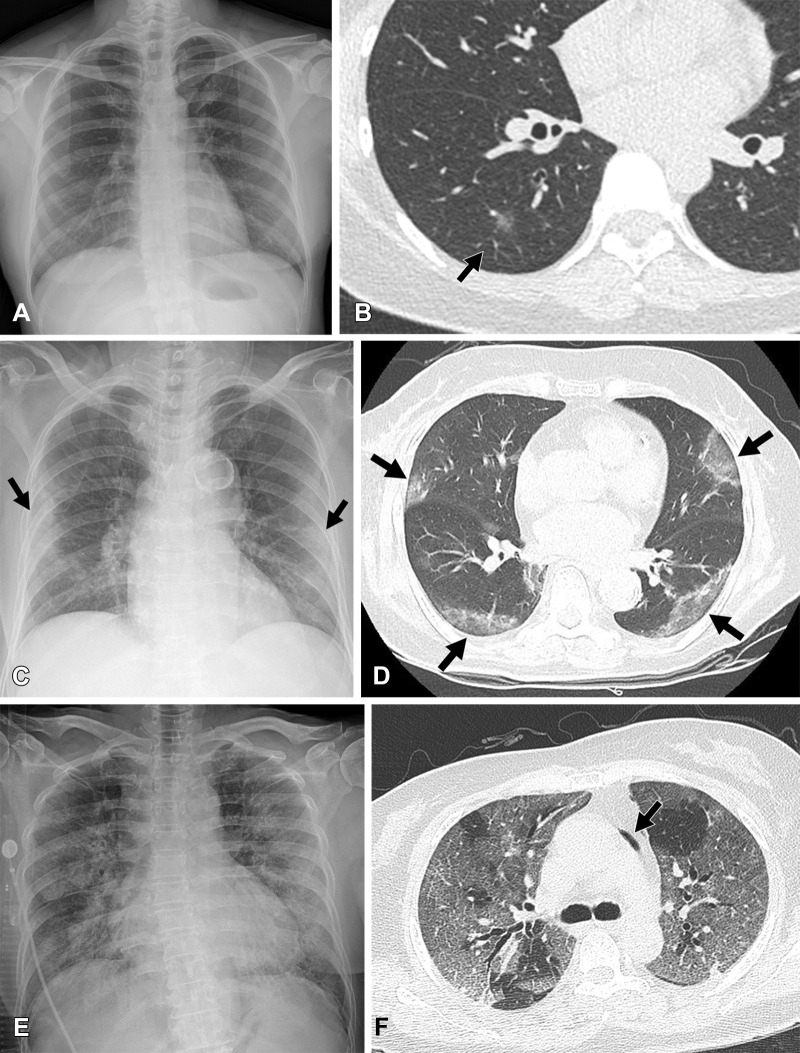
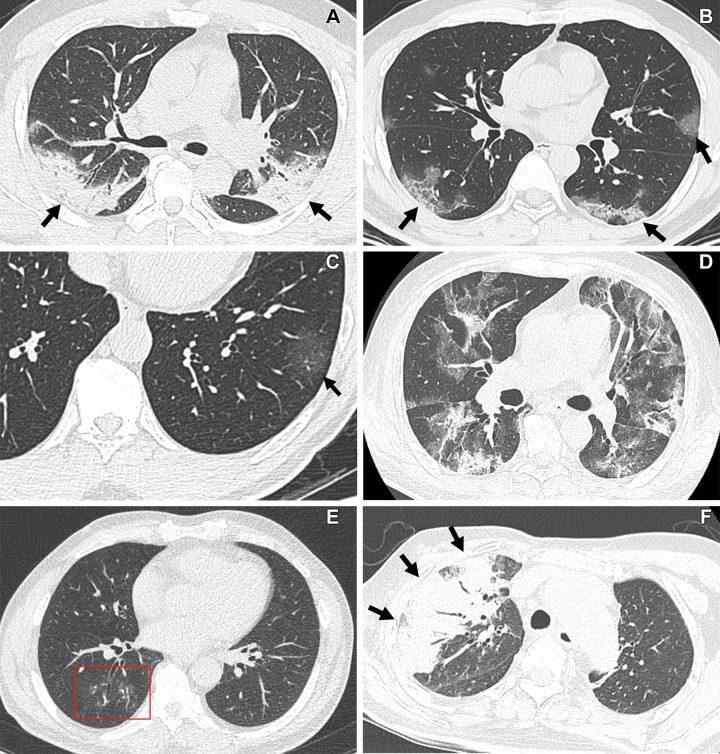
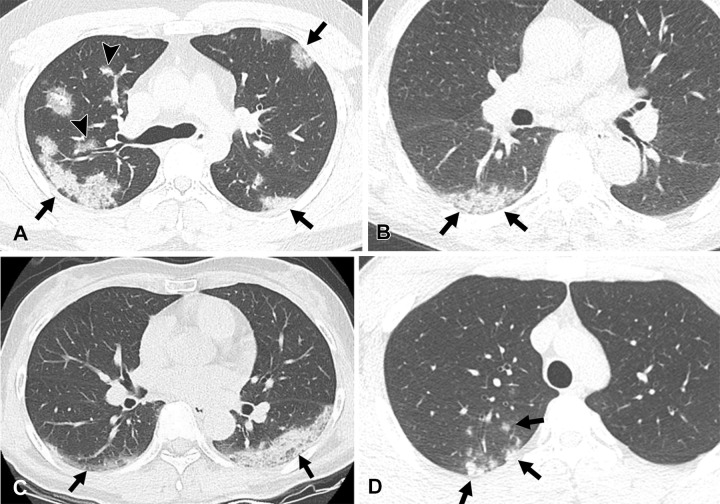
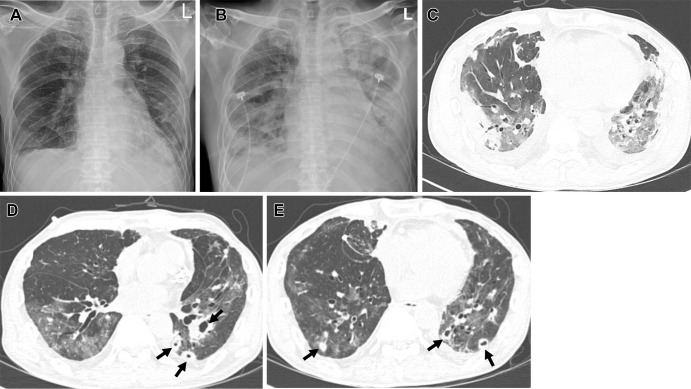
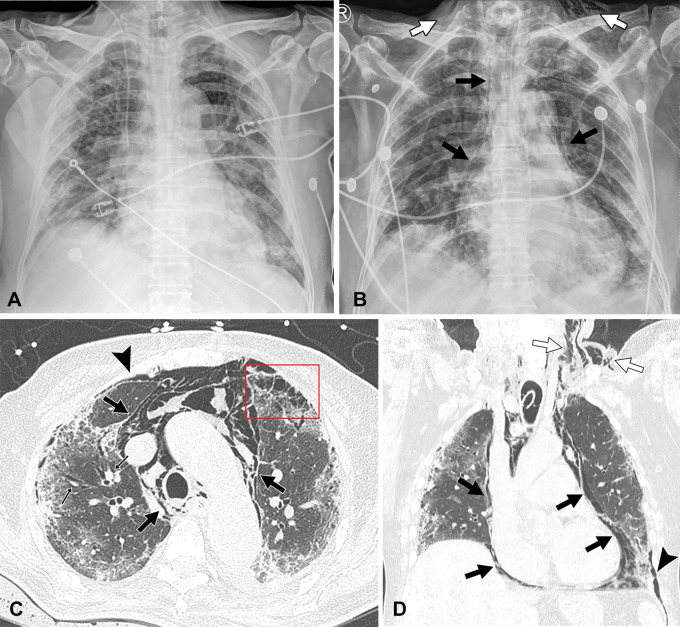
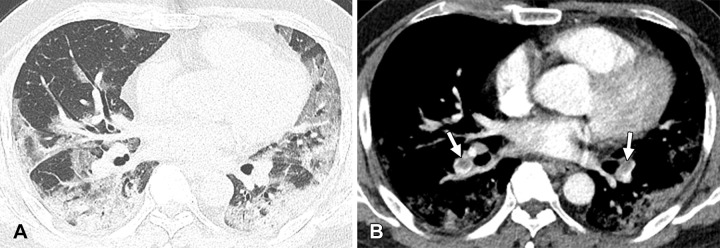
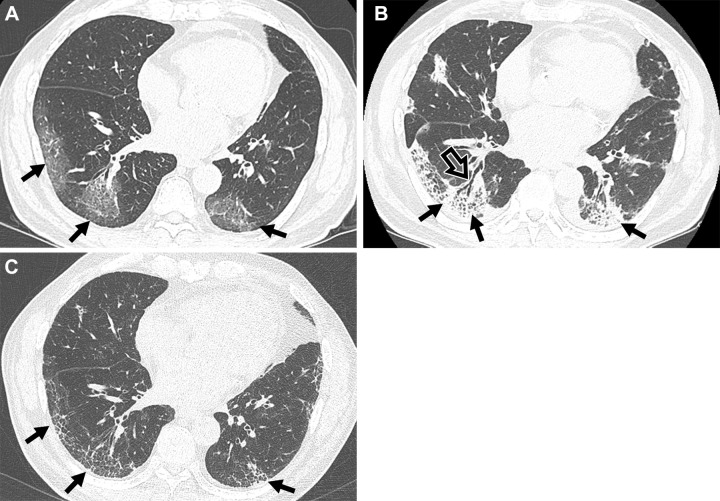
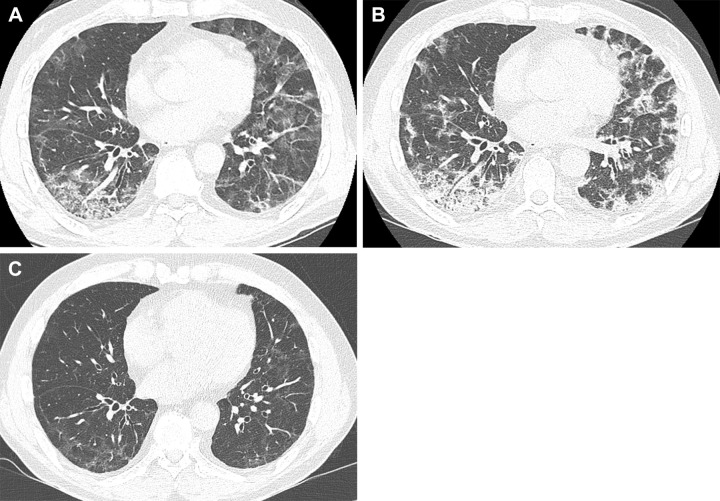
COVID-19 has emerged as a pandemic leading to a global public health crisis of unprecedented morbidity. A comprehensive insight into the imaging of COVID-19 has enabled early diagnosis, stratification of disease severity, and identification of potential sequelae. The evolution of COVID-19 can be divided into early infectious, pulmonary, and hyperinflammatory phases. Clinical features, imaging features, and management are different among the three phases. In the early stage, peripheral ground-glass opacities are predominant CT findings, and therapy directly targeting SARS-CoV-2 is effective. In the later stage, organizing pneumonia or diffuse alveolar damage pattern are predominant CT findings and anti-inflammatory therapies are more beneficial. The risk of severe disease or hospitalization is lower in breakthrough or Omicron variant infection compared with nonimmunized or Delta variant infections. The protection rates of the fourth dose of mRNA vaccination were 34% and 67% against overall infection and hospitalizations for severe illness, respectively. After acute COVID-19 pneumonia, most residual CT abnormalities gradually decreased in extent, but they may remain as linear or multifocal reticular or cystic lesions. Advanced insights into the pathophysiologic and imaging features of COVID-19 along with vaccine benefits have improved patient care, but emerging knowledge of post-COVID-19 condition, or long COVID, also presents radiology with new challenges.


Conflict of interest statement

Disclosures of conflicts of interest: Y.J.J. No relevant relationships. Y.M.W. No relevant relationships. H.P. No relevant relationships. J.E.L. No relevant relationships. S.H.K. No relevant relationships. K.S.L. No relevant relationships.

Figures

None
Graphical abstract
Diagram shows how pathogenetic evolution of COVID-19 pneumonia correlates
with clinical and imaging features and management. The early infection stage
occurs at the time of inoculation. During this stage, SARS-CoV-2 binds to its
target using the angiotensin-converting enzyme 2 (ACE2) receptor and
transmembrane protease serine 2 (TMPRRS2) and multiplies in the host cells. In
the second stage, the pulmonary phase, viral multiplication and localized
inflammation in the lungs occur and viral pneumonia is developed. In a minority
of patients with COVID-19, the disease may progress to the most severe stage,
the hyperinflammatory phase. An uncontrolled systemic inflammatory response
resulting from the cytokine storm occurs at this stage. Pink triangle indicates
inflammatory response, blue triangle indicates viral response, and black line
indicates clinical severity. Areas under trigon represent chronological changes
in the intensity of responses. Ag = antigen, ARDS = acute respiratory distress
syndrome, CRP = C-reactive protein, DIC = disseminated intravascular
coagulation, IL-6 = interleukin-6, NT-proBNP = N-terminal prohormone of brain
natriuretic peptide.
Figure 1:
Diagram shows how pathogenetic evolution of COVID-19 pneumonia correlates with clinical and imaging features and management. The early infection stage occurs at the time of inoculation. During this stage, SARS-CoV-2 binds to its target using the angiotensin-converting enzyme 2 (ACE2) receptor and transmembrane protease serine 2 (TMPRRS2) and multiplies in the host cells. In the second stage, the pulmonary phase, viral multiplication and localized inflammation in the lungs occur and viral pneumonia is developed. In a minority of patients with COVID-19, the disease may progress to the most severe stage, the hyperinflammatory phase. An uncontrolled systemic inflammatory response resulting from the cytokine storm occurs at this stage. Pink triangle indicates inflammatory response, blue triangle indicates viral response, and black line indicates clinical severity. Areas under trigon represent chronological changes in the intensity of responses. Ag = antigen, ARDS = acute respiratory distress syndrome, CRP = C-reactive protein, DIC = disseminated intravascular coagulation, IL-6 = interleukin-6, NT-proBNP = N-terminal prohormone of brain natriuretic peptide.
COVID-19 pneumonia with diffuse alveolar damage pattern in a 64-year-old
unvaccinated man with no underlying disease at Delta variant–dominant
period. (A, B) Follow-up transverse nonenhanced CT scans (lung window) obtained
at levels of right main bronchus (A) and right middle lobar bronchus (B) 1 day
after positive nucleic acid amplification test for COVID-19 demonstrate
extensive areas of ground-glass opacity involving bilateral lungs.
Figure 2:
COVID-19 pneumonia with diffuse alveolar damage pattern in a 64-year-old unvaccinated man with no underlying disease at Delta variant–dominant period. (A, B) Follow-up transverse nonenhanced CT scans (lung window) obtained at levels of right main bronchus (A) and right middle lobar bronchus (B) 1 day after positive nucleic acid amplification test for COVID-19 demonstrate extensive areas of ground-glass opacity involving bilateral lungs.
Cases of SARS-CoV-2 reinfection and breakthrough infection during an
Omicron BA.5 subvariant–predominant period. (A, B) CT scans (lung window)
in an 82-year-old man with COVID-19 reinfection during an Omicron BA.5
subvariant predominant period. The patient had a history of prior Omicron BA.1
subvariant infection and cerebrovascular accident. (A) Transverse nonenhanced CT
scan obtained at bronchus intermedius level at the time of Omicron BA.1
subvariant (his first infection) shows focal area of ground-glass opacity (GGO)
in superior segment of right lower lobe (arrows). CT findings were classified as
“indeterminate” according to the RSNA chest CT classification
system. (B) Transverse nonenhanced CT scan obtained at the level of basal trunks
at the time of reinfection of Omicron BA.5 subvariant 4 months after the first
infection shows poorly defined centrilobular nodules in the dependent portions
of bilateral lower lobes (squares). CT findings were classified as
“atypical” according to the RSNA chest CT classification system.
(C) CT scan (lung window) of breakthrough infection of SARS-CoV-2 during an
Omicron BA.1 subvariant–dominant period in a 76-year-old man with a
history of hypertension and pulmonary tuberculosis who had received his COVID-19
booster. Transverse nonenhanced CT scan obtained at level of inferior pulmonary
vein shows focal area of poorly defined GGO (square) in the right lower lobe. CT
findings were classified as “indeterminate” according to the RSNA
chest CT classification system.
Figure 3:
Cases of SARS-CoV-2 reinfection and breakthrough infection during an Omicron BA.5 subvariant–predominant period. (A, B) CT scans (lung window) in an 82-year-old man with COVID-19 reinfection during an Omicron BA.5 subvariant predominant period. The patient had a history of prior Omicron BA.1 subvariant infection and cerebrovascular accident. (A) Transverse nonenhanced CT scan obtained at bronchus intermedius level at the time of Omicron BA.1 subvariant (his first infection) shows focal area of ground-glass opacity (GGO) in superior segment of right lower lobe (arrows). CT findings were classified as “indeterminate” according to the RSNA chest CT classification system. (B) Transverse nonenhanced CT scan obtained at the level of basal trunks at the time of reinfection of Omicron BA.5 subvariant 4 months after the first infection shows poorly defined centrilobular nodules in the dependent portions of bilateral lower lobes (squares). CT findings were classified as “atypical” according to the RSNA chest CT classification system. (C) CT scan (lung window) of breakthrough infection of SARS-CoV-2 during an Omicron BA.1 subvariant–dominant period in a 76-year-old man with a history of hypertension and pulmonary tuberculosis who had received his COVID-19 booster. Transverse nonenhanced CT scan obtained at level of inferior pulmonary vein shows focal area of poorly defined GGO (square) in the right lower lobe. CT findings were classified as “indeterminate” according to the RSNA chest CT classification system.
Chest radiographic and CT findings of COVID-19 pneumonia according to
disease stage and lesion extent. (A, B) COVID-19 pneumonia at the time of
“early infection phase” in a 42-year-old woman who received a
booster dose during Omicron variant–dominant period. (A) Chest
radiograph obtained 3 days after the positive nucleic acid amplification
test shows no abnormal opacification in either lung. (B) Transverse
nonenhanced CT scan (lung window) obtained at level of basal trunk and on
the same day shows an ill-defined ground-glass opacity (GGO) nodule (arrow)
in the superior segment of the right lower lobe. (C, D) COVID-19 pneumonia
at the time of “pulmonary phase” in an 80-year-old fully
vaccinated woman during Delta variant–dominant period. (C) Chest
radiograph obtained 5 days after positive nucleic acid amplification test
shows multifocal patchy consolidation and GGO (arrows) in both lungs with a
peripheral predominance. (D) Transverse nonenhanced CT scan (lung window)
obtained at the level of the inferior pulmonary vein and on the same day
demonstrates patchy areas of mixed GGO and consolidation with subpleural
distribution (arrows). (E, F) COVID-19 pneumonia at the time of
“hyperinflammatory phase” in a 69-year-old unvaccinated woman
with no underlying disease during Delta variant–dominant period. (E)
Chest radiograph obtained 2 weeks after positive nucleic acid amplification
test shows diffuse and extensive parenchymal opacity involving bilateral
lungs. (F) Transverse nonenhanced CT scan (lung window) obtained at the
level of carina and on the same day demonstrates diffuse and extensive areas
of GGO with visible intralobular lines involving bilateral lungs. Also note
pneumomediastinum at left paraaortic area (arrow). Even though the patient
was treated with mechanical ventilation and extracorporeal membrane
oxygenation, she succumbed to the disease.
Figure 4:
Chest radiographic and CT findings of COVID-19 pneumonia according to disease stage and lesion extent. (A, B) COVID-19 pneumonia at the time of “early infection phase” in a 42-year-old woman who received a booster dose during Omicron variant–dominant period. (A) Chest radiograph obtained 3 days after the positive nucleic acid amplification test shows no abnormal opacification in either lung. (B) Transverse nonenhanced CT scan (lung window) obtained at level of basal trunk and on the same day shows an ill-defined ground-glass opacity (GGO) nodule (arrow) in the superior segment of the right lower lobe. (C, D) COVID-19 pneumonia at the time of “pulmonary phase” in an 80-year-old fully vaccinated woman during Delta variant–dominant period. (C) Chest radiograph obtained 5 days after positive nucleic acid amplification test shows multifocal patchy consolidation and GGO (arrows) in both lungs with a peripheral predominance. (D) Transverse nonenhanced CT scan (lung window) obtained at the level of the inferior pulmonary vein and on the same day demonstrates patchy areas of mixed GGO and consolidation with subpleural distribution (arrows). (E, F) COVID-19 pneumonia at the time of “hyperinflammatory phase” in a 69-year-old unvaccinated woman with no underlying disease during Delta variant–dominant period. (E) Chest radiograph obtained 2 weeks after positive nucleic acid amplification test shows diffuse and extensive parenchymal opacity involving bilateral lungs. (F) Transverse nonenhanced CT scan (lung window) obtained at the level of carina and on the same day demonstrates diffuse and extensive areas of GGO with visible intralobular lines involving bilateral lungs. Also note pneumomediastinum at left paraaortic area (arrow). Even though the patient was treated with mechanical ventilation and extracorporeal membrane oxygenation, she succumbed to the disease.
CT findings of COVID-19 pneumonia according to RSNA CT classification
schemes. (A, B) “Typical” COVID-19 pneumonia according to the
RSNA chest CT classification system. (A) Transverse nonenhanced CT scan
(lung window) obtained in a 48-year-old unvaccinated man with a history of
hypertension and diabetes seen at the wild type–dominant period shows
bilateral areas of consolidation with peripheral distribution (arrows). (B)
Transverse nonenhanced CT scan (lung window) obtained in a 40-year-old
unvaccinated man with no underlying disease seen at the wild
type–dominant period shows patchy areas of mixed ground-glass opacity
(GGO) and consolidation with subpleural distribution (arrows). (C, D)
“Indeterminate” COVID-19 pneumonia according to the RSNA chest
CT classification system. (C) Transverse nonenhanced CT scan (lung window)
obtained in a 61-year-old unvaccinated woman with no underlying disease seen
at the wild type–dominant period shows focal area of GGO (arrow) in
left lower lobe. (D) Transverse nonenhanced CT scan (lung window) obtained
in a 65-year-old fully vaccinated man with hypertension, diabetes, and a
history of renal transplant seen at the Delta variant–dominant period
shows extensive areas of mixed GGO and consolidation without zonal
predominance. (E, F) “Atypical” COVID-19 pneumonia according
to the RSNA chest CT classification system. (E) Transverse nonenhanced CT
scan (lung window) obtained in a 42-year-old woman who received a booster
dose with no underlying disease seen at Omicron variant–dominant
period shows poorly defined small nodules (box) with peribronchial
distribution in the right lower lobe. (F) Transverse nonenhanced CT scan
(lung window) obtained in a 68-year-old unvaccinated man with history of
cerebrovascular accident seen at Omicron variant–dominant period
shows segmental area of consolidation (arrows) with air bronchogram in the
right upper lobe.
Figure 5:
CT findings of COVID-19 pneumonia according to RSNA CT classification schemes. (A, B) “Typical” COVID-19 pneumonia according to the RSNA chest CT classification system. (A) Transverse nonenhanced CT scan (lung window) obtained in a 48-year-old unvaccinated man with a history of hypertension and diabetes seen at the wild type–dominant period shows bilateral areas of consolidation with peripheral distribution (arrows). (B) Transverse nonenhanced CT scan (lung window) obtained in a 40-year-old unvaccinated man with no underlying disease seen at the wild type–dominant period shows patchy areas of mixed ground-glass opacity (GGO) and consolidation with subpleural distribution (arrows). (C, D) “Indeterminate” COVID-19 pneumonia according to the RSNA chest CT classification system. (C) Transverse nonenhanced CT scan (lung window) obtained in a 61-year-old unvaccinated woman with no underlying disease seen at the wild type–dominant period shows focal area of GGO (arrow) in left lower lobe. (D) Transverse nonenhanced CT scan (lung window) obtained in a 65-year-old fully vaccinated man with hypertension, diabetes, and a history of renal transplant seen at the Delta variant–dominant period shows extensive areas of mixed GGO and consolidation without zonal predominance. (E, F) “Atypical” COVID-19 pneumonia according to the RSNA chest CT classification system. (E) Transverse nonenhanced CT scan (lung window) obtained in a 42-year-old woman who received a booster dose with no underlying disease seen at Omicron variant–dominant period shows poorly defined small nodules (box) with peribronchial distribution in the right lower lobe. (F) Transverse nonenhanced CT scan (lung window) obtained in a 68-year-old unvaccinated man with history of cerebrovascular accident seen at Omicron variant–dominant period shows segmental area of consolidation (arrows) with air bronchogram in the right upper lobe.
COVID-19 pneumonia during Delta variant– and Omicron
variant–dominant periods. (A, B) Images of COVID-19 pneumonia at
Delta variant–dominant period. (A) Transverse nonenhanced CT scan
(lung window) obtained in a 34-year-old unvaccinated man with no underlying
disease shows multifocal areas of mixed ground-glass opacity (GGO) and
consolidation with subpleural (arrows) and peribronchial (arrowheads)
distribution. CT findings were classified as “typical”
according to the RSNA chest CT classification system. (B) Transverse
nonenhanced CT scan (lung window) obtained in a 58-year-old fully vaccinated
man with no underlying disease seen at Delta variant–dominant period
shows a focal subpleural area of consolidation (arrows) in superior segment
of right lower lobe. This case was classified as
“indeterminate” according to the RSNA chest CT classification
system. (C, D) COVID-19 pneumonia at Omicron variant–dominant period.
(C) Transverse nonenhanced CT scan (lung window) obtained in 56-year-old
unvaccinated woman with no underlying disease shows subpleural areas of
mixed GGO and consolidation (arrows) in both lower lobes. CT findings were
classified as “typical” according to the RSNA chest CT
classification system. (D) Transverse nonenhanced CT scan (lung window)
obtained in a 20-year-old man with no underlying disease who received a
booster dose shows poorly defined centrilobular nodules in the right upper
lobe (arrows). This case was considered “atypical” according
to the RSNA chest CT classification system.
Figure 6:
COVID-19 pneumonia during Delta variant– and Omicron variant–dominant periods. (A, B) Images of COVID-19 pneumonia at Delta variant–dominant period. (A) Transverse nonenhanced CT scan (lung window) obtained in a 34-year-old unvaccinated man with no underlying disease shows multifocal areas of mixed ground-glass opacity (GGO) and consolidation with subpleural (arrows) and peribronchial (arrowheads) distribution. CT findings were classified as “typical” according to the RSNA chest CT classification system. (B) Transverse nonenhanced CT scan (lung window) obtained in a 58-year-old fully vaccinated man with no underlying disease seen at Delta variant–dominant period shows a focal subpleural area of consolidation (arrows) in superior segment of right lower lobe. This case was classified as “indeterminate” according to the RSNA chest CT classification system. (C, D) COVID-19 pneumonia at Omicron variant–dominant period. (C) Transverse nonenhanced CT scan (lung window) obtained in 56-year-old unvaccinated woman with no underlying disease shows subpleural areas of mixed GGO and consolidation (arrows) in both lower lobes. CT findings were classified as “typical” according to the RSNA chest CT classification system. (D) Transverse nonenhanced CT scan (lung window) obtained in a 20-year-old man with no underlying disease who received a booster dose shows poorly defined centrilobular nodules in the right upper lobe (arrows). This case was considered “atypical” according to the RSNA chest CT classification system.
COVID-19 pneumonia during an Omicron BA.5
subvariant–predominant period in a 58-year-old man with a history of
lung transplant for idiopathic pulmonary fibrosis who had received a booster
dose of vaccine. (A) Chest radiograph obtained 7 days after positive nucleic
acid amplification test for COVID-19 shows parenchymal opacity involving
peripheral portion of both lower lungs. (B) Follow-up chest radiograph
obtained 2 days after the initial chest radiograph demonstrates increased
parenchymal opacity and extensive consolidation in the lungs. (C) Transverse
nonenhanced CT scan (lung window) obtained at the level of segmental bronchi
of both lower lobes 9 days after SARS-CoV-2 infection demonstrates extensive
areas of mixed ground-glass opacity (GGO) and consolidation, with a
peripheral predominance. (D, E) Follow-up transverse nonenhanced CT scans
(lung window) obtained at levels of inferior pulmonary veins (D) and
segmental bronchi of both lower lobes (E) 3 weeks after SARS-CoV-2 infection
demonstrate decreased extent of GGO and consolidation, but multiple nodules
(arrows) with or without cavity are scattered in bilateral lungs.
Galactomannan antigen test for Aspergillus was positive at this time. The
patient died with acute respiratory distress syndrome.
Figure 7:
COVID-19 pneumonia during an Omicron BA.5 subvariant–predominant period in a 58-year-old man with a history of lung transplant for idiopathic pulmonary fibrosis who had received a booster dose of vaccine. (A) Chest radiograph obtained 7 days after positive nucleic acid amplification test for COVID-19 shows parenchymal opacity involving peripheral portion of both lower lungs. (B) Follow-up chest radiograph obtained 2 days after the initial chest radiograph demonstrates increased parenchymal opacity and extensive consolidation in the lungs. (C) Transverse nonenhanced CT scan (lung window) obtained at the level of segmental bronchi of both lower lobes 9 days after SARS-CoV-2 infection demonstrates extensive areas of mixed ground-glass opacity (GGO) and consolidation, with a peripheral predominance. (D, E) Follow-up transverse nonenhanced CT scans (lung window) obtained at levels of inferior pulmonary veins (D) and segmental bronchi of both lower lobes (E) 3 weeks after SARS-CoV-2 infection demonstrate decreased extent of GGO and consolidation, but multiple nodules (arrows) with or without cavity are scattered in bilateral lungs. Galactomannan antigen test for Aspergillus was positive at this time. The patient died with acute respiratory distress syndrome.
Images of COVID-19 pneumonia with oxygen toxicity and barotrauma at
the time of Delta variant–dominant period in a 71-year-old
unvaccinated man with diabetes. (A) Chest radiograph obtained 10 days after
positive nucleic acid amplification test for COVID-19 shows extensive
parenchymal opacity involving bilateral lungs. He was transferred to the
intensive care unit due to worsening of hypoxemia and was given mechanical
ventilation with prolonged oxygen supply. (B) Follow-up chest radiograph
obtained 25 days after initial diagnosis of COVID-19 demonstrates
identifiable pneumomediastinum (black arrows) and subcutaneous emphysema
(white arrows) with parenchymal opacities. (C) Transverse and (D) coronal
reformatted images of nonenhanced CT scans depict mixed ground-glass
opacity, consolidation, and reticulation in the peripheral areas of both
lungs associated with interstitial emphysema (small arrows in C) causing
Macklin effect, pneumothorax (arrowhead), pneumomediastinum (black arrows)
and subcutaneous emphysema (white arrows in D). Note air cysts in the
anterior left lung (box in C). One month after receiving mechanical
ventilation with corticosteroid treatment, the patient recovered and was
discharged.
Figure 8:
Images of COVID-19 pneumonia with oxygen toxicity and barotrauma at the time of Delta variant–dominant period in a 71-year-old unvaccinated man with diabetes. (A) Chest radiograph obtained 10 days after positive nucleic acid amplification test for COVID-19 shows extensive parenchymal opacity involving bilateral lungs. He was transferred to the intensive care unit due to worsening of hypoxemia and was given mechanical ventilation with prolonged oxygen supply. (B) Follow-up chest radiograph obtained 25 days after initial diagnosis of COVID-19 demonstrates identifiable pneumomediastinum (black arrows) and subcutaneous emphysema (white arrows) with parenchymal opacities. (C) Transverse and (D) coronal reformatted images of nonenhanced CT scans depict mixed ground-glass opacity, consolidation, and reticulation in the peripheral areas of both lungs associated with interstitial emphysema (small arrows in C) causing Macklin effect, pneumothorax (arrowhead), pneumomediastinum (black arrows) and subcutaneous emphysema (white arrows in D). Note air cysts in the anterior left lung (box in C). One month after receiving mechanical ventilation with corticosteroid treatment, the patient recovered and was discharged.
Pulmonary embolisms in a 47-year-old unvaccinated diabetic man with
COVID-19 seen at Omicron variant–dominant period. (A) Transverse
nonenhanced CT scan (lung window) obtained at the level of basal trunks
shows bilateral mixed areas of ground-glass opacity and consolidation
distributed along bronchovascular bundles or subpleural lungs. (B)
Contrast-enhanced CT scan (mediastinal window) obtained at a similar level
to A demonstrates nonocclusive clots in bilateral basal trunk arteries
(arrows) along with lung parenchymal lesions.
Figure 9:
Pulmonary embolisms in a 47-year-old unvaccinated diabetic man with COVID-19 seen at Omicron variant–dominant period. (A) Transverse nonenhanced CT scan (lung window) obtained at the level of basal trunks shows bilateral mixed areas of ground-glass opacity and consolidation distributed along bronchovascular bundles or subpleural lungs. (B) Contrast-enhanced CT scan (mediastinal window) obtained at a similar level to A demonstrates nonocclusive clots in bilateral basal trunk arteries (arrows) along with lung parenchymal lesions.
Serial images in a 72-year-old man with COVID-19 pneumonia. (A)
Transverse nonenhanced CT scan (lung window) obtained at inferior pulmonary
vein level 1 week after SARS-CoV-2 infection shows lower
lobe–predominant patchy areas of ground-glass opacity (GGO) in
bilateral lungs (arrows). (B) Transverse nonenhanced CT scan (lung window)
obtained at inferior pulmonary vein level 1 month after SARS-CoV-2 infection
shows lower lobe–predominant patchy areas of consolidation (solid
arrows) in bilateral lungs. Note bronchial dilatation (open arrow) within
the consolidation. (C) Transverse nonenhanced CT scan (lung window) obtained
6 months after infection demonstrates residual reticulations (arrows) and
GGOs.
Figure 10:
Serial images in a 72-year-old man with COVID-19 pneumonia. (A) Transverse nonenhanced CT scan (lung window) obtained at inferior pulmonary vein level 1 week after SARS-CoV-2 infection shows lower lobe–predominant patchy areas of ground-glass opacity (GGO) in bilateral lungs (arrows). (B) Transverse nonenhanced CT scan (lung window) obtained at inferior pulmonary vein level 1 month after SARS-CoV-2 infection shows lower lobe–predominant patchy areas of consolidation (solid arrows) in bilateral lungs. Note bronchial dilatation (open arrow) within the consolidation. (C) Transverse nonenhanced CT scan (lung window) obtained 6 months after infection demonstrates residual reticulations (arrows) and GGOs.
Serial images in a 55-year-old man with COVID-19 pneumonia. (A)
Transverse nonenhanced CT scan (lung window) obtained at levels of basal
segmental bronchi 4 weeks after SARS-CoV-2 infection shows extensive and
patchy areas of mixed ground-glass opacity (GGO) and consolidation in
bilateral lungs. (B) Transverse nonenhanced CT scan (lung window) obtained 5
weeks after infection demonstrates increased density of GGO lesions with
consolidation. (C) Transverse nonenhanced CT scan (lung window) obtained 9
months after infection demonstrates residual faint GGO and
reticulations.
Figure 11:
Serial images in a 55-year-old man with COVID-19 pneumonia. (A) Transverse nonenhanced CT scan (lung window) obtained at levels of basal segmental bronchi 4 weeks after SARS-CoV-2 infection shows extensive and patchy areas of mixed ground-glass opacity (GGO) and consolidation in bilateral lungs. (B) Transverse nonenhanced CT scan (lung window) obtained 5 weeks after infection demonstrates increased density of GGO lesions with consolidation. (C) Transverse nonenhanced CT scan (lung window) obtained 9 months after infection demonstrates residual faint GGO and reticulations.
Serial images in a 64-year-old woman with COVID-19 pneumonia. (A)
Transverse nonenhanced CT scan (lung window) obtained at ventricular level 1
month after SARS-CoV-2 infection shows lower lobe–predominant patchy
and wide areas of mixed consolidation and ground-glass opacity (GGO) in
bilateral lungs. Note areas of bronchial dilatation (boxes) within
parenchymal lesions. Pneumomediastinum (arrows) is also present anteriorly.
(B) Transverse nonenhanced CT scan (lung window) obtained 12 months after
infection demonstrates dilated bronchi (boxes) within remaining GGO lesions.
Linear parenchymal bands (arrow) are also noted.
Figure 12:
Serial images in a 64-year-old woman with COVID-19 pneumonia. (A) Transverse nonenhanced CT scan (lung window) obtained at ventricular level 1 month after SARS-CoV-2 infection shows lower lobe–predominant patchy and wide areas of mixed consolidation and ground-glass opacity (GGO) in bilateral lungs. Note areas of bronchial dilatation (boxes) within parenchymal lesions. Pneumomediastinum (arrows) is also present anteriorly. (B) Transverse nonenhanced CT scan (lung window) obtained 12 months after infection demonstrates dilated bronchi (boxes) within remaining GGO lesions. Linear parenchymal bands (arrow) are also noted.

References

    1. WHO Coronavirus disease dashboard . World Health Organization . https://covid19.who.int/. Accessed November 11, 2022 .
    1. Rubin GD , Ryerson CJ , Haramati LB , et al . The Role of Chest Imaging in Patient Management during the COVID-19 Pandemic: A Multinational Consensus Statement from the Fleischner Society . Radiology 2020. ; 296 ( 1 ): 172 – 180 . - PMC - PubMed
    1. Wang W , Xu Y , Gao R , et al . Detection of SARS-CoV-2 in Different Types of Clinical Specimens . JAMA 2020. ; 323 ( 18 ): 1843 – 1844 . - PMC - PubMed
    1. Zou L , Ruan F , Huang M , et al . SARS-CoV-2 Viral Load in Upper Respiratory Specimens of Infected Patients . N Engl J Med 2020. ; 382 ( 12 ): 1177 – 1179 . - PMC - PubMed
    1. Jeong YJ , Nam BD , Yoo JY , et al . Prognostic Implications of CT Feature Analysis in Patients with COVID-19: a Nationwide Cohort Study . J Korean Med Sci 2021. ; 36 ( 8 ): e51 . - PMC - PubMed

Supplementary concepts