

Brain network decoupling with increased serum neurofilament and reduced cognitive function in Alzheimer's disease
- PMID: 36625756
- PMCID: PMC10316768
- DOI: 10.1093/brain/awac498
Brain network decoupling with increased serum neurofilament and reduced cognitive function in Alzheimer's disease
Abstract
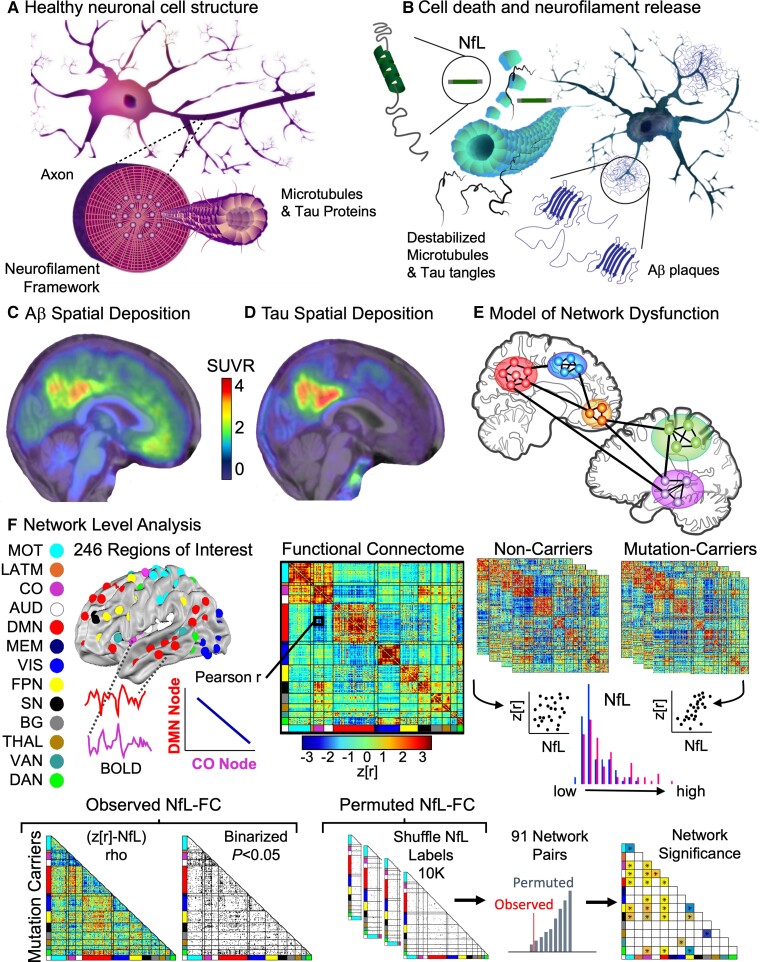
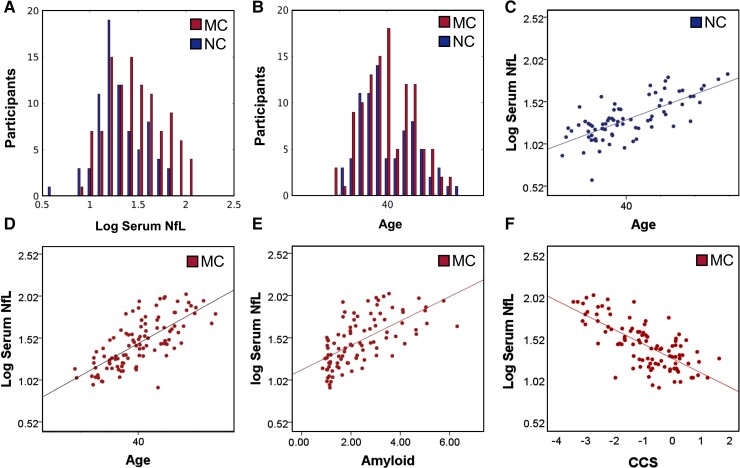
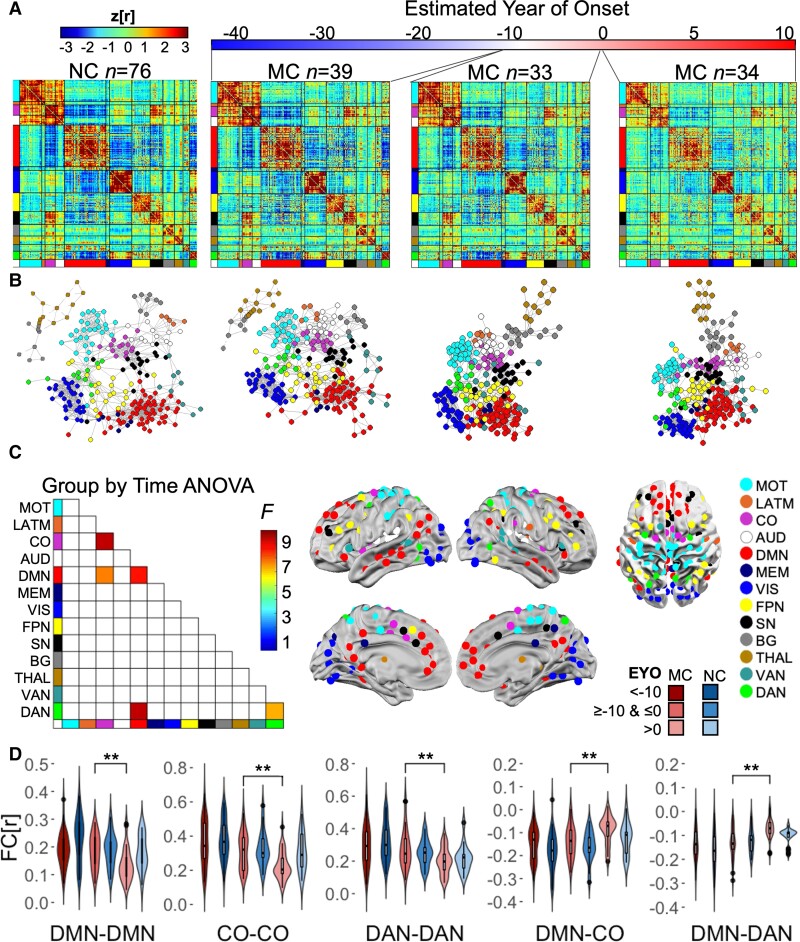
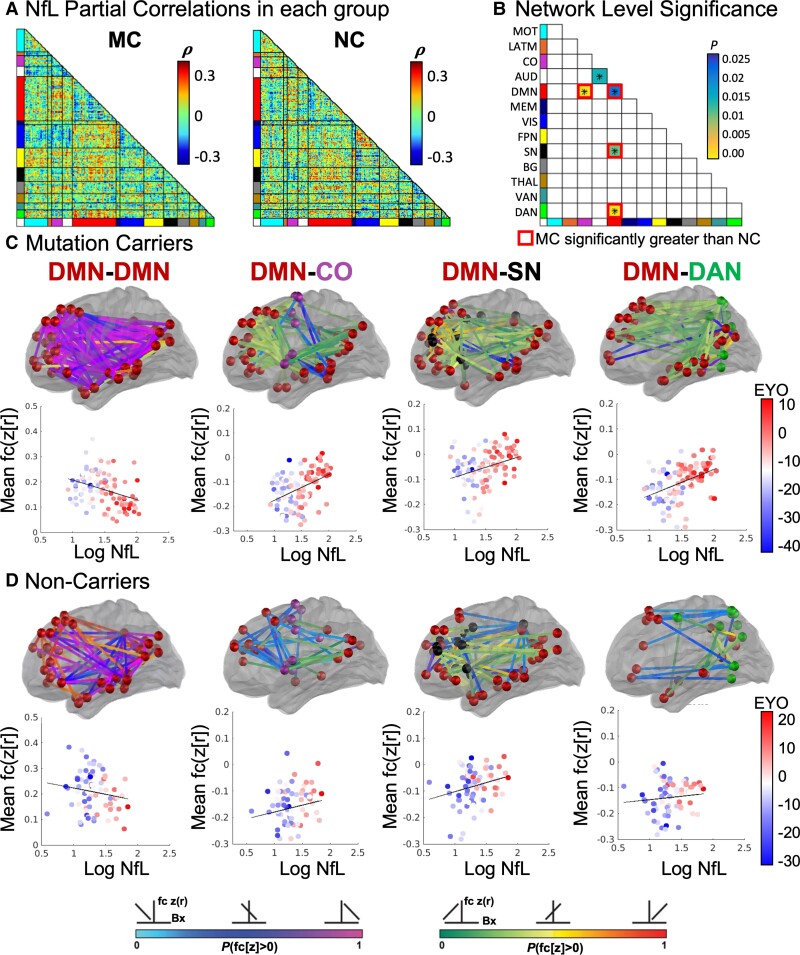
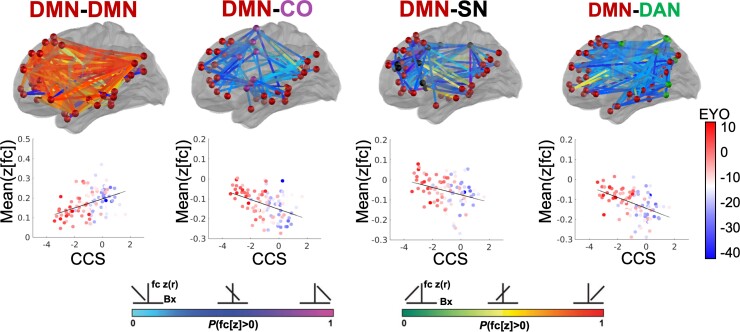
Neurofilament light chain, a putative measure of neuronal damage, is measurable in blood and CSF and is predictive of cognitive function in individuals with Alzheimer's disease. There has been limited prior work linking neurofilament light and functional connectivity, and no prior work has investigated neurofilament light associations with functional connectivity in autosomal dominant Alzheimer's disease. Here, we assessed relationships between blood neurofilament light, cognition, and functional connectivity in a cross-sectional sample of 106 autosomal dominant Alzheimer's disease mutation carriers and 76 non-carriers. We employed an innovative network-level enrichment analysis approach to assess connectome-wide associations with neurofilament light. Neurofilament light was positively correlated with deterioration of functional connectivity within the default mode network and negatively correlated with connectivity between default mode network and executive control networks, including the cingulo-opercular, salience, and dorsal attention networks. Further, reduced connectivity within the default mode network and between the default mode network and executive control networks was associated with reduced cognitive function. Hierarchical regression analysis revealed that neurofilament levels and functional connectivity within the default mode network and between the default mode network and the dorsal attention network explained significant variance in cognitive composite scores when controlling for age, sex, and education. A mediation analysis demonstrated that functional connectivity within the default mode network and between the default mode network and dorsal attention network partially mediated the relationship between blood neurofilament light levels and cognitive function. Our novel results indicate that blood estimates of neurofilament levels correspond to direct measurements of brain dysfunction, shedding new light on the underlying biological processes of Alzheimer's disease. Further, we demonstrate how variation within key brain systems can partially mediate the negative effects of heightened total serum neurofilament levels, suggesting potential regions for targeted interventions. Finally, our results lend further evidence that low-cost and minimally invasive blood measurements of neurofilament may be a useful marker of brain functional connectivity and cognitive decline in Alzheimer's disease.
Keywords: NfL; default mode network; enrichment; functional connectivity; neurodegeneration; resting state.
© The Author(s) 2023. Published by Oxford University Press on behalf of the Guarantors of Brain. All rights reserved. For permissions, please e-mail: journals.permissions@oup.com.
Conflict of interest statement
R.J.B. is Director of DIAN–TU and Principal Investigator of DIAN–TU-001. He receives research support from the NIA of the NIH, DIAN–TU trial pharmaceutical partners (Eli Lilly and Company, F. Hoffman-La Roche Ltd. and Avid Radiopharmaceuticals), Alzheimer’s Association, GHR Foundation, Anonymous Organization, DIAN–TU Pharma Consortium (active: Biogen, Eisai, Eli Lilly and Company, Janssen, F. Hoffmann-La Roche Ltd/Genentech; previous: AbbVie, Amgen, AstraZeneca, Forum, Mithridion, Novartis, Pfizer, Sanofi, United Neuroscience). He has been an invited speaker and consultant for AC Immune, F. Hoffman-La Roche Ltd. and Janssen and a consultant for Amgen and Eisai. A.M.F. has received research funding from the National Institute on Aging of the National Institutes of Health, Biogen, Centene, Fujirebio and Roche Diagnostics. She is currently a member of the scientific advisory boards for Roche Diagnostics and Genentech and consults for DiademRes, DiamiR and Siemens Healthcare Diagnostics. There are no conflicts. N.R.G.R. takes part in multicenter treatment studies sponsored by Biogen, Lilly, and AbbVie. J.L. reports personal fees from MODAG GmbH, personal fees from Bayer Vital, personal fees from Axon Neuroscience, non-financial support from AbbVie, personal fees from Thieme medical publishers, personal fees from W. Kohlhammer GmbH medical publishers, personal fees from Roche, personal fees from Biogen, outside the submitted work. P.R.S. reports grants from NIH (administered through Wash U), grants from Anonymous Foundation (administered through Wash U), and grants from Roth Charitable Foundation, during the conduct of the study. C.J. serves on an independent data monitoring board for Roche, has served as a speaker for Eisai, and consulted for Biogen, but he receives no personal compensation from any commercial entity. He receives research support from NIH, the GHR Foundation and the Alexander Family Alzheimer’s Disease Research Professorship of the Mayo Clinic. D.M.C. is supported by the UK Dementia Research Institute which receives its funding from DRI Ltd., funded by the UK Medical Research Council, Alzheimer’s Society and Alzheimer’s Research UK, as well as Alzheimer’s Research UK (ARUK-PG2017-1946) and the UCL/UCLH NIHR Biomedical Research Centre. T.L.S.B. has investigator-initiated research funding from the NIH, the Alzheimer’s Association, the Barnes-Jewish Hospital Foundation and Avid Radiopharmaceuticals (a wholly owned subsidiary of Eli Lilly). T.L.S.B. participates as a site investigator in clinical trials sponsored by Avid Radiopharmaceuticals, Eli Lilly, Biogen, Eisai, Jaansen, and Roche. She serves as an unpaid consultant to Eisai and Siemens. She is on the Speaker’s Bureau for Biogen.
Figures
References
Publication types
MeSH terms
Grants and funding
LinkOut - more resources
Full Text Sources
Medical
