. 2023 Mar 6;155(3):e202213259.
doi: 10.1085/jgp.202213259. Epub 2023 Jan 10.

Multiscale molecular dynamics simulations predict arachidonic acid binding sites in human ASIC1a and ASIC3 transmembrane domains

Affiliations

Multiscale molecular dynamics simulations predict arachidonic acid binding sites in human ASIC1a and ASIC3 transmembrane domains

Anna Ananchenko et al. J Gen Physiol. .

Abstract

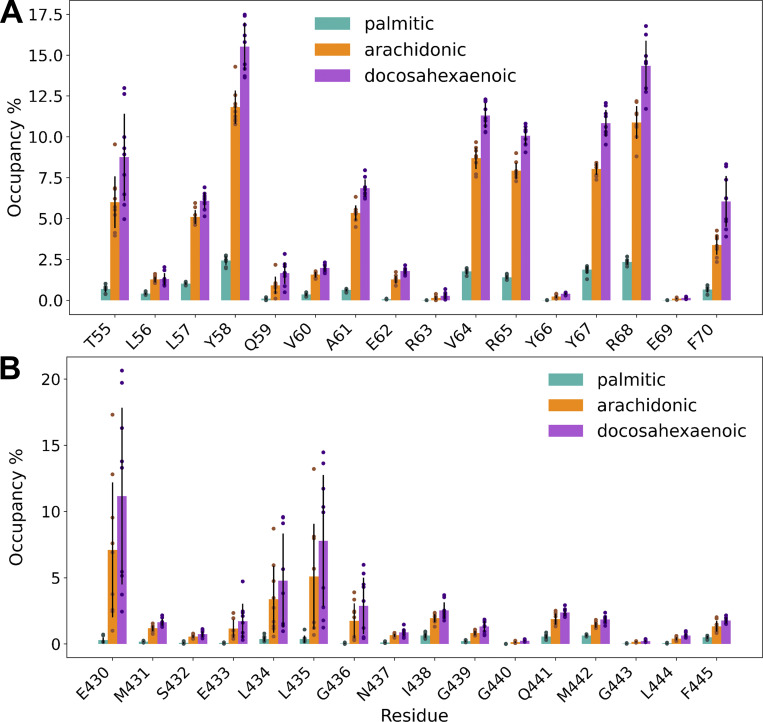
Acid-sensing ion channels (ASICs) play important roles in inflammatory pathways by conducting ions across the neuronal membrane in response to proton binding under acidic conditions. Recent studies have shown that ASICs can be modulated by arachidonic acid (AA), and, in the case of the ASIC3 subtype, even activated by AA at physiological pH. However, the mechanism by which these fatty acids act on the channel is still unknown. Here, we have used multiscale molecular dynamics simulations to predict a putative, general binding region of AA to models of the human ASIC protein. We have identified, in agreement with recent studies, residues in the outer leaflet transmembrane region which interact with AA. In addition, despite their similar modulation, we observe subtle differences in the AA interaction pattern between human ASIC1a and human ASIC3, which can be reversed by mutating three key residues at the outer leaflet portion of TM1. We further probed interactions with these residues in hASIC3 using atomistic simulations and identified possible AA coordinating interactions; salt bridge interactions of AA with R65hASIC3 and R68hASIC3 and AA tail interactions with the Y58hASIC3 aromatic ring. We have shown that longer fatty acid tails with more double bonds have increased relative occupancy in this region of the channel, a finding supported by recent functional studies. We further proposed that the modulatory effect of AA on ASIC does not result from changes in local membrane curvature. Rather, we speculate that it may occur through structural changes to the ion channel upon AA binding.


Figures

Figure 1.
Figure 1.
Model of the hASIC3 and structure of PUFAs. (A) Homology model of hASIC3. One subunit of the trimer is highlighted in color while the rest of the channel is shown in transparent gray cartoon. The ECD is shown in orange cartoon, while the TMD is in blue cartoon, with TM1 in royal blue and TM2 in dark cyan. The dashed lines illustrate the approximate position of the membrane. (B) Surface representation of the open state of hASIC3, colored as in A. Residues R63hASIC3, R65hASIC3, and R68hASIC3 are highlighted in cyan and labeled in one subunit. The dashed triangle indicates the location of lateral fenestrations. (C) Structures of AA (20:4, top) and DHA (22:6, bottom).
Figure 2.
Figure 2.
AA accumulates around ASICs. AA headgroup occupancy maps colored by occupancy as a fraction of frames. (A) Occupancy of AA headgroups, as defined by the charged COO bead, around hASIC3 channel. (B) Occupancy of AA headgroups around hASIC1 channel. (C) Occupancy of a subsample of 60 randomly selected POPC headgroups, as defined by the PO4 bead, around hASIC3 channel. Maps show an average of occupancy across three repeats of 30 μs simulations for each system. The systems were aligned on the TMD of the protein prior to calculating the occupancy. Top-down view of hASIC3 homology model TMD is displayed as surface and colored as in Fig. 1. (D) Left: Example of calculated AA density from 500 ns atomistic simulation of hASIC3 open state. Middle: Example of calculated POPC density from 100 ns atomistic simulation. Right: Electron density attributed to lipids in recently solved chicken ASIC1 desensitized state structure (PDB: 6VTK; Yoder et al., 2020).
Figure S1.
Figure S1.
Selection of distance cutoffs for PyLipID analysis. (A) Minimum distance between AA headgroup bead and sidechain of any interacting residue over a 30 µs simulation. Contacts start at ∼4.1 Å and peak at 5 Å. (B) Number of detected binding sites (based on PyLipID software network analysis) as a product of selected cut-off pairs, with cut-off pairs shown on the x-axis as (lower, upper). Any pair with a lower cutoff of 4.75 Å yielded the largest number of detected binding sites.
Figure 3.
Figure 3.
AA participates in longer interactions with hASIC3 open state compared to resting state. (A) Occupancies of AA at TM1 residues for the hASIC3 open state in cyan and the resting state in light blue. (B) Average interaction duration of AA at TM1 residues. All values calculated as averages over three chains in three repeats of 30 µs (i.e., each value is an average of nine samples). Standard deviations are shown as black lines. Bars represent averages, while points represent individual samples.
Figure 4.
Figure 4.
AA interacts preferably with residues located at the extracellular side of TM1. AA occupancy at residues in the upper region of the TM1 and TM2 helices calculated as averages over three chains in three repeats of 30 µs each. Residues on the x-axis are labeled with the hASIC3 residue on the left and the hASIC1a residue on the right, in the form hASIC3/hASIC1a. (A) Occupancies of AA at TM1 residues for hASIC3 in cyan and hASIC1a in orange. Black lines show standard deviations, bars show averages, and points show individual samples. (B) Occupancies of AA at TM2 residues (colors like A). (C) The same occupancy information as in A and B presented as a heatmap superimposed on models of hASIC1a and hASIC3.
Figure 5.
Figure 5.
Interaction site residues differ between subunit types. (A) Alignment of the upper part of TM1 for ASIC1 and ASIC3 subtypes from different species. (B) Representative binding pose (CG representation) of AA at conserved ASIC3 residues determined by PyLipID clustering analysis, as described in Song et al. (2022). The red bead near R65 represents the charged headgroup as defined by the COO bead.
Figure 6.
Figure 6.
AA shows long-lived interactions with protein sites in atomistic simulations. (A) Time-resolved occupancy of AA at three sites in one of three 500 ns repeats of a backmapped atomistic setup. Dark blue indicates presence of AA, i.e., when the carboxylic acid carbon of AA is within 4.5 Å of the R65hASIC3 sidechain. (B) Distances between the carboxylic acid carbon of AA and ζ-carbon of R65hASIC3 over time of three initially bound AA molecules at three chains. (C) An example of a putative salt bridge interaction between the headgroup of AA and guanidinium groups of R65hASIC3 and R68 hASIC3, with a potential van der Waals interaction of the AA tail with Y58hASIC3. The protein structure is shown in cyan cartoon, while residues of interest are shown as sticks with carbon atoms colored in cyan. AA is shown as stick representation with carbon atoms colored in orange.
Figure S2.
Figure S2.
Interactions between AA headgroup and R65hASIC3 in atomistic simulations. (A) Time-resolved occupancy of AA at three sites in two 500 ns repeats of a backmapped atomistic simulations. Dark blue indicates presence of AA, i.e., when the carboxylic acid carbon of AA is within 4.5 Å of the R65hASIC3 sidechain. (B) Distances between the carboxylic acid carbon of AA and ζ-carbon of R65hASIC3 over time of initially bound AA molecules at hASIC3 subunits in two 500 ns atomistic simulation repeats.
Figure 7.
Figure 7.
Mutations to three key residues change AA interaction pattern. (A) AA occupancy comparison between WT hASIC3 (cyan) and triple mutant hASIC3 (orange). The occupancy data is averaged over three chains from three repeats simulated for 30 µs each, and standard deviations are shown with black lines. Bars show averages while points show individual samples. Residue numbering corresponds to hASIC3. (B) AA occupancy comparison between WT hASIC3 (cyan) and triple mutant hASIC1a (orange). Mutated residues are indicated with arrowheads. Residue numbering corresponds to hASIC1a.
Figure 8.
Figure 8.
Fatty acid tail length and saturation affect interactions with hASIC3. (A) Occupancies of palmitic (C16:0), arachidonic (C20:4), and docosahexaenoic (C22:6) acid at the TM1 helix. (B) Occupancies of palmitic, arachidonic, and docosahexaenoic acid at the TM2 helix. The occupancy data is averaged over three chains from three repeats simulated for 30 µs each, and standard deviations are shown with black lines. Bars represent averages while points represent individual samples.
Figure 9.
Figure 9.
Average upper leaflet membrane curvature around ASIC3 TMD in 10% AA and 0% AA membranes. (A) Local membrane curvature averaged over each of the three repeats of 500 ns atomistic simulations in membranes containing 10% AA. Surface is colored by degree of deviation from membrane normal; positive deviation is colored in blue and negative deviation is colored in red. Analysis developed by Lea Thøgersen, as used in Sonntag et al. (2011). (B) Local membrane curvature in three repeats of 500 ns atomistic simulations in POPC-only membranes. (C) Local membrane curvature with embedded ASIC3 average structure (cyan cartoon) in one simulation repeat with a membrane containing 10% AA.
Figure 10.
Figure 10.
Potential salt bridge between R63hASIC3 and E430hASIC3. (A) Top-down view of the transmembrane domain of a structure of the cASIC1 resting state (PDB: 5WKU) shown as cyan cartoon. Conserved residues R65cASICa and E413cASIC1 are shown as sticks. (B) The same representation as A, however, of the open state structure of cASIC1 (PDB: 4NTW). A change in the position of R65cASIC1 and E413cASIC1 suggests a breaking of this salt bridge in the open state of the channel upon rotation and opening of the TM helices. (C) Position of residues R63hASIC3 and E430hASIC3 sampled in one atomistic simulation of the resting hASIC3 state. (D) Position of residues R63hASIC3 and E430hASIC3 sampled in one atomistic simulation of the open hASIC3 state.

Comment in

Similar articles

Cited by

References

    1. Abraham, M.J., Murtola T., Schulz R., Páll S., Smith J.C., Hess B., and Lindahl E.. 2015. GROMACS: High performance molecular simulations through multi-level parallelism from laptops to supercomputers. SoftwareX. 1–2:19–25. 10.1016/j.softx.2015.06.001 - DOI
    1. Allen, N.J., and Attwell D.. 2002. Modulation of ASIC channels in rat cerebellar Purkinje neurons by ischaemia-related signals. J. Physiol. 543:521–529. 10.1113/jphysiol.2002.020297 - DOI - PMC - PubMed
    1. Ananchenko, A., Hussein T.O.K., Mody D., Thompson M.J., and Baenziger J.E.. 2022. Recent insight into lipid binding and lipid modulation of pentameric ligand-gated ion channels. Biomolecules. 12:814. 10.3390/biom12060814 - DOI - PMC - PubMed
    1. Baconguis, I., Bohlen C.J., Goehring A., Julius D., and Gouaux E.. 2014. X-ray structure of acid-sensing ion channel 1-snake toxin complex reveals open state of a Na(+)-selective channel. Cell. 156:717–729. 10.1016/j.cell.2014.01.011 - DOI - PMC - PubMed
    1. Baenziger, J.E., Morris M.L., Darsaut T.E., and Ryan S.E.. 2000. Effect of membrane lipid composition on the conformational equilibria of the nicotinic acetylcholine receptor. J. Biol. Chem. 275:777–784. 10.1074/jbc.275.2.777 - DOI - PubMed

Publication types