. 2023 Feb 15;133(4):e158352.
doi: 10.1172/JCI158352.

UBC9 deficiency enhances immunostimulatory macrophage activation and subsequent antitumor T cell response in prostate cancer

Affiliations

UBC9 deficiency enhances immunostimulatory macrophage activation and subsequent antitumor T cell response in prostate cancer

Jun Xiao et al. J Clin Invest. .

Abstract

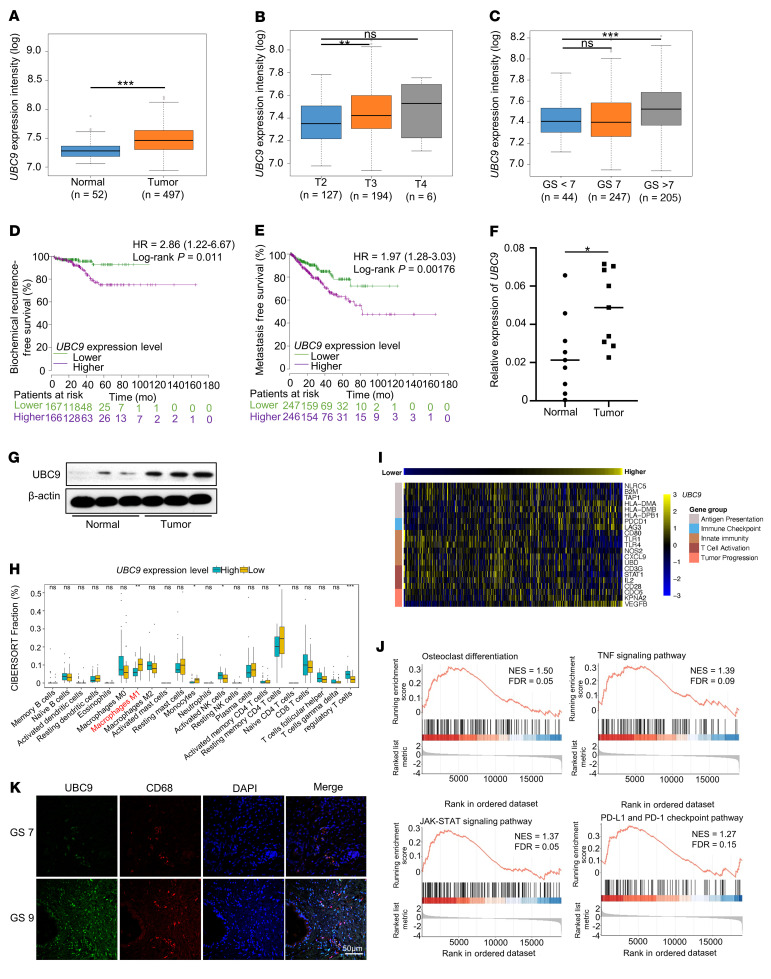
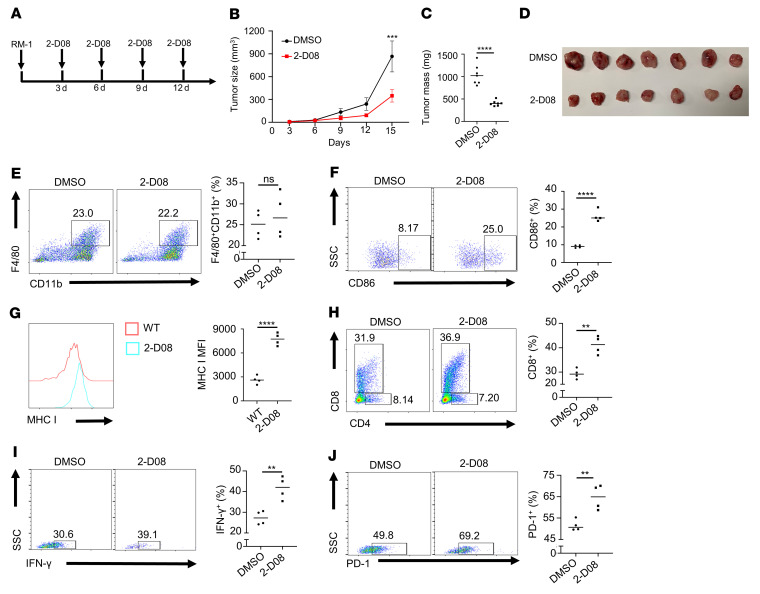
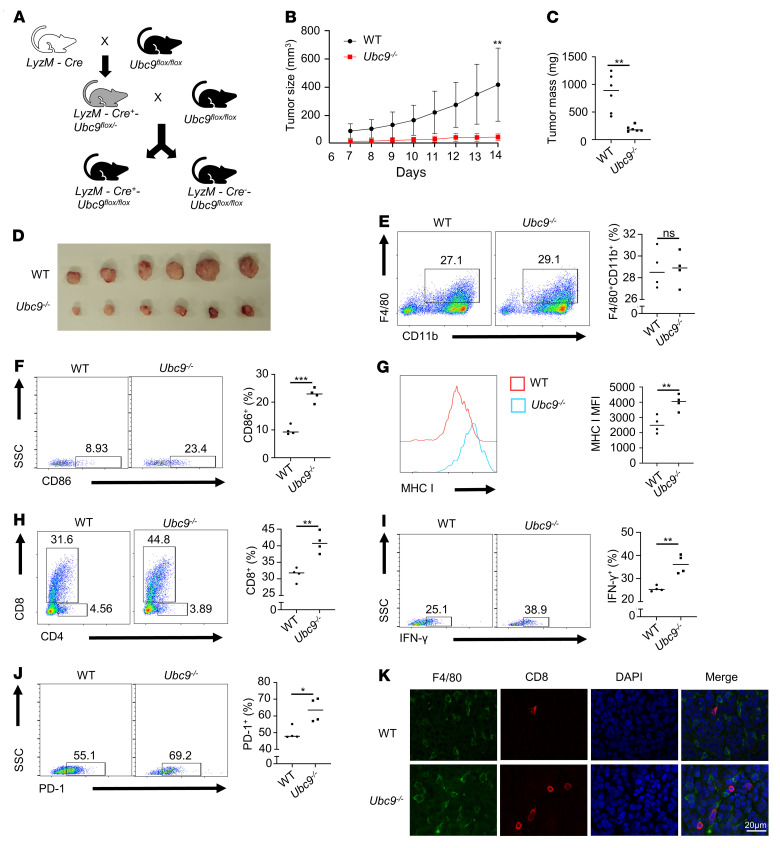
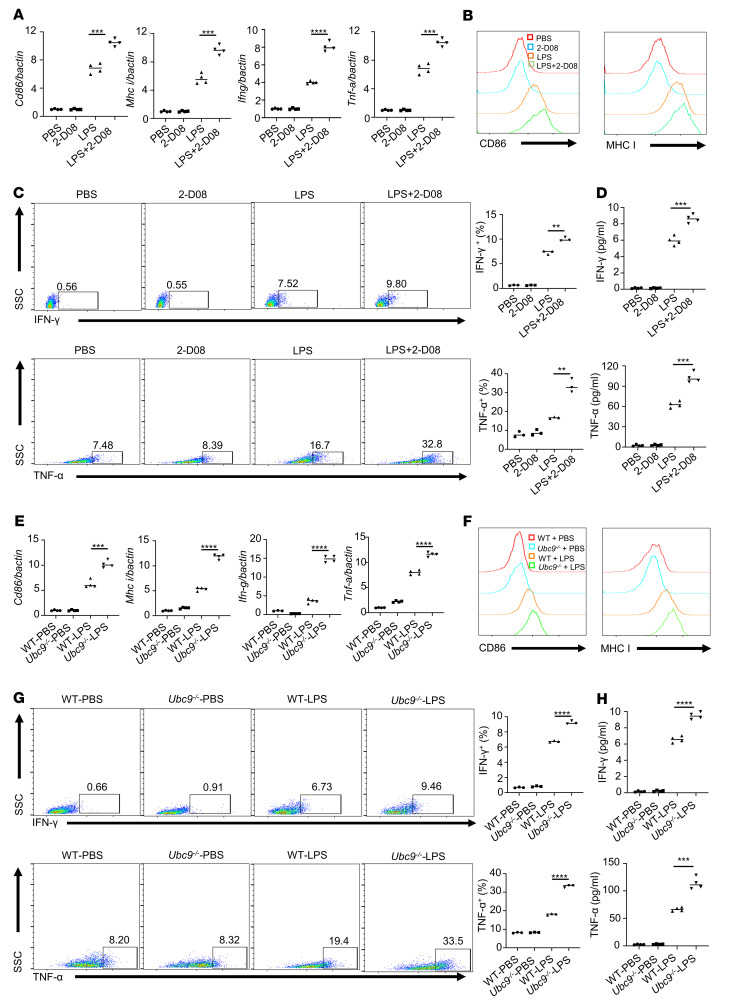
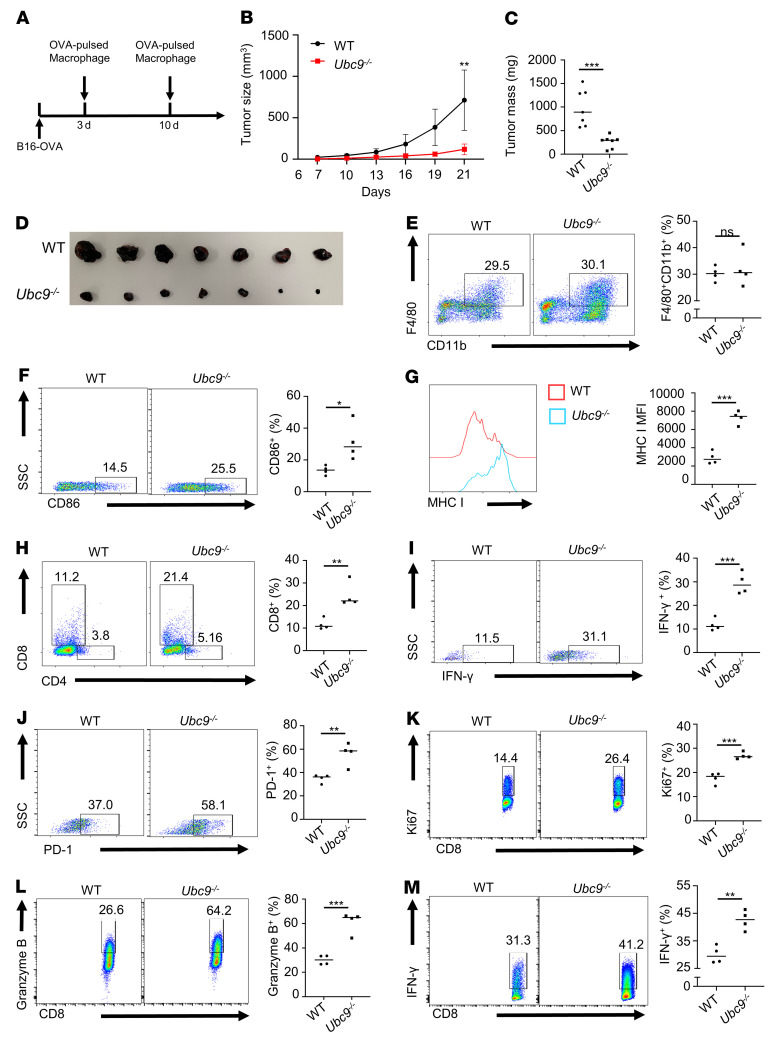
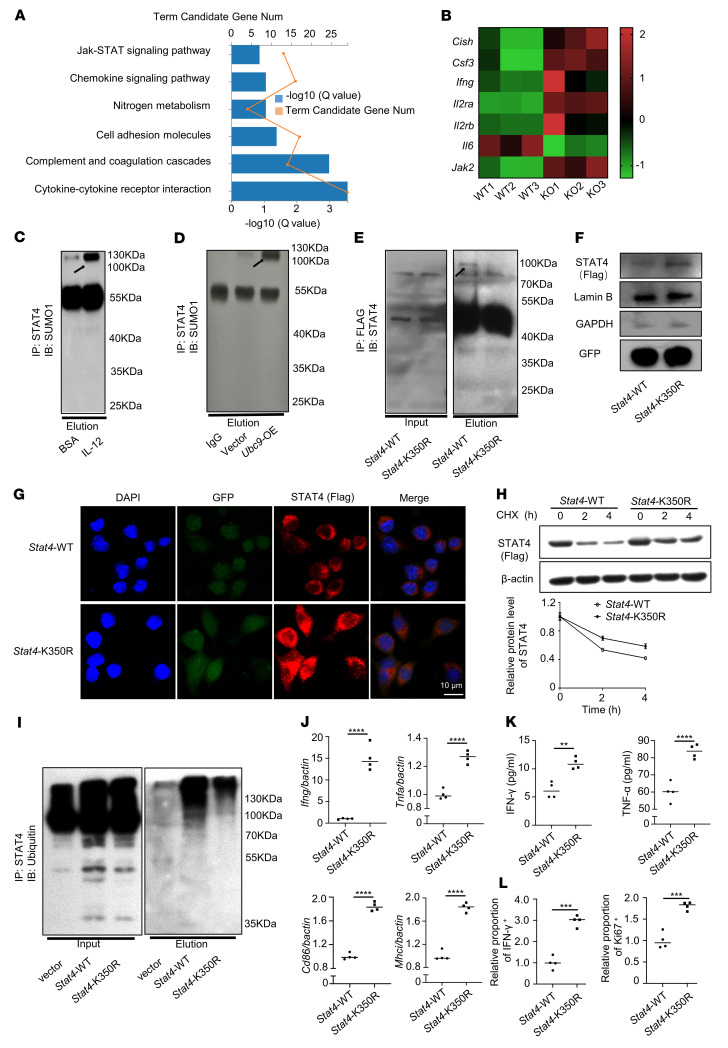
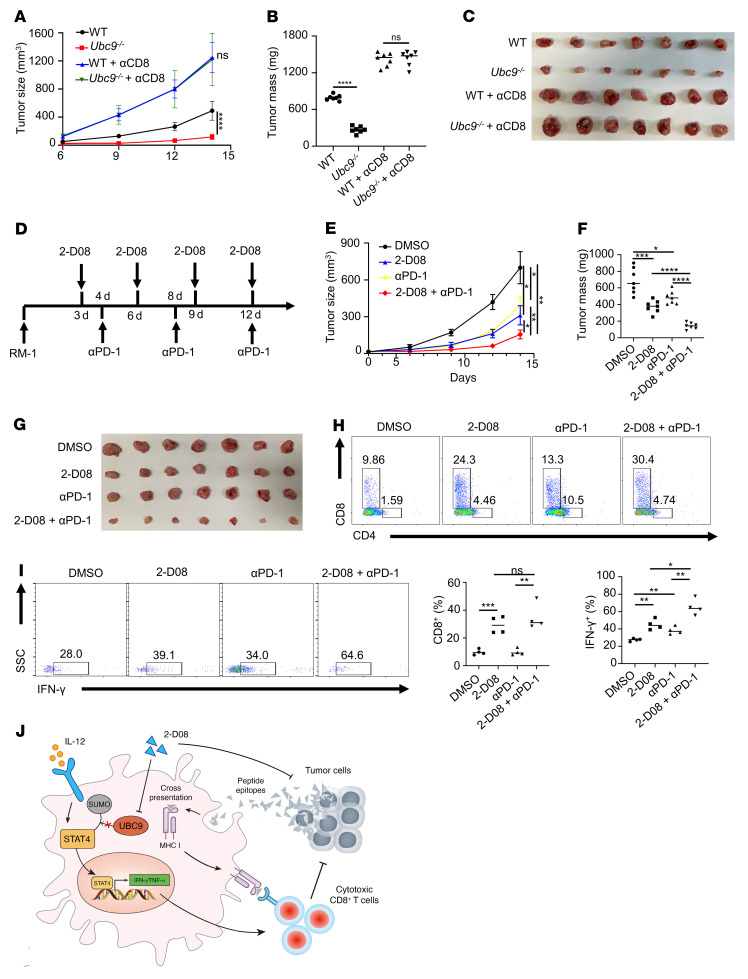
The role of tumor-associated macrophages (TAMs), along with the regulatory mechanisms underlying distinct macrophage activation states, remains poorly understood in prostate cancer (PCa). Herein, we report that PCa growth in mice with macrophage-specific Ubc9 deficiency is substantially suppressed compared with that in wild-type littermates, an effect partially ascribed to the augmented CD8+ T cell response. Biochemical and molecular analyses revealed that signal transducer and activator of transcription 4 (STAT4) is a crucial UBC9-mediated SUMOylation target, with lysine residue 350 (K350) as the major modification site. Site-directed mutation of STAT4 (K350R) enhanced its nuclear translocation and stability, thereby facilitating the proinflammatory activation of macrophages. Importantly, administration of the UBC9 inhibitor 2-D08 promoted the antitumor effect of TAMs and increased the expression of PD-1 on CD8+ T cells, supporting a synergistic antitumor efficacy once it combined with the immune checkpoint blockade therapy. Together, our results demonstrate that ablation of UBC9 could reverse the immunosuppressive phenotype of TAMs by promoting STAT4-mediated macrophage activation and macrophage-CD8+ T cell crosstalk, which provides valuable insights to halt the pathogenic process of tumorigenesis.

Keywords: Cancer immunotherapy; Immunology; Macrophages; Oncology; Prostate cancer.


Figures

Figure 1
Figure 1. UBC9 expression is associated with defective macrophage activation and poor prognosis of PCa.
(A) Results based on The Cancer Genome Atlas (TCGA) database showing the expression level of UBC9 between prostate tumor and adjacent normal prostate tissue. Data are presented as median value, n = 549. (B) Results based on TCGA database indicating the expression level of UBC9 at different stages of PCa. Data are presented as median value, n = 327. (C) Results based on TCGA database indicating the expression level of UBC9 in different tumor grades stratified by Gleason score (GS) in PCa. Data are presented as median value, n = 496. (D and E) Biochemical recurrence survival rates (D) and metastasis-free survival rates (E) of PCa from TCGA database with high or low UBC9 expression as defined by the median value. Statistical significance was determined by log-rank (Mantel-Cox) test, n = 497. (F and G) The expression levels of UBC9 were identified by real-time qPCR (n = 9 per group) (F) and Western blotting (G). (H) CIBERSORT analysis characterized 22 types of immune cell composition in PCa of TCGA; n = 497. (I) Based on the TCGA database, the heatmap shows the correlation between UBC9 expression level and genes involved in immune processes. Statistical significance was determined by Pearson’s correlation test, n = 497. (J) Gene set enrichment analysis showed the enrichment of signature genes in UBC9hi prostate tumor. (K) Prostate tissue from PCa patients in Gleason score 7 and Gleason score 9 stained for UBC9 and CD68. Representative images for immunofluorescence staining of 5 tissue samples per group. Scale bar: 50 μm. *P < 0.05; **P < 0.01; ***P < 0.001.
Figure 2
Figure 2. Inhibition of UBC9 represses the progression of PCa.
(A) Schematic representation of treatment of WT mice using the UBC9 inhibitor 2-D08. (B) Growth of subcutaneous RM-1 tumors in WT mice treated with DMSO or 2-D08 (n = 7 per group). (C and D) WT mice bearing RM-1 tumors received intratumoral injections of DMSO or 2-D08. After 11 days of treatment, the mice were sacrificed, and the tumors were weighed (n = 7 per group). (E) Representative dot plots and proportions of TAMs (F4/80+; CD11b+) on day 14 (n = 4 per group). (F) Representative dot plots and proportions of CD86+ TAMs from tumor-bearing mice treated with DMSO or 2-D08 (n = 4 per group). (G) MHC I expression level on TAMs from tumor-bearing mice treated with DMSO or 2-D08 (n = 4 per group). (H) Representative dot plots and proportions of tumor-infiltrating CD8+ T cells among CD45+ immune cells in DMSO- or 2-D08–treated mice (n = 4 per group). (I and J) Representative dot plots and proportions of IFN-γ+ (I) and PD-1+ (J) tumor-infiltrating CD8+ T cells (n = 4 per group). B was determined by log-rank test. Data in C and EJ represent mean ± SEM and were analyzed by Student’s t test (2 tailed). **P < 0.01; ***P < 0.001; ****P < 0.0001.
Figure 3
Figure 3. Ubc9 deficiency in macrophages suppresses the progression of PCa.
(A) Ubc9fl/fl mice were crossed with LyzM-Cre transgenic mice to generate the macrophage-specific Ubc9-knockout mice, which were denoted as LyzM-Cre+Ubc9fl/fl. (BD) Tumor growth curve (B) and tumor mass (C and D) at day 14 in WT and Ubc9–/– groups (n = 7 per group). (E) Proportion of TAMs among CD45+ immune cells from WT and Ubc9–/– groups (n = 4 per group). (F) Proportion of CD86+ TAMs in WT and Ubc9–/– groups (n = 4 per group). (G) MHC I expression level on TAMs in WT and Ubc9–/– groups (n = 4 per group). (H) Proportion of tumor-infiltrating CD8+ T cells among CD45+ immune cells in WT and Ubc9–/– groups (n = 4 per group). (I and J) Proportion of IFN-γ+ (I) and PD-1+ (J) tumor-infiltrating CD8+ T cells in WT and Ubc9–/– groups (n = 4 per group). (K) Tumors from WT and Ubc9–/– mice were isolated, fixed, embedded in paraffin, sectioned, and stained for F4/80 (green) and CD8 (red). Similar results were obtained from 3 independent experiments. B was determined by log-rank test. Data in C and EJ represent mean ± SEM and were analyzed by Student’s t test. Scale bar: 20 μm. *P < 0.05; **P < 0.01; ***P < 0.001.
Figure 4
Figure 4. Loss of Ubc9 facilitates macrophage activation.
(A) Real-time qPCR analysis of Cd86, Mhc-i, Ifn-g, and Tnf-a in macrophages treated with PBS, 2-D08, LPS, and LPS plus 2-D08. (B) Representative histogram measuring the expression levels of CD86 and MHC I and the MFI of each marker in the above-mentioned 4 groups. (C) Proportions of IFN-γ+ and TNF-α+ macrophages in the above-mentioned 4 groups. (D) ELISA analysis of secreted IFN-γ and TNF-α in the 4 groups of macrophages. (E) Real-time qPCR analysis of Cd86, Mhc-i, Ifn-g, and Tnf-a in WT and Ubc9–/– macrophages treated with PBS or LPS. (F) Representative histogram measuring the expression levels of CD86 and MHC I and the MFI of each marker in WT and Ubc9–/– macrophages treated by PBS or LPS. (G) Proportions of IFN-γ+ and TNF-α+ cells in WT and Ubc9–/– macrophages treated with PBS or LPS. (H) ELISA analysis of secreted IFN-γ and TNF-α in the 2 groups of macrophages treated with PBS or LPS. Data represent mean ± SEM and were analyzed by Student’s t test (n = 4 per comparison group). Similar results were obtained from 3 independent experiments. **P < 0.01; ***P < 0.001; ****P < 0.0001.
Figure 5
Figure 5. Loss of Ubc9 in macrophages activates antigen-specific CD8+ T cells.
(A) Experimental design for macrophage adoptive transfer in mice bearing B16-OVA tumors. (BD) Tumor growth curve (B) and tumor mass (C and D) of B16-OVA melanoma at day 14 in the 2 groups transferred with OVA-pulsed WT or Ubc9–/– macrophages (n = 7 per group). (E) Proportion of TAMs among CD45+ immune cells in these 2 groups (n = 4 per group). (F) Proportion of CD86+ TAMs in these 2 groups (n = 4 per group). (G) MHC I expression level on TAMs in these 2 groups (n = 4 per group). (H) Proportion of tumor-infiltrating CD8+ T cells among CD45+ immune cells in these 2 groups (n = 4 per group). (I and J) Proportions of IFN-γ+ (I) and PD-1+ (J) tumor-infiltrating CD8+ T cells in these 2 groups (n = 4 per group). (KM) Proportions of Ki67+ (K), granzyme B+ (L), and IFN-γ+ (M) CD8+ T cells in coculture assay with OVA-pulsed WT or Ubc9–/– macrophages and OT-I CD8+ T cells (n = 4 per group). B was determined by log-rank test. Data in C and EM represent mean ± SEM and were analyzed by Student’s t test. *P < 0.05; **P < 0.01; ***P < 0.001.
Figure 6
Figure 6. UBC9-mediated STAT4 SUMOylation inhibits macrophage activation.
(A) TAMs were sorted and analyzed by RNA-Seq from WT and Ubc9–/– PCa-bearing mice. Gene Ontology analysis demonstrated the enriched pathways in TAMs. (B) Heatmap showing genes associated with the JAK/STAT signaling pathway. (C) Immunoprecipitation identified STAT4 SUMOylation in BMDMs treated with BSA or IL-12. (D) SUMOylated STAT4 was obviously detected in BMDMs transduced with Ubc9-overexpressing (Ubc9-OE) adenovirus. (E) SUMOylated STAT4 was detected in BMDMs transduced with FLAG-tagged Stat4-WT but not Stat4-K350R after endogenous Stat4 was knocked down. (F) Western blotting was used to analyze nuclear STAT4 expression in macrophages transduced with FLAG-tagged Stat4-WT and Stat4-K350R adenoviruses after endogenous Stat4 was knocked down by siRNA. (G) Macrophages transduced with FLAG-tagged Stat4-WT and Stat4-K350R after knockdown of endogenous Stat4 were costained with anti-FLAG (red) and DAPI (blue) and imaged with confocal microscopy. (H) Transduced macrophages were pretreated with CHX for the indicated times, and STAT4 (FLAG-tagged) protein levels were analyzed. (I) Transduced macrophages were pretreated with CHX plus MG-132, and immunoprecipitation was conducted to identify ubiquitination level of STAT4 in the 2 groups. (J) Transcription levels of Ifn-g, Tnf-a, Cd86, and Mhc-i in virus-transduced macrophages quantified by real-time qPCR (n = 4 per group). (K) ELISA was conducted to check the secreted IFN-γ and TNF-α of virus-transduced macrophages (n = 4 per group). (L) Macrophages transduced with Stat4-WT or Stat4-K350R after endogenous Stat4 knockdown were cocultured with CD8+ T cells in the presence of anti-CD3. The proportions of Ki67+ and IFN-γ+ CD8+ T cells were examined (n = 4 per group). CI represent at least 2 independent experiments. Data in JL represent mean ± SEM and were analyzed by Student’s t test. **P < 0.01; ***P < 0.001; ****P < 0.0001.
Figure 7
Figure 7. Inhibition of UBC9 represses prostate tumor growth synergistically with anti–PD-1 therapy.
(AC) Tumor growth curve (A) and tumor mass (B and C) following CD8+ T cell depletion at day 14 in WT and Ubc9–/– mice bearing PCa tumors (n = 7 per group). (D) Experimental design of combined therapy using 2-D08 and anti–PD-1 antibody in prostate tumors. (EG) Prostate tumor growth curve (E) and tumor mass (F and G) at day 14 in PCa-bearing mice treated with DMSO, 2-D08, anti–PD-1 antibody, or 2-D08 plus anti–PD-1 antibody (n = 7 per group). (H) Percentage of CD4+ and CD8+ T cells among CD45+ immune cells in the 4 groups (n = 4 per group). (I) Proportions of IFN-γ+ CD8+ T cells in the 4 groups (n = 4 per group). A and E were determined by log-rank test. Data in B, F, and I represent mean ± SEM and were analyzed by Student’s t test. *P < 0.05; **P < 0.01; ***P < 0.001; ****P < 0.0001. (J) Schematic model depicting the antitumor effect of UBC9 inhibition in TAMs. Inhibition of STAT4 SUMOylation leads to TAM activation and enhanced antigen cross-presentation to CD8+ T cells, which are responsible for the cytotoxicity on PCa cells. Alternatively, the UBC9 inhibitor 2-D08 exerts a direct tumor-killing effect, leading to the release of tumor-associated antigens.

References

    1. Dai J, et al. Immune mediators in the tumor microenvironment of prostate cancer. Chin J Cancer. 2017;36(1):29. doi: 10.1186/s40880-017-0198-3. - DOI - PMC - PubMed
    1. Mercader M, et al. T cell infiltration of the prostate induced by androgen withdrawal in patients with prostate cancer. Proc Natl Acad Sci U S A. 2001;98(25):14565–14570. doi: 10.1073/pnas.251140998. - DOI - PMC - PubMed
    1. Chen DS, Mellman I. Elements of cancer immunity and the cancer-immune set point. Nature. 2017;541(7637):321–330. doi: 10.1038/nature21349. - DOI - PubMed
    1. Solinas C, et al. The immune infiltrate in prostate, bladder and testicular tumors: an old friend for new challenges. Cancer Treat Rev. 2017;53:138–145. doi: 10.1016/j.ctrv.2016.12.004. - DOI - PubMed
    1. Cassetta L, Pollard JW. Targeting macrophages: therapeutic approaches in cancer. Nat Rev Drug Discov. 2018;17(12):887–904. doi: 10.1038/nrd.2018.169. - DOI - PubMed

Publication types

Substances