. 2023 Feb 15;133(4):e162870.
doi: 10.1172/JCI162870.

SHP2 deneddylation mediates tumor immunosuppression in colon cancer via the CD47/SIRPα axis

Affiliations

SHP2 deneddylation mediates tumor immunosuppression in colon cancer via the CD47/SIRPα axis

Yiqing Li et al. J Clin Invest. .

Abstract

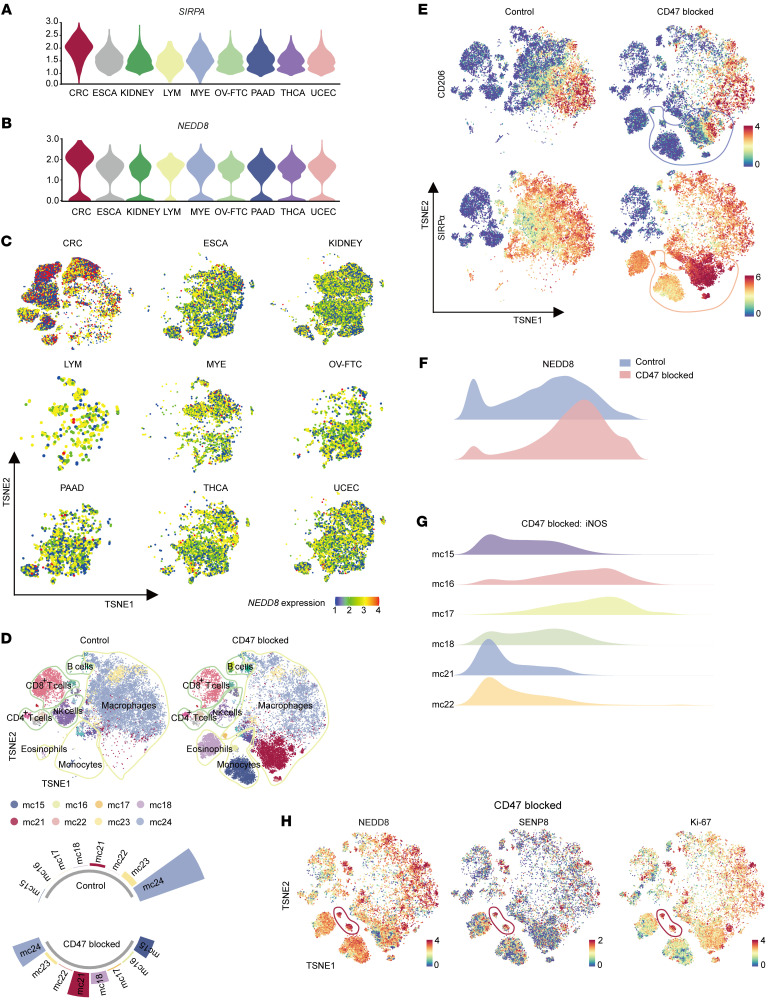
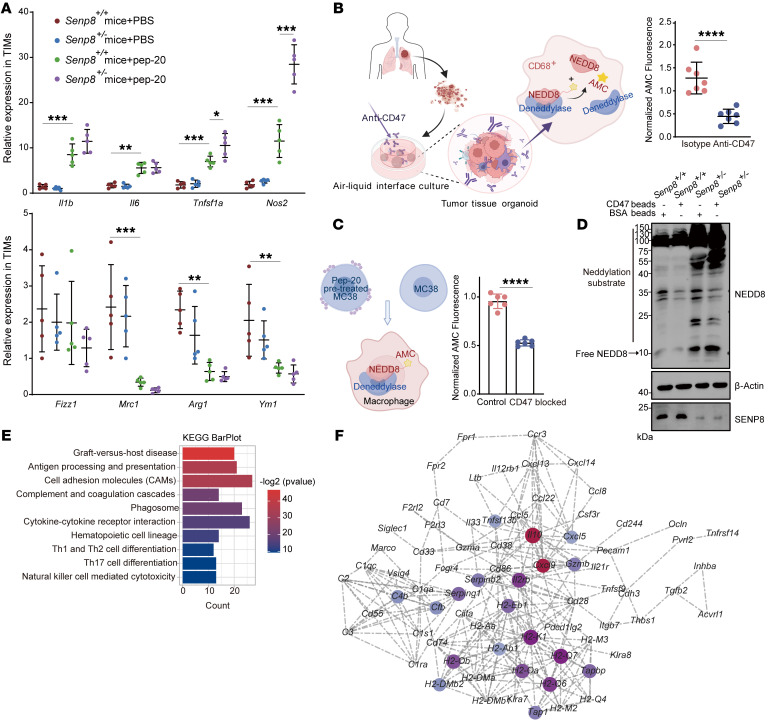
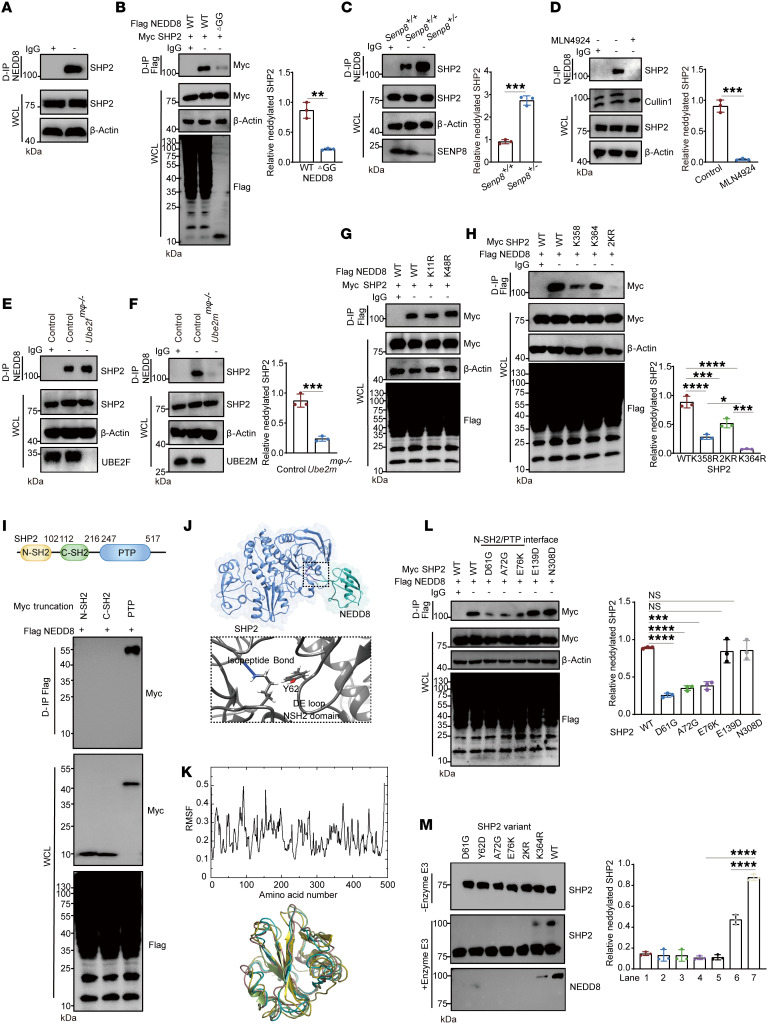
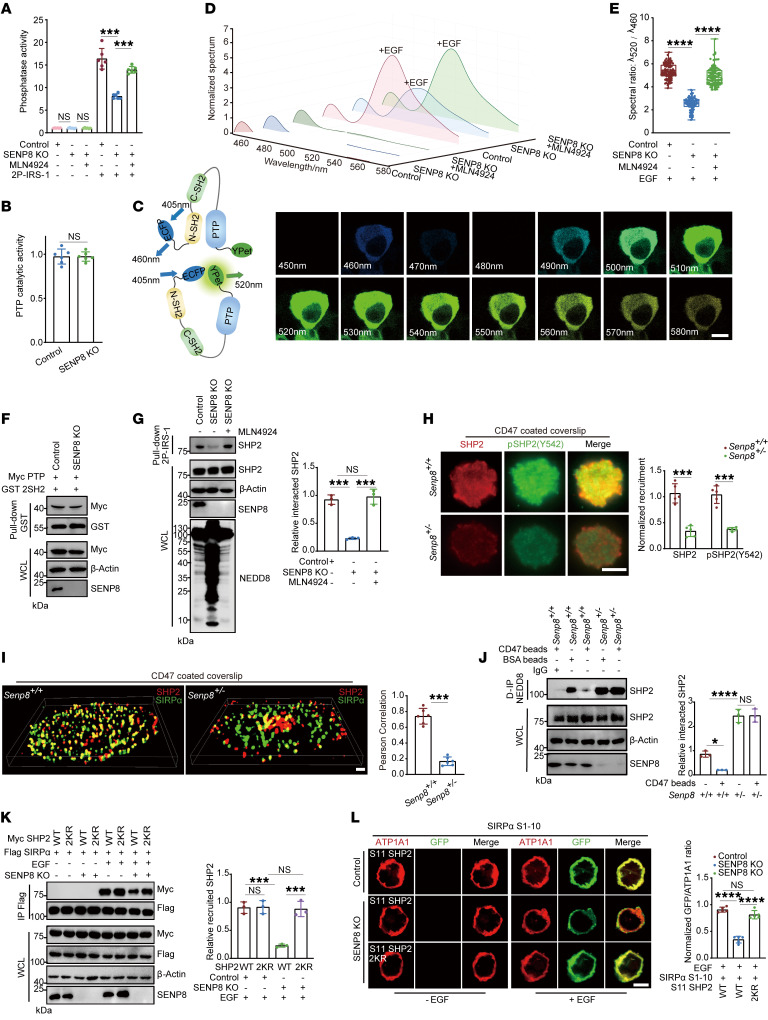
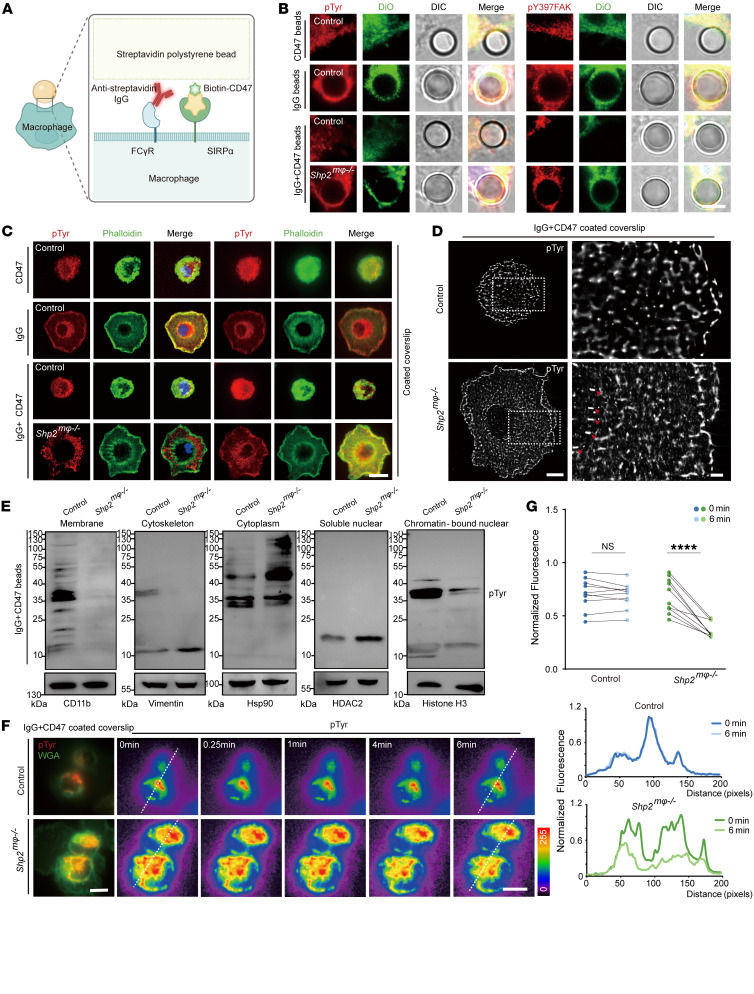
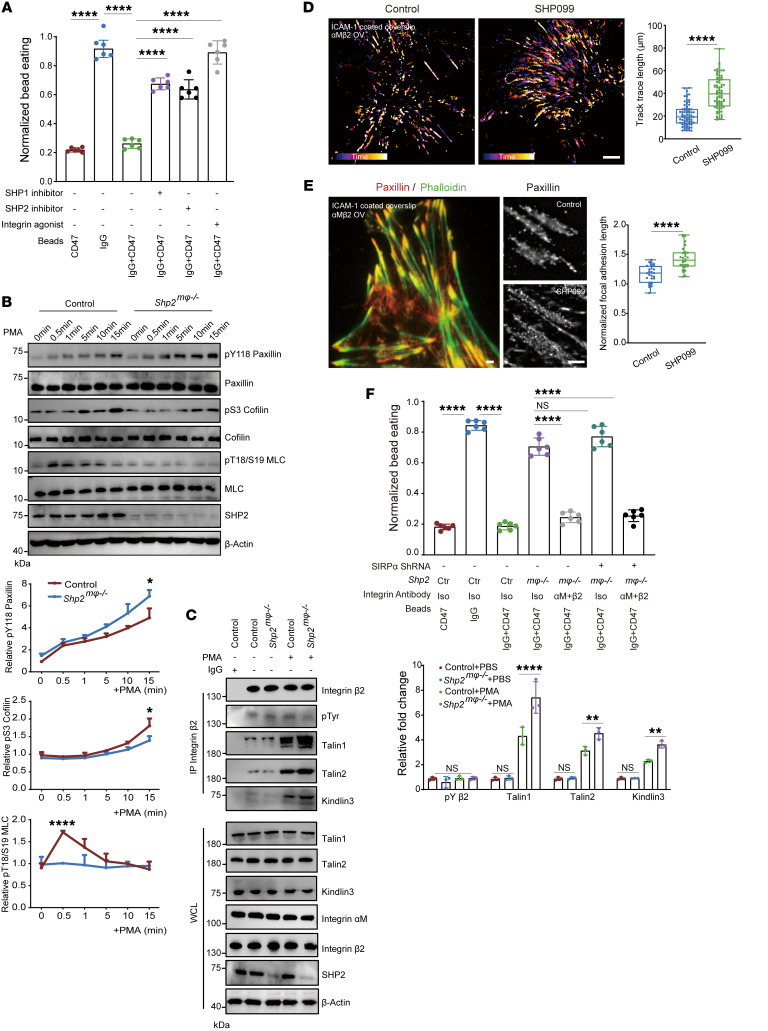
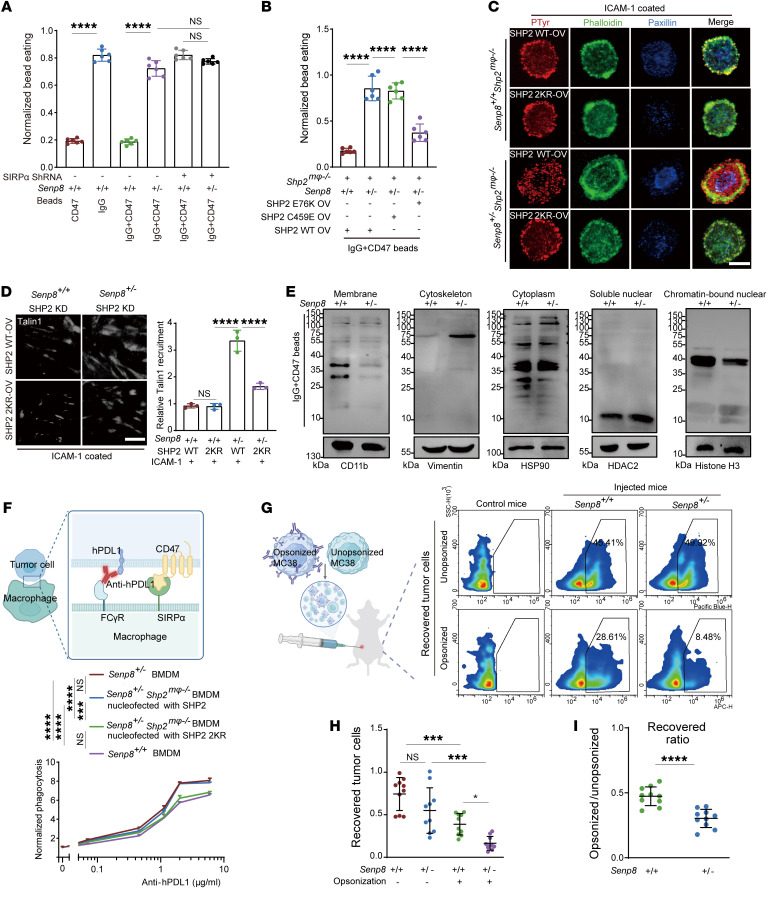
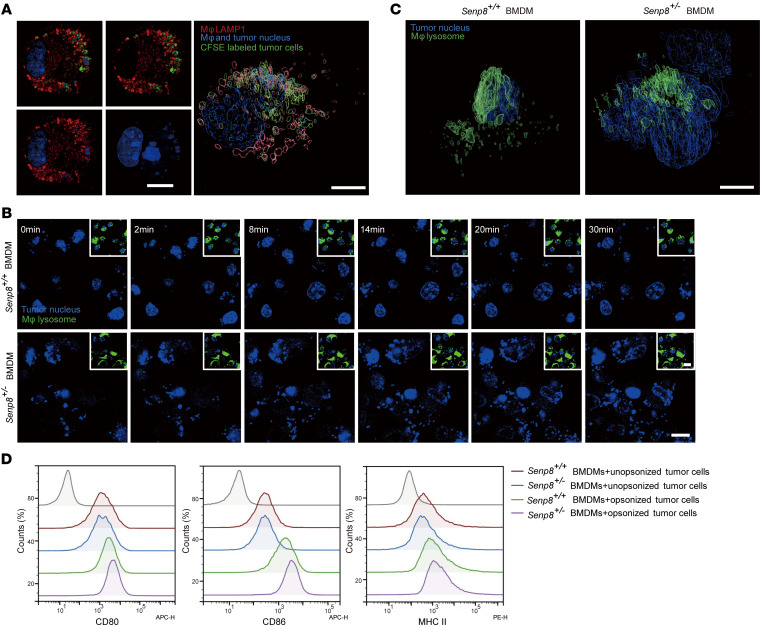
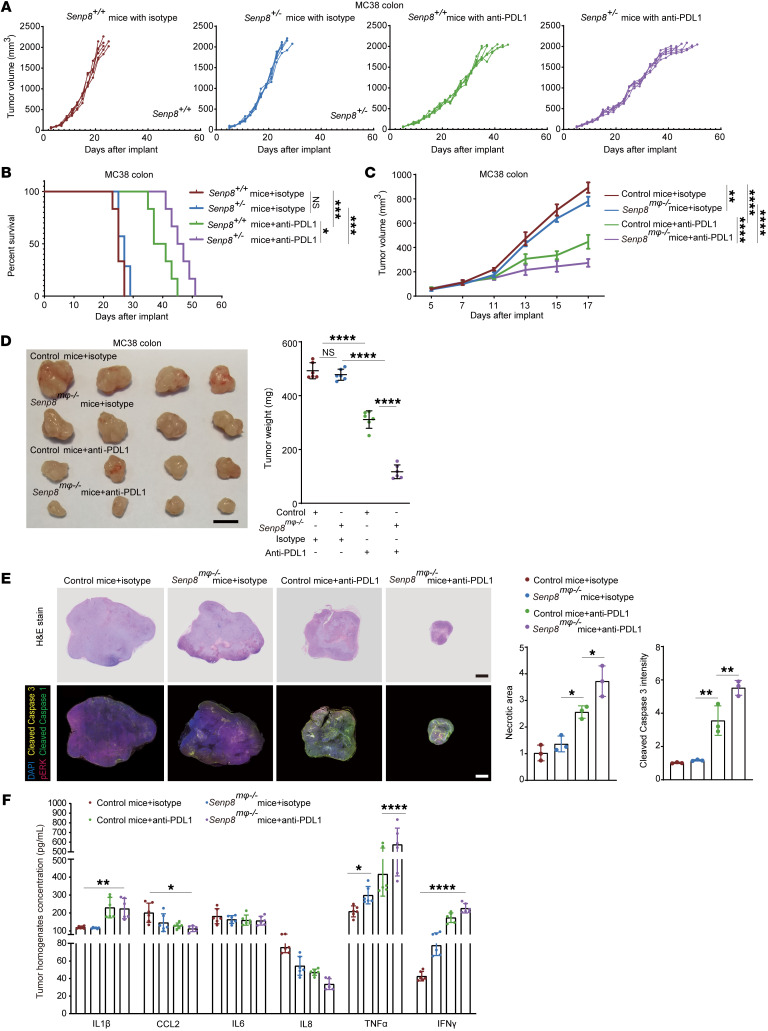
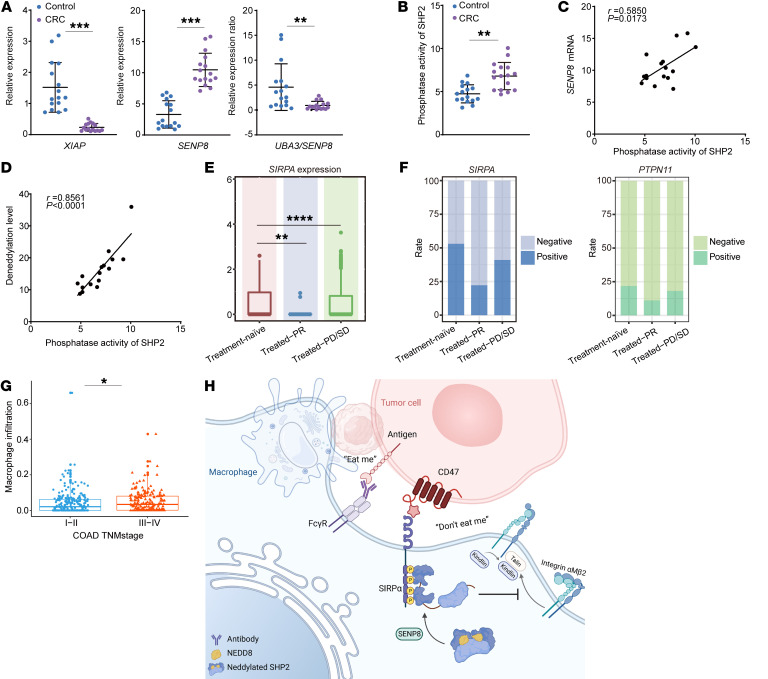
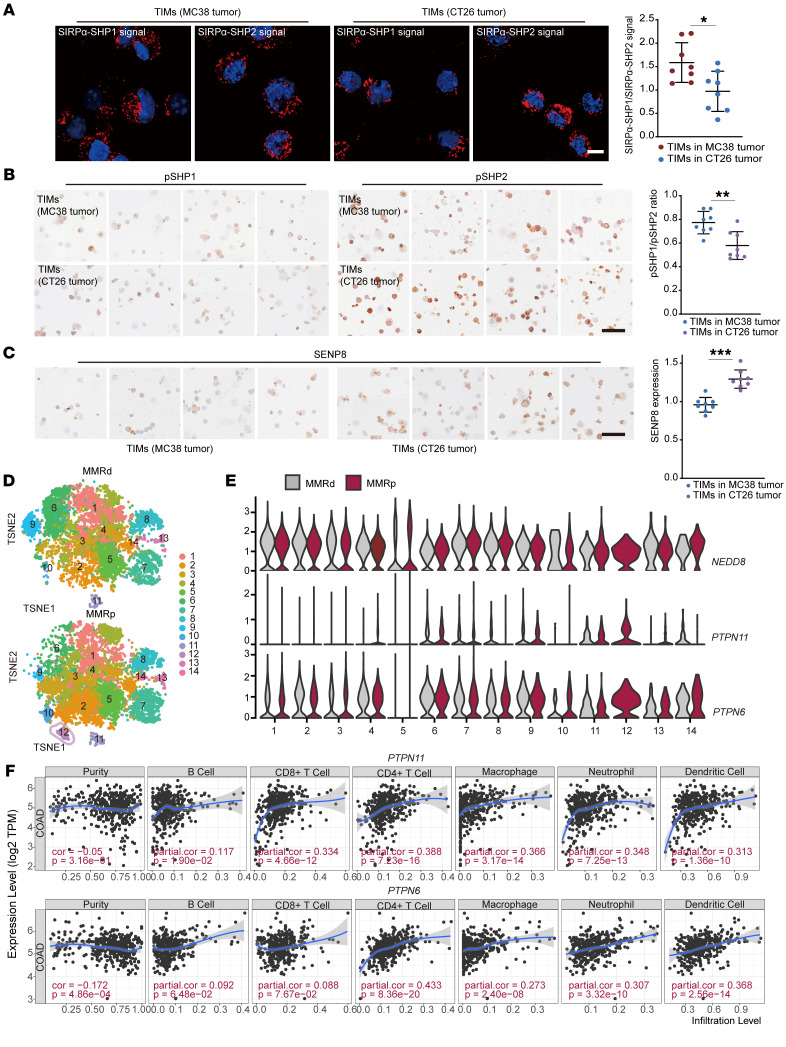
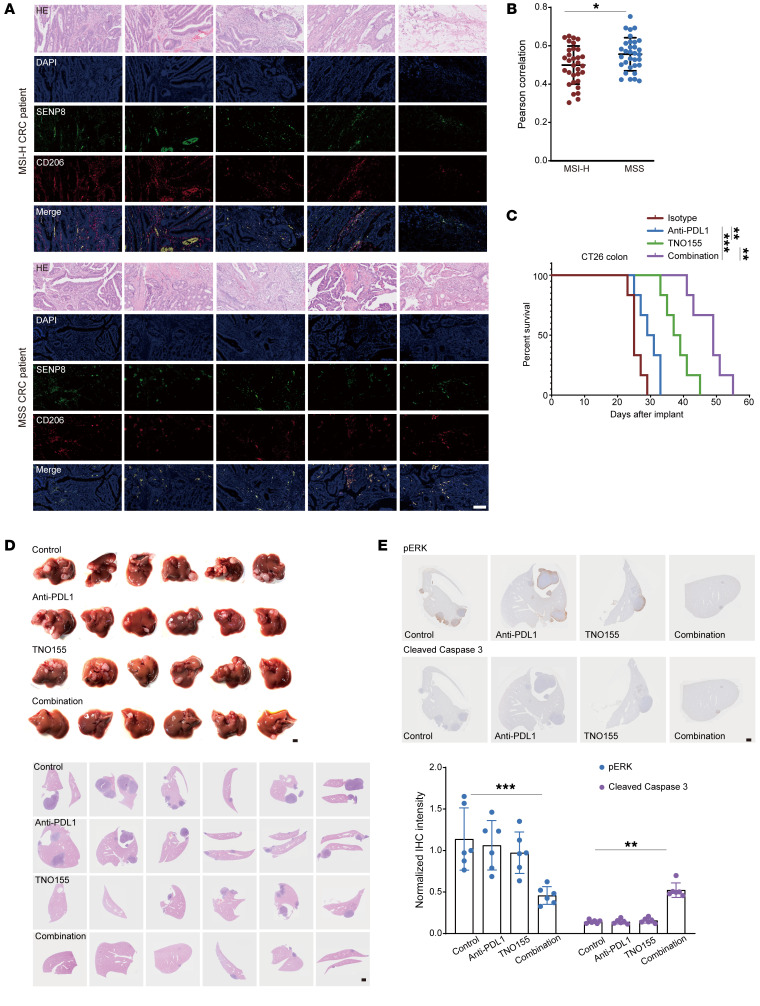
SIPRα on macrophages binds with CD47 to resist proengulfment signals, but how the downstream signal of SIPRα controls tumor-infiltrating macrophages (TIMs) is still poorly clarified. Here, we report that the CD47/signal regulatory protein α (SIRPα) axis requires the deneddylation of tyrosine phosphatase SHP2. Mechanistically, Src homology region 2-containing protein tyrosine phosphatase 2 (SHP2) was constitutively neddylated on K358 and K364 sites; thus, its autoinhibited conformation was maintained. In response to CD47-liganded SIRPα, SHP2 was deneddylated by sentrin-specific protease 8 (SENP8), which led to the dephosphorylation of relevant substrates at the phagocytic cup and subsequent inhibition of macrophage phagocytosis. Furthermore, neddylation inactivated myeloid-SHP2 and greatly boosted the efficacy of colorectal cancer (CRC) immunotherapy. Importantly, we observed that supplementation with SHP2 allosteric inhibitors sensitized immune treatment-resistant CRC to immunotherapy. Our results emphasize that the CRC subtype that is unresponsive to immunotherapy relies on SIRPαhiSHP2hiNEDD8lo TIMs and highlight the need to further explore the strategy of SHP2 targeting in CRC therapy.

Keywords: Cell Biology; Immunotherapy; Macrophages; Signal transduction.


Figures

Figure 1
Figure 1. Neddylation and SENP8 play a regulatory role in response to CD47 stimulation.
(A) Violin plot of SIRPA gene expression levels in different TIMs. (B) Violin plot of NEDD8 gene expression levels in SIRPα+ TIMs. (C) TSNE plots of NEDD8 gene expression levels in tumor-infiltrating myeloid cells. ESCA, esophageal carcinoma; KIDNEY, kidney cancer; LYM, lymphoma; MYE, myeloma; OV-FTC, ovarian or fallopian tube carcinoma; PAAD, pancreatic adenocarcinoma; THCA, thyroid carcinoma; UCEC, uterine corpus endometrial carcinoma. (D) TSNE plot shows lineages of tumor-infiltrating leukocytes in control (left) and CD47/SIRPα–blocking peptide–treated (Pep-20, 2 mg/kg, right) MC38 s.c. tumors (n = 6). mc numbers refer to major varied mouse clusters. (E) TSNE visualization of CD206 and SIRPα expression groups shown in D. (F) NEDD8 expression in total tumor-infiltrating monocytes/macrophages of groups show in D. (G) iNOS expression of major varied mouse clusters of Pep-20–treated groups. (H) TSNE visualization of NEDD8, SENP8, and Ki-67 expression in Pep-20–treated groups; mc16 and mc17 are circled.
Figure 2
Figure 2. Phenotypes of TIMs are altered by SENP8 in CD47/SIPRα signaling.
(A) RNA expression of phenotype markers in TIMs from indicated groups (n = 5). (B) Declined deneddylation levels of CD68+ macrophages in tumor tissue organoids under CD47 blockage (n = 7). (C) Declined deneddylation levels of BMDMs under CD47 blockage (n = 6). (D) Western blot of neddylation substrates from indicated groups. (E) KEGG analysis classifying genes into biological process groups. (F) Cytoscape network for classified genes imputed from KEGG analysis. Data are represented as mean ± SD. *P < 0.05; **P < 0.01; ***P < 0.001; ****P < 0.0001. Two-tailed, unpaired Student’s t test (B and C); 2-way ANOVA followed by Tukey’s post hoc test (A).
Figure 3
Figure 3. SHP2 is a genuine substrate of NEDD8.
(A) Western blot indicating SHP2 neddylation of BMDMs. (B) Western blot indicating NEDD8-SHP2 conjugation relied on the isopeptide bond of HEK293T cells (n = 3). (C) Western blot indicating depletion of SENP8 enhanced SHP2 neddylation of BMDMs (n = 3). (DF) SHP2 neddylation in BMDMs was attenuated by E1 inhibitor MLN4924 (1 μM, 8 hours) (D) or deletion of UBE2M (F) but not UBE2F (E) (n = 3). (G) Western blot indicating Poly-NEDD8 chain was not involved in SHP2 neddylation of HEK293T cells (n = 3). (H) Western blot indicating sites of SHP2 neddylation of HEK293T cells (n = 3). (I) Western blot indicating domains of SHP2 neddylation of HEK293T cells (n = 3). (J) Docking of molecules between NEDD8 and SHP2. (K) Upper panel: RMSF of SHP2 residents in MD. Lower panel: color overlay of the time-frame configurations in 1–100 amino acid area of SHP2. (L) Western blot indicating the state of SHP2 variant neddylation of HEK293T cells (n = 3). (M) Western blot indicating in vitro neddylation assay (n = 3). Recombinant SHP2 and its indicated mutation (1 μM), E3 XIAP (2.5 μM). D-IP, denaturing IP; WCL, whole-cell lysate. Data are represented as mean ± SD. *P < 0.05; **P < 0.01; ***P < 0.001; ****P < 0.0001; nonsignificant (NS), P > 0.05. Two-tailed, unpaired Student’s t test (B, C, D, F); 2-way ANOVA followed by Tukey’s post hoc test (H, L, M);
Figure 4
Figure 4. SENP8 deconjugates NEDD8 from SHP2 to facilitate its recruitment toward SIPRα.
(A) Phosphatase activity was detected for IP of HEK293T cells (n = 6). 2P-IRS-1 incubation was conducted in vitro (1 mM, 30 minutes). (B) Catalytic activity of PTP was detected for IP of HEK293T cells (n = 6). (C) Spectral images of detected emission of SHP2 biosensor under EGF stimulation (10 ng/ml, 15 minutes). Scale bar: 10 μm. Numbers in images show wavelengths. (D) Normalized intensity of emitted fluorescence spectrum shown in C. (E) The spectral ratio revealed in C (cell number = 100). (F) Western blot indicating affinity of 2SH2 domain and PTP domain in HEK293T cell lysates. (G) Western blot indicating affinity of 2P-IRS-1 and SHP2 in HEK293T cell lysates (n = 3). (H) Representative TIRF fluorescent images of BMDMs (n = 5). Scale bar: 10 μm. (I) TIRF-STORM images of SIRPα and SHP2 colocalization in BMDMs (n = 6). Scale bar: 1 μm. (J) Western blot indicating SHP2 neddylation of BMDMs under CD47 stimulation (n = 3). (K) Western blot indicating SHP2 recruitment by the SIRPα receptor was affected by neddylation under EGF stimulation (10 ng/ml, 15 minutes) in HEK293T cells (n = 3). (L) Confocal microscopy visualization of the recruitment of SHP2 toward the SIRPα receptor under EGF stimulation (10 ng/ml, 15 minutes). Scale bar: 10 μm. n = 5. Data are represented as mean ± SD. *P < 0.05; ***P < 0.001; ****P < 0.0001; NS, P > 0.05. Two-tailed, unpaired Student’s t test (B); 1-way ANOVA followed by Tukey’s post hoc test (A, E, G, J, K, L); 2-way ANOVA by Tukey’s post hoc test (H); Pearson’s correlation (I).
Figure 5
Figure 5. CD47/SIRPα signaling requires SHP2 catalytic activity.
(A) Schematic showing reconstituted target used in this study. (B) Confocal microscopy images showing pTyr and pY397 phosphorated FAK at the phagocytic cup. Scale bar: 10 μm. DiO, DiOC18; DIC, differential interference contrast. (C) Confocal (left) and TIRF (right) images showing pTyr and F-actin (phalloidin) in frustrated phagocytosis. Scale bar: 5 μm. (D) TIRF-STORM showing pTyr is enriched in the phagocytic cup (red arrowheads). Scale bars: 1 μm. (E) Western blot indicating tyrosine phosphorylation profile of subcellular fractionation of BMDMs. (F and G) BMDMs performed frustrated phagocytosis on IgG plus CD47–coated coverslip. pTyr on the membrane was labeled by fluorescence antibody, and the membrane was labeled by wheat germ agglutinin. Representative time-lapse montage of BMDMs, with the pTyr pixel intensity of color-coded values indicated by the color wedge on the right. Scale bars: 5 μm (F). Graph of mean fluorescence intensity of pTyr over time during spreading (cell number = 10) (G). Data are represented as mean ± SD. ****P < 0.0001; NS, P > 0.05. Two-way ANOVA followed by Tukey’s post hoc test (G).
Figure 6
Figure 6. SHP2 deficiency activates αMβ2 integrin to promote phagocytosis.
(A) Normalized bead eating of indicated treated BMDM (n = 6). SHP1 inhibitor (TPI-1, 5 μM), SHP2 inhibitor (SHP099, 10 μM), integrin agonist (Mn2+, 1 mM). (B) Western blot indicating phosphorylated proteins in BMDMs treated with PMA (100 ng/ml) (n = 3). (C) Western blot indicating β2 integrin activation in BMDMs treated with PMA (100 ng/ml, 15 minutes) (n = 3). (D) Color-coded time-adherent trace of MEFs (cell number = 80). ICAM-1 (100 nM). Scale bar: 5 μm. (E) Left: representative TIRF images stained with F-actin (phalloidin) and paxillin of MEFs on ICAM-1–coated (100 nM) coverslip. Right: TIRF-STORM images of paxillin. Scale bars: 5 μm (cell number = 30). (F) Normalized bead eating of indicated BMDMs (n = 6). Anti-integrin antibody (10 mg/mL). Data are represented as mean ± SD. *P < 0.05; **P < 0.01; ****P < 0.0001; NS, P > 0.05. Two-tailed, unpaired Student’s t test (B, D, E); 1-way ANOVA followed by Tukey’s post hoc test (A and F); 2-way ANOVA followed by Tukey’s post hoc test (C).
Figure 7
Figure 7. Neddylation of SHP2 promotes macrophage-mediated phagocytosis.
(A) Normalized bead eating of BMDMs as indicated (n = 6). (B) Normalized bead eating of BMDMs as indicated (n = 6). (C) Representative TIRF images of BMDMs stained with pTyr, F-actin (phalloidin), and paxillin on ICAM-1–coated (100 nM) coverslips. Scale bar: 10 μm. (D) Representative TIRF images of MEFs stained with Talin1 on ICAM-1–coated (100 nM) coverslips (n = 6). Scale bars: 10 μm. (E) Western blot indicating tyrosine phosphorylation profile of subcellular fractionation of BMDMs. (F) Flow cytometry showed specific phagocytosis of hPDL1-expressing MC38 cells by indicated BMDMs (n = 3). (GI) In vivo tumor cell recovery assay (n = 10). Schematic shows a 1:1 mixture of anti-mPDL1–opsonized or isotype–opsonized MC38 cells were injected i.p. into indicated mice. Peritoneal lavage fluid was required to calculate recovered tumor cells. Representative flow analysis plots of recovered tumor cells from mice (G). Data are represented as number of recovered tumor cells from mice (H). Data are represented as ratio between recovered tumor cells from mice that were differently opsonized (I). Data are represented as mean ± SD. *P < 0.05; ***P < 0.001; ****P < 0.0001; NS, P > 0.05. Two-tailed, unpaired Student’s t test (I); 1-way ANOVA followed by Tukey’s post hoc test (A, B, D, F, H).
Figure 8
Figure 8. Neddylation of SHP2 in macrophages promotes clearance of tumor cells.
(A) Confocal microscopy visualization of internalized tumor cells trapped in macrophage lysosomes and the corresponding reconstructed renderings by Imaris 9.5. Scale bars: 5 μm. (BC) Tumor cell phagocytosis imaging. Representative time-lapse montage of labeled lysosomes of BMDMs treated with Hoechst 33342–labeled tumor cells as indicated. Scale bars: 10 μm (B). Corresponding reconstructed renderings by Imaris 9.5. Scale bars: 5 μm (C). (D) Representative flow analysis plots showed indicated surface expression of BMDMs. PDL1-opsonized MC38 cells were cocultured with BMDMs for 24-hour tumor cell digestion, after which BMDMs were detected by flow cytometry.
Figure 9
Figure 9. Neddylation induces SHP2 inactivation to potentiate the effect of immunotherapy in vivo.
(A and B) Tumor sizes in the indicated mice (10 mg/kg anti-PDL1 antibody or isotype control, n = 6). Mice with tumor volumes of less than 2,000 mm3 are considered to be surviving (A). The survival of mice was monitored (B). (C and D) Tumor sizes of indicated mice (10 mg/kg anti-PDL1 antibody or isotype control, n = 6) (C). Tumor images and weights of indicated mice (10 mg/kg anti-PDL1 antibody or isotype control, n = 6). Scale bars: 10 mm (D). (E) Representative images of MC38 tumor sections (n = 3). H&E staining was conducted, and necrosis areas were measured. Fluorescent multiplex immunohistochemistry was conducted, and apoptosis was measured by cleaved caspase-3 staining. Scale bars: 1 mm. (F) ELISA analysis of MC38 tumor homogenates (n = 6). Data are represented as mean ± SD. *P < 0.05; **P < 0.01; ***P < 0.001; ****P < 0.0001; NS, P > 0.05. One-way ANOVA followed by Tukey’s post hoc test (C, E, D); 2-way ANOVA followed by Tukey’s post hoc test (F); Kaplan-Meier log-rank test (B).
Figure 10
Figure 10. SHP2 activation in CD47/SIRPα axis of TIMs is related to the prognosis of CRC patients.
(AD) Macrophages of human tissue were collected (n = 16). mRNA levels are shown (A). SHP2 was IP with normalized protein concentration, and phosphatase activity was quantified (B). Correlations between SENP8 mRNA and SHP2 phosphatase activity in TIMs (C). Correlations between deneddylation level and SHP2 phosphatase activity in TIMs (D). (E) Expression of SIRPα in tumor-infiltrating myeloid cells between CRC samples. n = 12 (NAC-treatment naive samples); n = 8 (NAC-treated PR samples); and n = 5 (NAC-treated PD/SD samples). (F) Rate of SIRPα+ and SHP2+ cells among TIMs. (G) Correlation of macrophage infiltration score and TNM stage of COAD cohort from the TCGA database. n = 234 (I and II); n = 183 (III and IV). (H) Proposed model of SHP2 deneddylation to ensure CD47/SIPRα signal. Data are represented as mean ± SD. *P < 0.05; **P < 0.01; ***P < 0.001; ****P < 0.0001. Two-tailed, unpaired Student’s t test (A and B); Pearson’s correlation (C and D); Wilcoxon’s test (E and G).
Figure 11
Figure 11. CD47/SIRPα axis relies on SHP2 deneddylation in immunosuppressive CRC microenvironment.
(A) PLA assay showed the interactions between SIRPα and SHP1/SHP2 in indicated TIMs (n = 8). Scale bar: 10 μm. (B) pSHP1 (Y564) and pSHP2(Y542) expression in indicated TIMs (n = 8). Scale bar: 50 μm. (C) SENP8 expression in indicated TIMs (n = 8). Scale bar: 50 μm. (D) TSNEs of TIM clusters in MMRd and MMRp tumor samples. n =28 (MMRd samples); n = 34 (MMRp samples). (E) Violin plot shows expression levels of indicated genes of different clusters in MMRd and MMRp tumor samples. PTPN11 encodes SHP2; PTPN6 encodes SHP1. (F) Association analysis of PTPN11 or PTPN6 gene expression and immune cell infiltration in COAD cohort from the TCGA database. Data are represented as mean ± SD. *P < 0.05; **P < 0.01; ***P < 0.001. Two-tailed, unpaired Student’s t test (AC); partial correlation (F).
Figure 12
Figure 12. SHP2 inhibition synergizes with immunotherapy to disrupt the immunosuppressive CRC microenvironment.
(A) Immunofluorescence images of MSI-H CRC and MSS CRC (n = 32) staining indicated markers. Scale bars: 100 μm. (B) Pearson’s correlation of SENP8 and CD206 shown in Figure 8A. (C) TNO155 (15 mg/kg, daily intragastric administration from day 5), anti-PDL1 (10 mg/kg, i.p. from day 5 every other day), or a combination of both in CT26 s.c. tumor-bearing mice. Mice with tumor volumes less than 2,000 mm3 are considered as surviving, and survival of mice was monitored (n = 6). (D) Spleen images and H&E staining from the spleen-liver metastasis model of indicated groups (n = 6). Scale bars: 1 mm. (E) IHC staining from the spleen-liver metastasis model of indicated groups (n = 6). Data are represented as mean ± SD. *P < 0.05; **P < 0.01; ***P < 0.001. Two-tailed, unpaired Student’s t test (B); Kaplan-Meier log-rank test (C); 2-way ANOVA followed by Tukey’s post hoc test (E).

Comment in

  • Waking immune-resistant tumors with neddlyation

References

    1. Waldman AD, et al. A guide to cancer immunotherapy: from T cell basic science to clinical practice. Nat Rev Immunol. 2020;20(11):651–668. doi: 10.1038/s41577-020-0306-5. - DOI - PMC - PubMed
    1. Wei SC, et al. Fundamental mechanisms of immune checkpoint blockade therapy. Cancer Discov. 2018;8(9):1069–1086. doi: 10.1158/2159-8290.CD-18-0367. - DOI - PubMed
    1. Mantovani A, et al. Tumour-associated macrophages as treatment targets in oncology. Nat Rev Clin Oncol. 2017;14(7):399–416. doi: 10.1038/nrclinonc.2016.217. - DOI - PMC - PubMed
    1. DeNardo DG, et al. Macrophages as regulators of tumour immunity and immunotherapy. Nat Rev Immunol. 2019;19(6):369–382. doi: 10.1038/s41577-019-0127-6. - DOI - PMC - PubMed
    1. Demaria O, et al. Harnessing innate immunity in cancer therapy. Nature. 2019;574(7776):45–56. doi: 10.1038/s41586-019-1593-5. - DOI - PubMed

Publication types