. 2023 Feb 22;8(4):e163932.
doi: 10.1172/jci.insight.163932.

Proline and glucose metabolic reprogramming supports vascular endothelial and medial biomass in pulmonary arterial hypertension

Affiliations

Proline and glucose metabolic reprogramming supports vascular endothelial and medial biomass in pulmonary arterial hypertension

Bradley M Wertheim et al. JCI Insight. .

Abstract

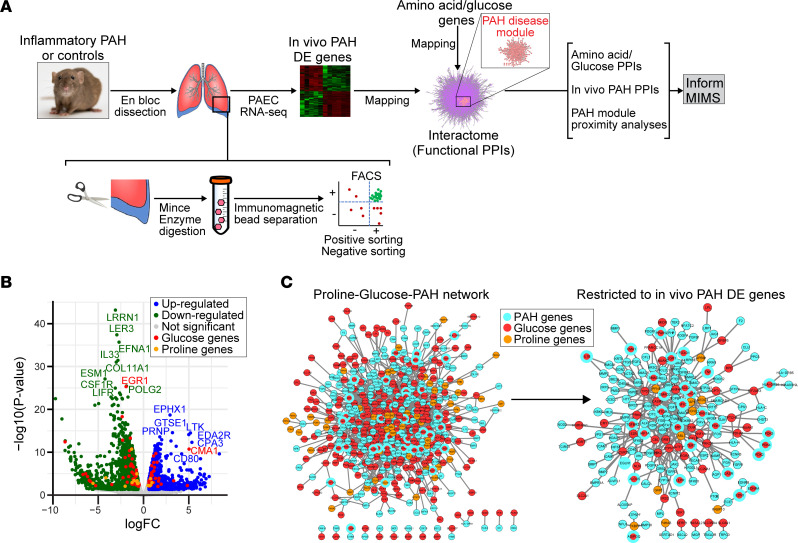
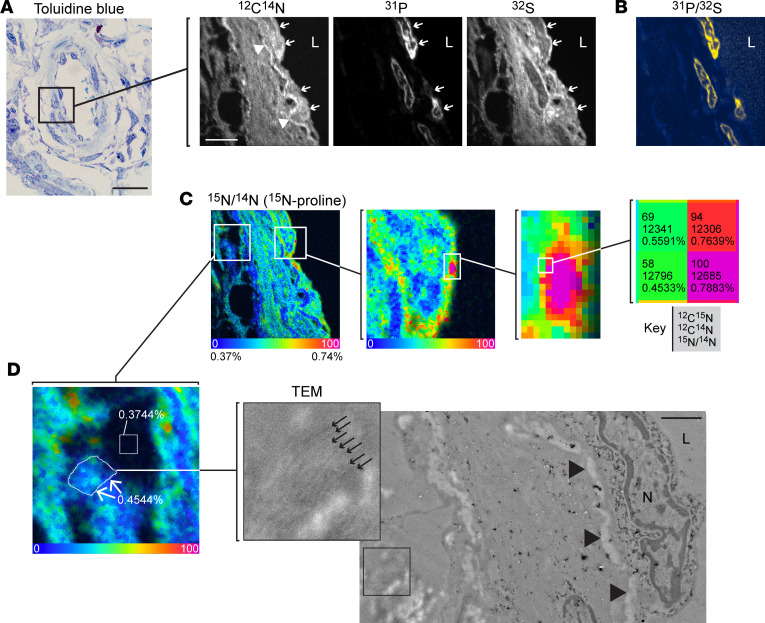
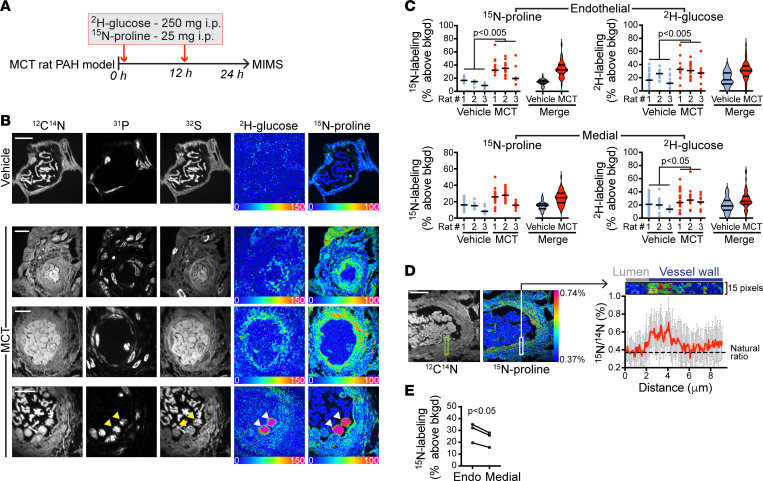
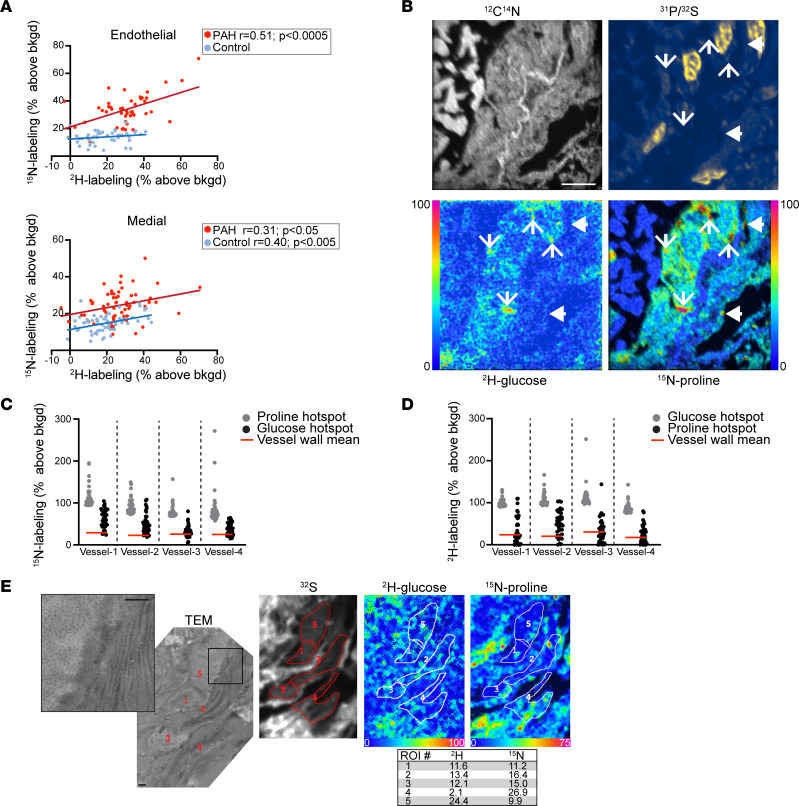
In pulmonary arterial hypertension (PAH), inflammation promotes a fibroproliferative pulmonary vasculopathy. Reductionist studies emphasizing single biochemical reactions suggest a shift toward glycolytic metabolism in PAH; however, key questions remain regarding the metabolic profile of specific cell types within PAH vascular lesions in vivo. We used RNA-Seq to profile the transcriptome of pulmonary artery endothelial cells (PAECs) freshly isolated from an inflammatory vascular injury model of PAH ex vivo, and these data were integrated with information from human gene ontology pathways. Network medicine was then used to map all aa and glucose pathways to the consolidated human interactome, which includes data on 233,957 physical protein-protein interactions. Glucose and proline pathways were significantly close to the human PAH disease module, suggesting that these pathways are functionally relevant to PAH pathobiology. To test this observation in vivo, we used multi-isotope imaging mass spectrometry to map and quantify utilization of glucose and proline in the PAH pulmonary vasculature at subcellular resolution. Our findings suggest that elevated glucose and proline avidity underlie increased biomass in PAECs and the media of fibrosed PAH pulmonary arterioles. Overall, these data show that anabolic utilization of glucose and proline are fundamental to the vascular pathology of PAH.

Keywords: Amino acid metabolism; Cardiology; Endothelial cells; Fibrosis; Pulmonology.


Figures

Figure 1
Figure 1. Network medicine predicts pulmonary endothelial proline and glucose pathways are functionally important in PAH.
(A) Design and experimental throughput for the current project. PAECs were isolated from control and inflammatory PAH rat lungs, and differentially expressed (DE) genes between these groups were mapped to the consolidated human interactome, which contains information on more than 230,000 physical protein-protein interactions (PPIs). The GO database was also used to map genes associated with each aa and glucose pathway. The derivative outputs inform biological experiments focusing on the pulmonary endothelial proline and glucose programs in PAH using MIMS. SD, Sprague-Dawley. (B) Pulmonary endothelial DE genes between control and inflammatory PAH are presented by volcano plot. The genomic features that were up- and downregulated significantly (FDR < 0.05, P < 0.05; P values were obtained using the exact binomial test executed in EdgeR) were mapped to the consolidated interactome to identify functionally important, pulmonary endothelial PPIs in PAH. (C) The proline/glucose-PAH bipartite network and the proline/glucose-PAH bipartite network restricted to include only proline/glucose genes that were DE in PAH in vivo. See Supplemental Figure 5 for expanded networks from C.
Figure 2
Figure 2. Quantitative mapping of proline utilization at high spatial resolution in PAH vessels.
(A) Representative pulmonary artery from the inflammatory PAH model in a resin-embedded section stained with toluidine blue. This section is adjacent to a section mounted on a silicon wafer for MIMS imaging (right). Single ion images provide histological details and stereotypical vascular features. The 12C14N image reveals tissue boundaries including the endothelial-lumen interface. Elastin appears hyperintense (white). The 31P image identifies nuclei due to the phosphorus content of chromatin. 32S images resemble 12C14N images, but the nuclei appear dark. (B) As such, the ratio of 31P to 32S yields particularly pronounced nuclei. Endothelial cells were identifiable by their flattened appearance and direct interface with the lumen (arrows). (C) Hue saturation intensity images display the isotope ratio measurements and map incorporation of 15N-proline. The lower end of the scale (blue) is set to the background ratio (0.37%) and expressed as a percentage above background (represented by 0). The upper end of the scale is set to reveal differences in labeling (0.75% = 100% above background). (D) Correlative imaging of adjacent thin section by TEM. Inset shows collagen fibers (small arrows). Large arrowheads: elastin; N, nucleus; L, lumen. Region of extracellular matrix with abundant collagen fibers is labeled with 15N-proline (0.4544%). The indicated square region where there is no tissue (resin) is approximately at natural abundance (0.3744%). Scale bar: 20 μm (toluidine blue), 5 μm (MIMS, AC).
Figure 3
Figure 3. Reprogramming of proline and glucose metabolism in remodeled pulmonary arteries.
(A) Stable isotope labeling protocol. MCT, monocrotaline. (B) MIMS images of pulmonary vessel from control rat (top row) and inflammatory PAH vessels (bottom 3 rows). Stereotypical features of remodeling vessels are evident in 12C14N, 31P, and 32S images, including thickening of the walls and increased cellularity. HSI images demonstrate increased 2H-glucose (2H/1H image) and 15N proline labeling (15N/14N image) in the walls of remodeling vessels. Bottom row, arrowheads indicate 2 intensely labeled nucleated WBCs in the lumen. Scale bars: 10 μm. (C) Dot plots of endothelial (top) and medial cell (bottom) proline (left) and glucose (right) labeling in inflammatory PAH vessels versus control vessels. Data in violin plots are presented as median, IQR. Each dot represents a nucleated cell. P values calculated by the nested ANOVA method. (D) The 15N/14N ratio for pixels of the indicated region of the vessel wall mapped as a function of distance from the origin in the lumen (top). (E) Median endothelial cell labeling relative to median medial cell labeling (n = 3 PAH rats; P values calculated by the Student’s paired 2-tailed t test). Representative images provided in each instance.
Figure 4
Figure 4. Anabolic convergence of glucose and proline as substrate for biomass in remodeling vessels.
(A) Top: MIMS quantification of proline utilization correlates with glucose utilization in the endothelial cells of inflammatory PAH vessels, but not control vessels. Bottom: MIMS quantification of proline utilization by medial cells correlates with glucose in both PAH and control vessels. Correlations assessed by linear regression model. (B) High-resolution MIMS imaging demonstrates punctate hotspots of hyperutilization of glucose and proline. Line arrows, hyperintense in both glucose and proline; arrowheads, hyperintense in proline but not glucose. Scale bar: 5 μm. (C) 15N-labeling distributions for glucose hotspots (n = top 40), which are largely above the mean for the vessel wall (inclusive of nonhotspots and hotspots) (red line) and partially overlap with the distribution of top 40 15N-proline hotspots (gray). (D) Complementary analysis to C as the 2H-glucose labeling for the top 15N-proline hotspots partially overlaps with the distribution of top 40 2H-glucose hotspots. In C and D, the mean signal for each vessel wall is provided as a reference (red line). Hotspots were 5 × 5 pixels. (E) TEM adjacent to section imaged with MIMS. TEM image inset demonstrates extracellular matrix with collagen fibers arrayed in both cross section (left) and longitudinally (right). ROI were generated to correspond to regions of ECM on the TEM and the data extracted and expressed as a percent above background (table) indicative of glucose and proline labeling. Scale bars: 500 nm.

References

    1. Maron BA, et al. Pulmonary arterial hypertension: diagnosis, treatment, and novel advances. Am J Respir Crit Care Med. 2021;203(12):1472–1487. doi: 10.1164/rccm.202012-4317SO. - DOI - PMC - PubMed
    1. Wang D, et al. MicroRNA-124 controls the proliferative, migratory, and inflammatory phenotype of pulmonary vascular fibroblasts. Circ Res. 2014;114(1):67–78. doi: 10.1161/CIRCRESAHA.114.301633. - DOI - PMC - PubMed
    1. Paulin R, et al. Sirtuin 3 deficiency is associated with inhibited mitochondrial function and pulmonary arterial hypertension in rodents and humans. Cell Metab. 2014;20(5):827–839. doi: 10.1016/j.cmet.2014.08.011. - DOI - PubMed
    1. Michelakis ED, et al. Inhibition of pyruvate dehydrogenase kinase improves pulmonary arterial hypertension in genetically susceptible patients. Sci Transl Med. 2017;9(413):eaao4583. doi: 10.1126/scitranslmed.aao4583. - DOI - PubMed
    1. Salminen A, Kaarniranta K. Glycolysis links p53 function with NF-kappaB signaling: impact on cancer and aging process. J Cell Physiol. 2010;224(1):1–6. doi: 10.1002/jcp.22119. - DOI - PubMed

Publication types

MeSH terms