. 2023 Feb 22;8(4):e159331.
doi: 10.1172/jci.insight.159331.

Hypercapnia alters stroma-derived Wnt production to limit β-catenin signaling and proliferation in AT2 cells

Affiliations

Hypercapnia alters stroma-derived Wnt production to limit β-catenin signaling and proliferation in AT2 cells

Laura A Dada et al. JCI Insight. .

Abstract

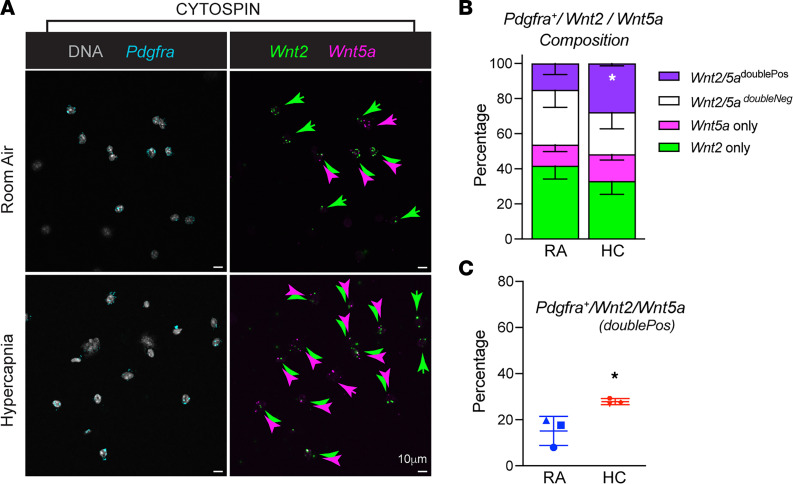
Persistent symptoms and radiographic abnormalities suggestive of failed lung repair are among the most common symptoms in patients with COVID-19 after hospital discharge. In mechanically ventilated patients with acute respiratory distress syndrome (ARDS) secondary to SARS-CoV-2 pneumonia, low tidal volumes to reduce ventilator-induced lung injury necessarily elevate blood CO2 levels, often leading to hypercapnia. The role of hypercapnia on lung repair after injury is not completely understood. Here - using a mouse model of hypercapnia exposure, cell lineage tracing, spatial transcriptomics, and 3D cultures - we show that hypercapnia limits β-catenin signaling in alveolar type II (AT2) cells, leading to their reduced proliferative capacity. Hypercapnia alters expression of major Wnts in PDGFRα+ fibroblasts from those maintaining AT2 progenitor activity toward those that antagonize β-catenin signaling, thereby limiting progenitor function. Constitutive activation of β-catenin signaling in AT2 cells or treatment of organoid cultures with recombinant WNT3A protein bypasses the inhibitory effects of hypercapnia. Inhibition of AT2 proliferation in patients with hypercapnia may contribute to impaired lung repair after injury, preventing sealing of the epithelial barrier and increasing lung flooding, ventilator dependency, and mortality.

Keywords: Cell Biology; Pulmonology; Respiration.


Conflict of interest statement

Conflict of interest: The authors have declared that no conflict of interest exists.

Figures

Figure 1
Figure 1. Hypercapnia limits AT2 cell proliferation in 3D culture organoids.
(A) Schematic of experiments designed to coculture AT2 cells isolated from SftpCreERT2 R26REYFP mice (SftpcEYFP AT2) and WT mesenchymal cells. Alveolar organoids were switched to normocapnia (5% CO2; NC) or hypercapnia (20% CO2; HC) media on day 7 and cultured until day 21. (B) Representative images of organoid cultures in normocapnia or hypercapnia. Scale bars: 500 μm. (C) Graph depicts the inhibitory effect of hypercapnia on organoid size. Median with interquartile range. n = 8. (D) Graph depicts the effect of hypercapnia exposure for 21 days on colony forming efficiency (CFE). n = 8. (E) Immunofluorescence analysis of SFTPC (AT2 marker) and Podoplanin (AT1 marker) revealed a reduction in AT2 cell proliferation in organoids exposed to hypercapnia for 14 days relative to normocapnia. Nuclear DNA is stained with DAPI. Scale bars: 50 μm. (C) ANOVA plus Sidak’s multiple comparisons test. (D) Student’s t test. *P < 0.05; ***P < 0.001, ****P < 0.0001.
Figure 2
Figure 2. Transcriptomic analysis of isolated AT2 cells reveals inhibition of βcat signaling during hypercapnia.
(A) Hypercapnia decreases the number of cells expressing Ki67 in the alveolar region of the adult mouse lung exposed to room air (RA) or 10% CO2 (HC) for 21 days, as revealed by immunofluorescence. White arrows indicate SPTPC+Ki67+ AT2 cells. Scale bars: 20 μm. (B) Graph depicting the inhibitory effect of hypercapnia exposure for 21 days on proliferation. RA, n = 4; HC, n = 3 mice. Student’s t test. **P < 0.01. (CF) Bulk RNA-Seq was performed on flow cytometry sorted AT2 cells from mice breathing RA (n = 6) or exposed to HC. Heatmap shows clustering of differentially expressed genes (FDR q < 0.05) in AT2 cells after 7 (n = 5) or 21 (n = 5) days of hypercapnia exposure. (D and E) Volcano plots. (F) GO biological processes. (GJ) Expression of selected DEG (FDR q < 0.05) regulated by hypercapnia involved in the Wnt/βcat pathway.
Figure 3
Figure 3. Hypercapnia decreases Wnt/βcat signaling in AT2 cells.
AT2 cells were isolated from mice exposed to room air (RA) or 10% CO2 (HC) for 21 days. (A) mRNA was isolated, and qPCR was performed. n = 8 mice. (B and C) In situ RNA hybridization showing decreased number of Axin2+ AT2 cells in mice exposed to HC. Yellow arrows indicate Sftpc+Axin2+ AT2 cells. Scale bars: 10 μm. n = 4 mice. (D) Number of lineage-labeled AT2 cells from Axin2CreERT2–TdTom mice determined by flow cytometry. n = 5 mice. Graph shows data from 1 of 3 independent experiments. Student’s t test. *P < 0.05; **P < 0.01.
Figure 4
Figure 4. Hypercapnia increases Wnt5a expression in PDGFRα+ fibroblasts.
Lung PDGFRα+ fibroblasts were isolated via flow cytometry cell sorting from mice breathing room air (RA) or exposed to 10% CO2 (HC) for 10 days. (A) Expression of Wnt genes in PDGFRα+ fibroblasts as analyzed by population RNA-Seq. n = 3, with cells isolated from 3 mice in each replicate. #FDR q < 0.05). (BD) mRNA was isolated, and qPCR was performed. (B) Wnt5a (n = 4). (C) Wnt2 (n = 3). (D) MLg2908 mouse lung fibroblast cells were preincubated in the presence or absence of UO126 (10 μM) or PD98059 (10 μM) for 90 minutes and exposed to media equilibrated to NC (5% CO2) or HC (20% CO2) for 24 hours. n = 3. (B and C) Student’s t test. (D) ANOVA plus Sidak’s multiple comparisons test. *P < 0.05; ** P < 0.01.
Figure 5
Figure 5. WNT5A reduces βcat signaling in alveolar epithelial cells.
(A) βCat transcriptional activity was measured using the established, TOPFlash. A549 cells were transiently transfected with the reporter plasmid for 24 hours and were then stimulated with recombinant Wnts for another 16 hours. Cell lysates, normalized to equal protein concentrations, were assayed for luciferase activity. V, vehicle. n = 3 independent experiments run in duplicate. (B) Schematic for assay to quantify the cadherin-free signaling pool of βcat in cell lysates via GST-ICAT (inhibitor of catenin and T cell factor [TCF]) affinity precipitation as described in Methods. ICAT (brown protein) is an 81 amino acid polypeptide that binds the central armadillo-repeat region of βcat (purple) and can be used to quantify the Wnt-stabilized pool of βcat. Cadherin (blue) and α-catenin (green) are also shown. (C) Immunoblot from rat AT2 cells plated at different densities and infected with adenoviruses coding for GFP, WNT3A-IRES-GFP, or WNT5A-IRES-GFP and subjected to GST-ICAT affinity precipitation as in B. Input lysates and postaffinity precipitation (unbound lysates) are shown as controls. Note that, across all cell plating conditions, WNT3A increases, whereas WNT5A inhibits the GST-ICAT–bound signal pool of βcat. ****P < 0.0001. One-way ANOVA with Sidak’s post hoc comparison test.
Figure 6
Figure 6. Activation of βcat signaling rescues AT2-proliferative capacity during hypercapnia.
(A) Representative fluorescence images of typical day 21 organoid cultures of AT2 isolated from SftpCreERT2 Ctnnb1wt/wt R26REYFP mice (WTβcat) or SftpCreERT2 Ctnnb1flExon3fl R26REYFP (Δ3βcat). Organoids were cultured in NC or HC as described in Figure 1. Scale bars: 500 μm. (B) Graph depicts effect of WTβcat versus Δ3βcat expression on normocapnia (NC) and hypercapnia (HC) organoid size. n = 4 mice of each strain in 2 independent experiments. (C) Representative fluorescence images of typical day 21 organoid cultures of AT2 cells isolated from SftpCreERT2 R26REYFP mice treated with rWNT3A (50 ng/mL, 3a) or rWNT5A (50 ng/mL, 5a) starting 24 hours after switching media to NC or HC. Scale bars: 500 μm. (D) Graph depicts effect of added rWNT5A and rWNT3A on organoid size. n = 4 mice of each strain in 3 independent experiments. Data are shown as median with interquartile range. *P < 0.05; **P < 0.01***P < 0.001; ****P <0.0001;. One-way ANOVA with Sidak’s post hoc comparison test.
Figure 7
Figure 7. Pdgfra+Wnt2-expressing fibroblasts are spatially closer to AT2 cells than Wnt5a-expressing fibroblasts.
(A) Confocal images of Pdgfra, Sftpc, Wnt2, and Wnt5a mRNA signal in lung tissue from WT mice exposed to room air (RA) or hypercapnia (HC) for 10 days. RNA-FISH signal intensity converted to object spots to measure shortest distance between signals. White arrows indicate cells coexpressing signals. Scale bars: 10 μm. (B) Schematic of spatial distance mapping algorithm. (C and D) Graphical representation of the percentage of Wnt2 or Wnt5a spots from Sftpc mean signal, respectively. n = 3 (each point consists of 3 mice), 3 fields of view/mouse with more than 1,500 measurements per condition. Student’s t test. **P < 0.01. (E) Graph shows that hypercapnia does not alter the median distance between Pdfgra and Sftpc signals.
Figure 8
Figure 8. PDGFRα+ flow-sorted fibroblasts show nonuniform expression of Wnt2 and Wnt5a.
(A) Confocal images of PDGFRα flow-sorted fibroblasts isolated from room air (RA) and hypercapnia (HC) exposed mice for 10 days were subjected to cytospin/RNA-FISH analysis with probes for Pdgfra (cyan), Wnt2 (green), and Wnt5a (magenta). Nuclei are shown in gray. RNA-FISH signal intensity converted to object spots to measure cooccurrence of Wnt2, Wnt5a, or both signals within the Pdgfra signal region. Colored arrows denote single-positive Wnt cells and double-positive Wnt cells. Scale bars: 10 μm. (B and C) Graphical representation of the percentage of Wnt2 or Wnt5a single-positive versus double-positive Pdgfra+ cells. n = 3 (each point consists of 3 mice), 3 fields of view/mouse with more than 400 measurements per condition. *P < 0.05.
Figure 9
Figure 9. Model for hypercapnia-mediated inhibition of βcat signaling in AT2 cells via skewing of fibroblast-derived Wnts.
At the left, normocapnia is represented. AT2 progenitors are spatially proximal to Pdgfra/Wnt2-expressing fibroblasts (red/red gradient) that maintain βcat signaling and AT2 self-renewal to replace damaged AT1 cells. Pdgfra/Wnt5a-expressing fibroblasts (purple/purple gradient) are spatially farther from the AT2 cell, perhaps to ensure separation of competing βcat-activating (WNT2) from βcat-inhibiting (WNT5A) signals. At the right, hypercapnia leads to reduced βcat signaling in AT2 cells, impairing cell renewal and differentiation by skewing Wnt expression in PDGFRα stromal cells toward a noncanonical variety, with Wnt5a significantly elevated. Narrowness of the AT2 progenitor niche raises the possibility that elevated WNT5A release (purple gradient) in close spatial vicinity to the WNT2 signal (red gradient) antagonizes βcat signaling in AT2 cells, inhibiting proliferative capacity.

References

    1. Sznajder JI. Alveolar edema must be cleared for the acute respiratory distress syndrome patient to survive. Am J Respir Crit Care Med. 2001;163(6):1293–1294. doi: 10.1164/ajrccm.163.6.ed1801d. - DOI - PubMed
    1. Coronovirus Resource Center. Johns Hopkins University & Medicine. Updated February 9, 2023. Accessed Febcurary 9, 2023. https://coronavirus.jhu.edu.
    1. Nalbandian A, et al. Post-acute COVID-19 syndrome. Nat Med. 2021;27(4):601–615. doi: 10.1038/s41591-021-01283-z. - DOI - PMC - PubMed
    1. Morales-Quinteros L, et al. The role of hypercapnia in acute respiratory failure. Intensive Care Med Exp. 2019;7(suppl 1):39. - PMC - PubMed
    1. Barnes T, et al. Re-examining permissive hypercapnia in ARDS: a narrative review. Chest. 2018;154(1):185–195. doi: 10.1016/j.chest.2017.11.010. - DOI - PubMed

Publication types