. 2023 Jan 17;120(3):e2213622120.
doi: 10.1073/pnas.2213622120. Epub 2023 Jan 10.

CITED2 is a conserved regulator of the uterine-placental interface

Affiliations

CITED2 is a conserved regulator of the uterine-placental interface

Marija Kuna et al. Proc Natl Acad Sci U S A. .

Abstract

Establishment of the hemochorial uterine-placental interface requires exodus of trophoblast cells from the placenta and their transformative actions on the uterus, which represent processes critical for a successful pregnancy, but are poorly understood. We examined the involvement of CBP/p300-interacting transactivator with glutamic acid/aspartic acid-rich carboxyl-terminal domain 2 (CITED2) in rat and human trophoblast cell development. The rat and human exhibit deep hemochorial placentation. CITED2 was distinctively expressed in the junctional zone (JZ) and invasive trophoblast cells of the rat. Homozygous Cited2 gene deletion resulted in placental and fetal growth restriction. Small Cited2 null placentas were characterized by disruptions in the JZ, delays in intrauterine trophoblast cell invasion, and compromised plasticity. In the human placentation site, CITED2 was uniquely expressed in the extravillous trophoblast (EVT) cell column and importantly contributed to the development of the EVT cell lineage. We conclude that CITED2 is a conserved regulator of deep hemochorial placentation.

Keywords: CITED2; placenta; pregnancy; stem cells; trophoblast.


Conflict of interest statement

The authors declare no competing interest.

Figures
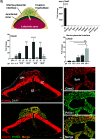
Fig. 1.
Fig. 1.
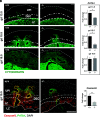
Cited2 expression in the placenta and UPI during gestation in the rat. (A) Schematic showing the late gestation rat placentation site. Invaded trophoblast cells are depicted in green. (B) Relative expression of Cited2 transcript in postnatal day 1 (PND1) rat neonatal tissues and gestation day (gd) 14.5 JZ tissue. (C) Relative expression of Cited2 transcripts in the ectoplacental cone (EPC), whole placenta (P), JZ, and LZ of the rat placenta during gestation. Values depicted were normalized to gd 9.5 EPC samples. (D) Relative expression of Cited2 transcripts within the UPI during gestation. (E) In situ hybridization showing Cited2 transcript distribution (Top Left) and Cited2 and Prl7b1 (IT marker) transcript colocalization in rat gd 18.5 placentation site (Bottom Left). Higher magnification images of the area outlined by a yellow rectangle (Bottom Left) are shown to the right. (Scale bar, 500 µm (Left), scale bar, 100 µm (Right).) UPI, spiral artery (SpA). The histograms presented in panels BD represent mean ± SEM, n = 5 to 10, 3 to 6 pregnancies. One-way ANOVA, Tukey’s post hoc test, *P < 0.05, **P < 0.01, ****P < 0.0001.
Fig. 2.
Fig. 2.
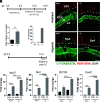
The CITED2-deficient rat placenta is growth restricted. (A) Placental and fetal weights from Cited2+/− x Cited2+/− breeding for the rat. (B) Immunohistological analysis of vimentin in gd 18.5 wild-type (+/+) and null (−/−) placentas from Cited2+/− x Cited2+/− breeding. (Scale bar, 1,000 µm.) (C) JZ and LZ weights from Cited2+/− x Cited2+/− breeding on gd 14.5 and gd 18.5. Values represent mean ± SEM, n = 12 to 35, unpaired t test, **P < 0.01, ***P < 0.001, ****P < 0.0001. (D) Simplified schematic depicting the strategy for achieving trophoblast-specific CITED2 knockdown in vivo. (E) Relative expression of Cited2 transcripts in control (CTRL) and CITED2 shRNA-exposed gd 14.5 JZ tissue. (F) JZ, LZ, and fetal weights from control and gd 14.5 trophoblast-specific Cited2 knockdown. Control (CTRL) and Cited2 shRNA-mediated knockdown. Shown are mean values ± SEM, n = 12 to 20, unpaired t test, **P < 0.01, ****P < 000.1.
Fig. 3.
Fig. 3.
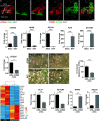
Intrauterine trophoblast cell invasion is delayed in Cited2 null rat placentation sites. (A) Representative images of wild-type (+/+) and Cited2 null (−/−) rat gd 13.5, 15.5 and 18.5 placentation sites immunostained for cytokeratin (green). The cytokeratin immunostain is specific to IT cells that have entered the uterine parenchyma. (Scale bars, 500 µm.) (B) Relative expression of Prl7b1 transcripts (IT cell marker) from wild-type (+/+) and Cited2 null (−/−) gd 13.5 decidual tissue and UPI tissue at gd 15.5 and 18.5 measured by RT-qPCR. Graphs depict mean values ± SEM, n = 11 to 24, unpaired t test, *P < 0.05. (C) In situ hybridization showing Ceacam9 (IT cell marker, red) and Prl7b1 (IT marker, green) transcript localization in gd 15.5 wild-type (+/+) and Cited2 null (−/−) rat placentation sites, (Scale bar, 1,000 µm.) (D) Relative expression of Ceacam9 transcripts (IT cell marker) in gd 15.5 uterine placental interface tissue. Shown are mean values ± SEM, n = 12 to 14, unpaired t test, **P < 0.01. Uterine placental interface (UPI), decidua (DEC), JZ, LZ.
Fig. 4.
Fig. 4.
CITED2 deficiency affects the rat IT cell phenotype. Single-cell RNA sequencing was performed on wild-type (+/+) and Cited2 null (−/−) gd 18.5 UPI tissue samples. (A) UMAP plot showing cell clustering in wild-type (+/+) and Cited2 null (−/−) gd 18.5 UPI tissue (UD1, undefined cell cluster 1; UD2, undefined cell cluster 2). (B) Violin plot showing expression of Cited2 in each cell cluster. Cell clusters: macrophages (MΦ), stromal 1 (S1), natural killer (NK) cells, IT cells, stromal 2 (S2) cells, UD1, UD2, endothelial cells (EC), and fibroblasts (Fb). (C) Ratio of IT cells per total number of cells analyzed. Graph represents mean values ± SEM, n = 3, unpaired t test, *P < 0.05. (D) Number of differentially expressed genes (DEGs) for IT, MΦ, and NK cells from wild-type (+/+) versus Cited2 null (−/−) UPI tissue. (E) Bar plot showing select DEGs in the IT cell cluster (up-regulated shown in red; down-regulated shown in blue). (F) Gene Ontology enriched terms for DEGs from the IT cell cluster.
Fig. 5.
Fig. 5.
CITED2 modulates rat placental responses to physiological stressors. (A) Schematic of the experimental timeline for hypoxia exposure. (B) Representative images of wild-type (+/+) and Cited2 null (−/−) rat gd 13.5 placentation sites exposed to ambient or hypoxic (10.5% oxygen) conditions. Sections were immunostained for cytokeratin (green), perforin (red), and DAPI (blue). (Scale bar, 500 µm.) Abbreviations: Decidua (DEC) and spiral artery (SpA). (C) Depth of gd 13.5 endovascular trophoblast invasion was quantified, and fold changes calculated for hypoxic relative to ambient conditions, n = 5 to 9. (D) Resorption rate assessed on gd 18.5 for individual genotypes from Cited2+/− females bred to Cited2+/− males and exposed to ambient of hypoxic conditions, n = 20 to 33. (E) Schematic of the experimental timeline for polyinosinic:polycytidylic acid (polyI:C) treatment, (F) Relative expression of Isg15, Mx2, Ifi27I2b, and Oasl2 in JZ tissue from control (saline treated; CTRL) and polyI:C exposed (I:C) wild-type (+/+) and Cited2 null (−/−) placentas; n = 8 to 17. Shown are mean values ± SEM, one-way analysis of variance, Tukey’s post hoc test. *P < 0.05, **P < 0.01, ***P < 0.001, ****P < 0.0001.
Fig. 6.
Fig. 6.
CITED2 regulates human EVT cell differentiation. (AF) In situ hybridization showing CITED2 transcript localization in first trimester (12 wk) human placenta: CITED2 (A, red), CDH1 (B, green; marker of basal cytotrophoblast), CITED2 and CDH1 colocalization (C), CITED2 (D, red), NOTUM (E, green; marker of differentiating EVT cells), CITED2 and NOTUM colocalization (F). (Scale bar, 50 µm.) (G) Relative expression of stem state cell signature transcripts (NPPB, PEG10), EVT cell signature transcripts (FLT4 and NOTUM), and CITED2 transcript in human TS cells in the stem state and following eight days of EVT cell differentiation, n = 5. (H) Relative expression of CITED2 transcript levels in EVT cells expressing control (CTRL) or CITED2 shRNAs, n = 3. (I) Phase-contrast images depicting cell morphology of stem and EVT differentiated cells expressing CTRL or CITED2 shRNAs. White arrow is indicating a cluster of cells exhibiting stem-like morphology. (Scale bar, 500 µm.) (J) Movement of human TS cells through a Matrigel-coated transwell insert for cells expressing CTRL or CITED2 shRNAs. (K) Heatmap showing select transcripts from RNA-seq analysis of human TS cells exposed to CTRL shRNA versus CITED2 shRNA during EVT cell differentiation. (L) Relative expression of EVT cell signature transcripts (FLT4 and NOTUM) and stem state cell signature transcripts (NPPB, PEG10) from human TS cells exposed to CTRL shRNA versus CITED2 shRNA during EVT cell differentiation, n = 3. Graphs represent mean values ± SEM, unpaired t test, *P < 0.05, **P < 0.01, ***P < 0.001, and ****P < 0.0001.

References

    1. Maltepe E., Fisher S. J., Placenta: The forgotten organ. Annu. Rev. Cell Dev. Biol. 31, 523–552 (2015). - PubMed
    1. Burton G. J., Fowden A. L., Thornburg K. L., Placental origins of chronic disease. Physiol. Rev. 96, 1509–1565 (2016). - PMC - PubMed
    1. Soares M. J., Varberg K., Iqbal K., Hemochorial placentation: Development, function, and adaptations. Biol. Reprod. 99, 196–211 (2018). - PMC - PubMed
    1. Knöfler M., et al. , Human placenta and trophoblast development: Key molecular mechanisms and model systems. Cell Mol. Life Sci. 76, 3479–3496 (2019). - PMC - PubMed
    1. Pijnenborg R., Robertson W. B., Brosens I., Dixon G., Trophoblast invasion and the establishment of haemochorial placentation in man and laboratory animals. Placenta 2, 71–91 (1981). - PubMed

Publication types