

doi: 10.1182/blood.2022018797.
Monoclonal gammopathy of thrombotic/thrombocytopenic significance
Affiliations
- PMID: 36626584
- PMCID: PMC10113173
- DOI: 10.1182/blood.2022018797
Item in Clipboard
Monoclonal gammopathy of thrombotic/thrombocytopenic significance
Blood.
.
No abstract available
Conflict of interest statement
Conflict-of-interest disclosure: A.P. reports pending/issued patents (Mayo Clinic, Retham Technologies, and Versiti Blood Center of Wisconsin), equity ownership in and serving as an officer of Retham Technologies, and member of the advisory board of Veralox Therapeutics. D.M. has pending/issued patents (Dow Corning, Eastman Kodak, and Mayo Clinic) and is an inventor of the “Mass-Fix” mass spectrometry-based assay for the detection of monoclonal gammopathy. The remaining authors declare no competing financial interests.
Figures
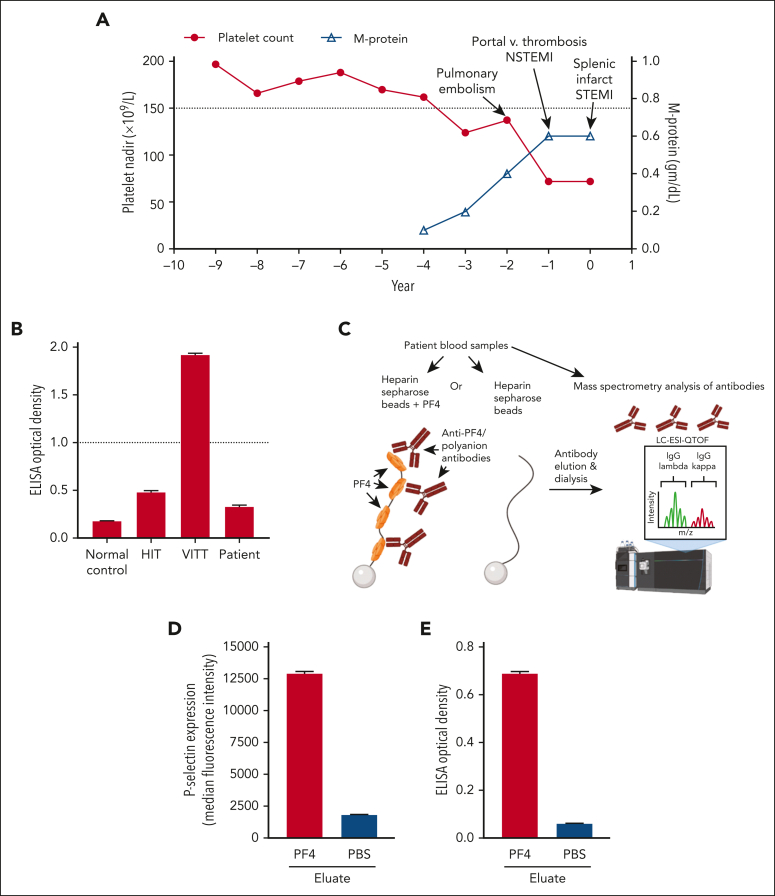
Trending of laboratory variables and affinity purification of the anti-PF4/polyanion antibody. (A) Nadir platelet count (closed circles) and peak serum monoclonal protein (M-protein) levels (open triangles) for each year of clinical data prior to and including the year of presentation to Mayo Clinic are shown on the left and right y-axes, respectively. The lower limit of the normal platelet reference range is depicted by a dotted line (150 × 109/L). (B) HIT, VITT (Ad26.COV2.S-associated), normal control, and patient samples were run in an uncomplexed PF4 (VITT) ELISA. The dotted line represents the positive cutoff of the assay. (C) Experimental scheme for affinity purification of anti-PF4/polyanion antibodies is shown. (D-E) Eluates from PF4/heparin or phosphate-buffered saline (PBS)/control beads were evaluated for their ability to activate PF4-treated platelets (D) and bind PF4/polyanion targets (E). Mean and 1 SD of triplicate measurements are presented in (B), (D), and (E), and (A) presents single measurements of nadir platelet counts and M-protein level. m/z, mass-to-charge ratio; STEMI; ST elevation myocardial infarction; NSTEMI, non-ST elevation myocardial infarction.
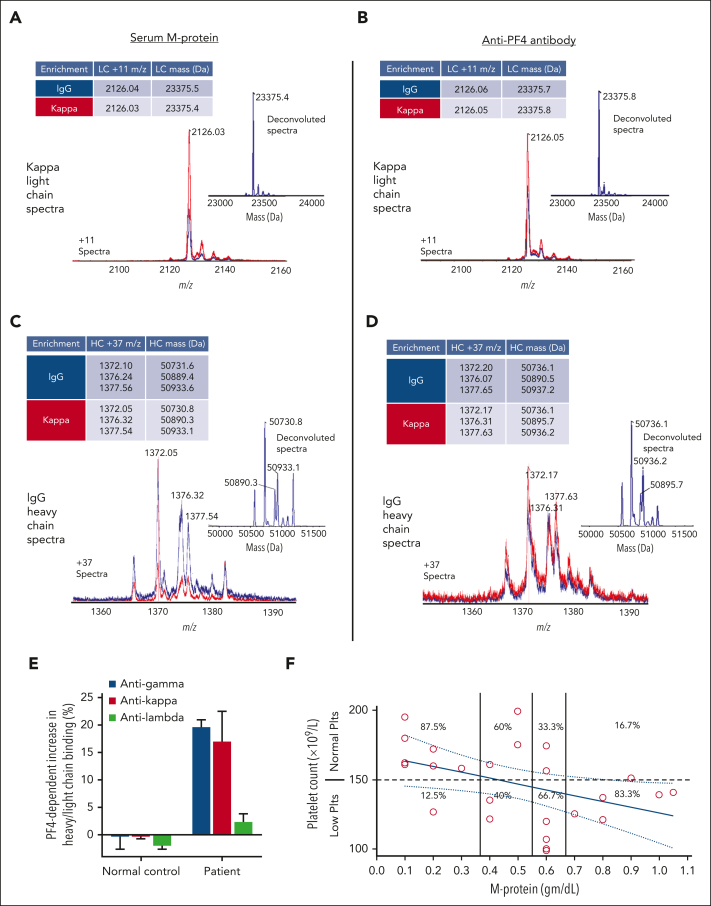
M-protein and monoclonal anti-PF4/polyanion antibody light and heavy chains have identical mass spectrometry profiles. (A) Displayed are LC-ESI-QTOF MS light chain (LC) +11 (m/z) distributions of serum proteins and (B) anti-PF4/polyanion antibodies isolated from the patient’s serum using PF4-treated heparin Sepharose beads, as described. In the spectra, red represents the +11 m/z distribution of all κ containing immunoglobulins, and blue represents the +11 m/z LC distribution of κ chains associated with an IgG heavy chain (HC). The number above each peak indicates the identified chain’s +11 m/z ratio. The x-axis depicts m/z ratios, and the height of the peak shows the identified antibodies’ relative abundance. Each subpanel contains an inset depicting the deconvoluted spectra with the molecular mass of the identified immunoglobulin LC and a table summarizing the major LC m/z values and deconvoluted masses. Similar to (A) and (B), (C) and (D) display the +37 m/z HC distribution and deconvoluted spectra for the immunoglobulin γ (G) HC spectra from MGTS patient serum and anti-PF4 antibody enriched eluate, respectively. The various peaks in (C) and (D) depict differentially glycosylated forms of the HC immunoglobulin. (E) PF4-dependent binding of patient IgG HC (γ) and κ/λ LCs to normal donor platelets were evaluated. Mean and 1 SD of triplicate measurements are presented. (F) Platelet counts (y-axis) were correlated with M-protein levels (x-axis). M-protein intervals were qualitatively grouped into 4 intervals and the percentage of normal (≥150 × 109/L) and low (<150 × 109/L) platelet counts are displayed for each interval. M-protein and platelet count represented by each data point were obtained on the same day of testing, except on 2 occasions when they were drawn within 48 hours of each other.
References
Publication types
MeSH terms
Grants and funding
LinkOut - more resources
Full Text Sources
Medical
