. 2023 Jan 25;145(3):1593-1606.
doi: 10.1021/jacs.2c09129. Epub 2023 Jan 10.

Engineered PROTAC-CID Systems for Mammalian Inducible Gene Regulation

Affiliations

Engineered PROTAC-CID Systems for Mammalian Inducible Gene Regulation

Dacheng Ma et al. J Am Chem Soc. .

Abstract

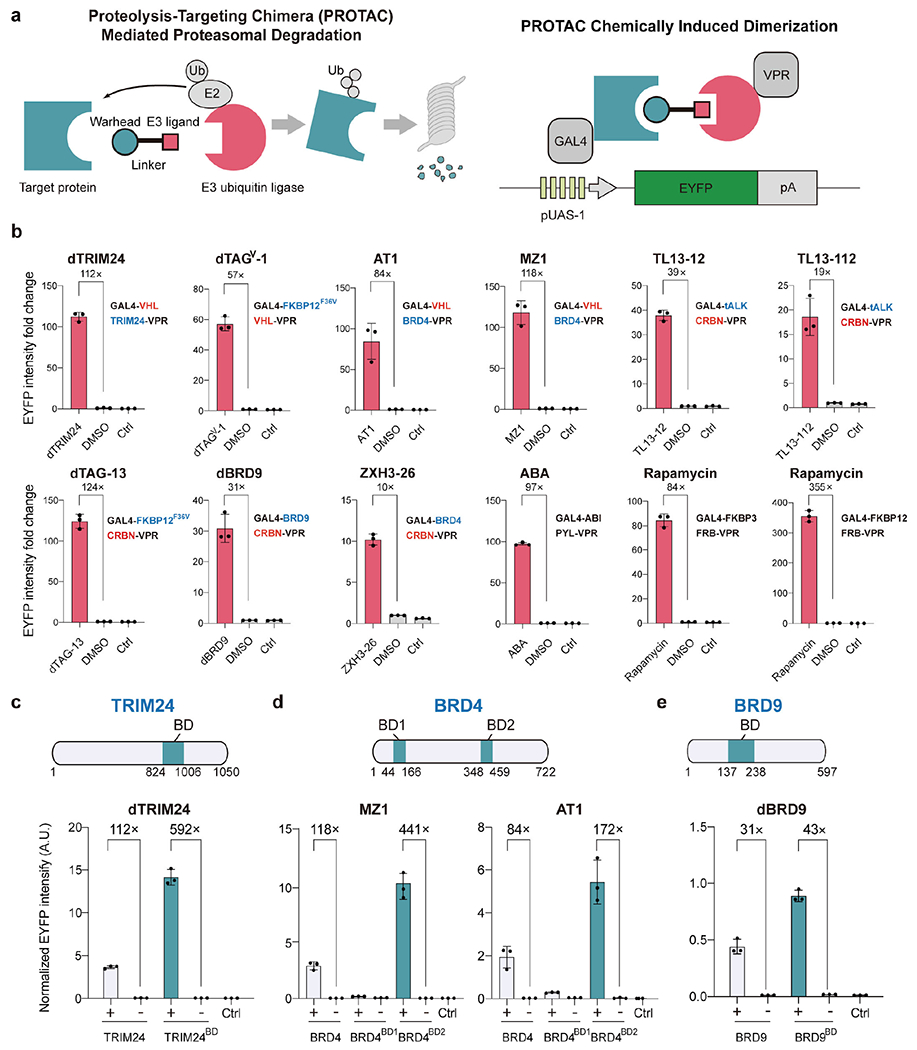
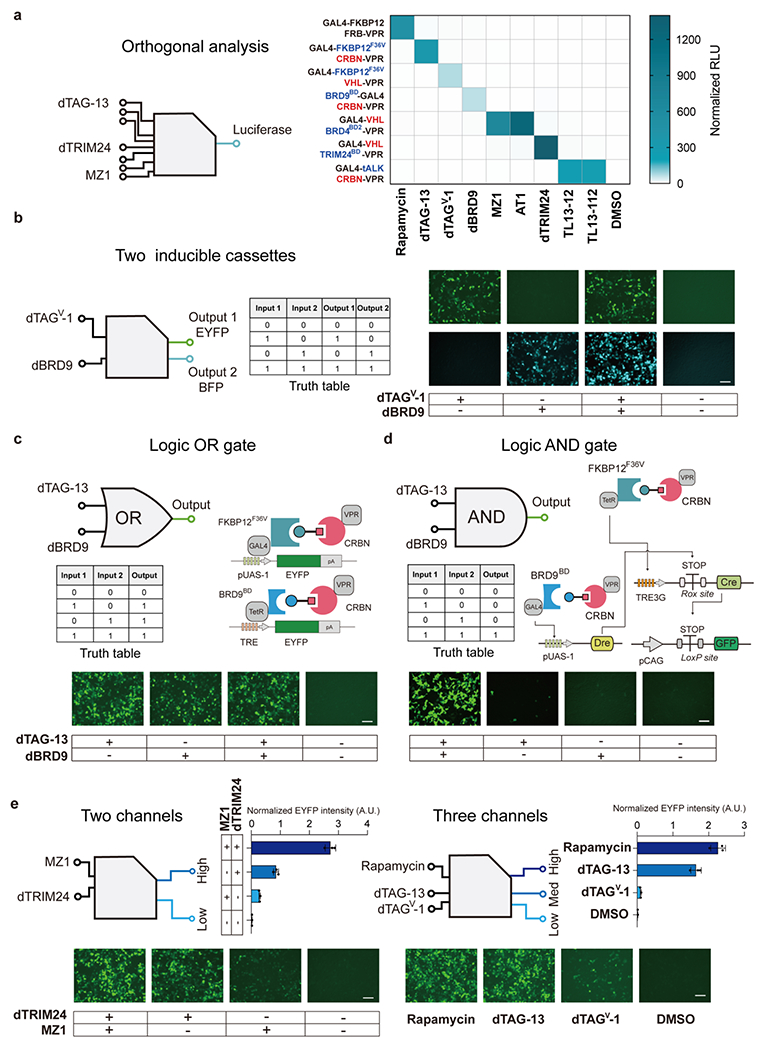
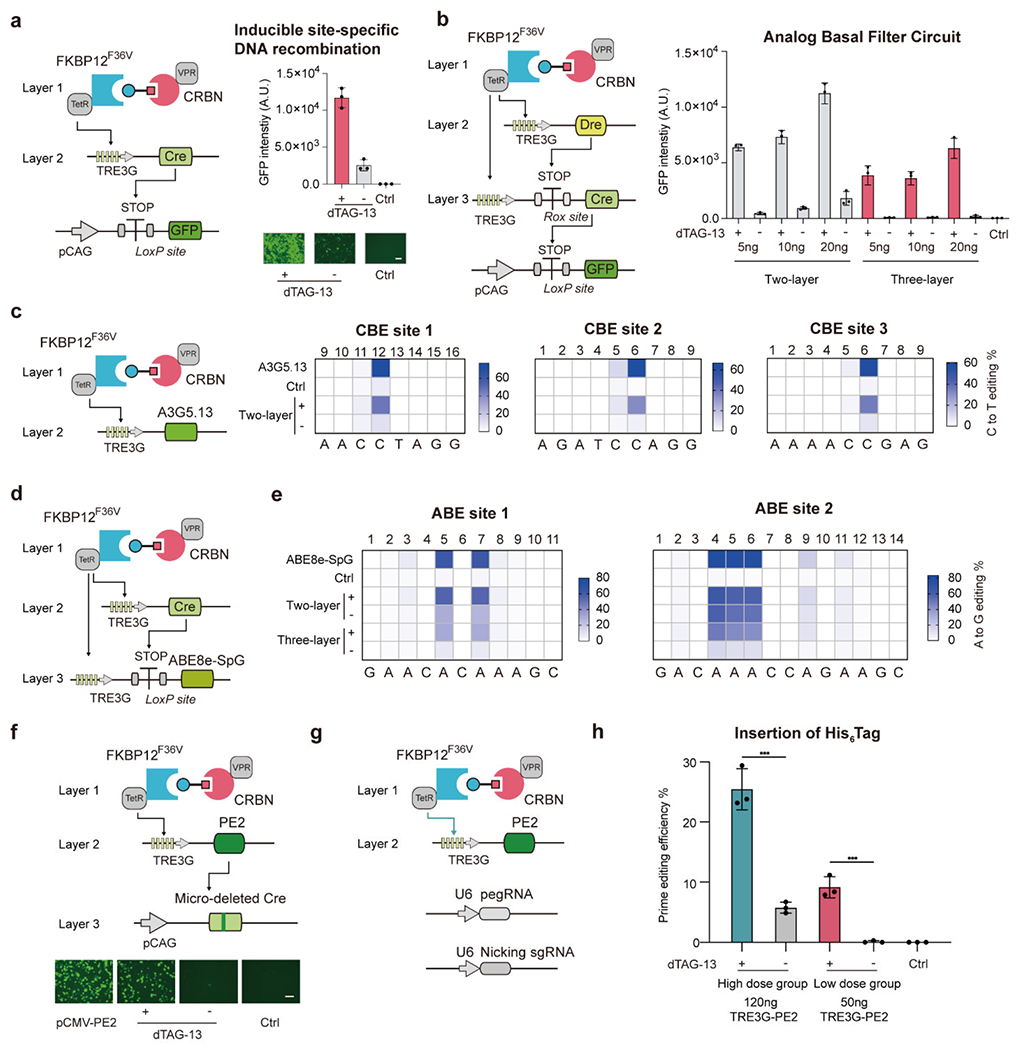
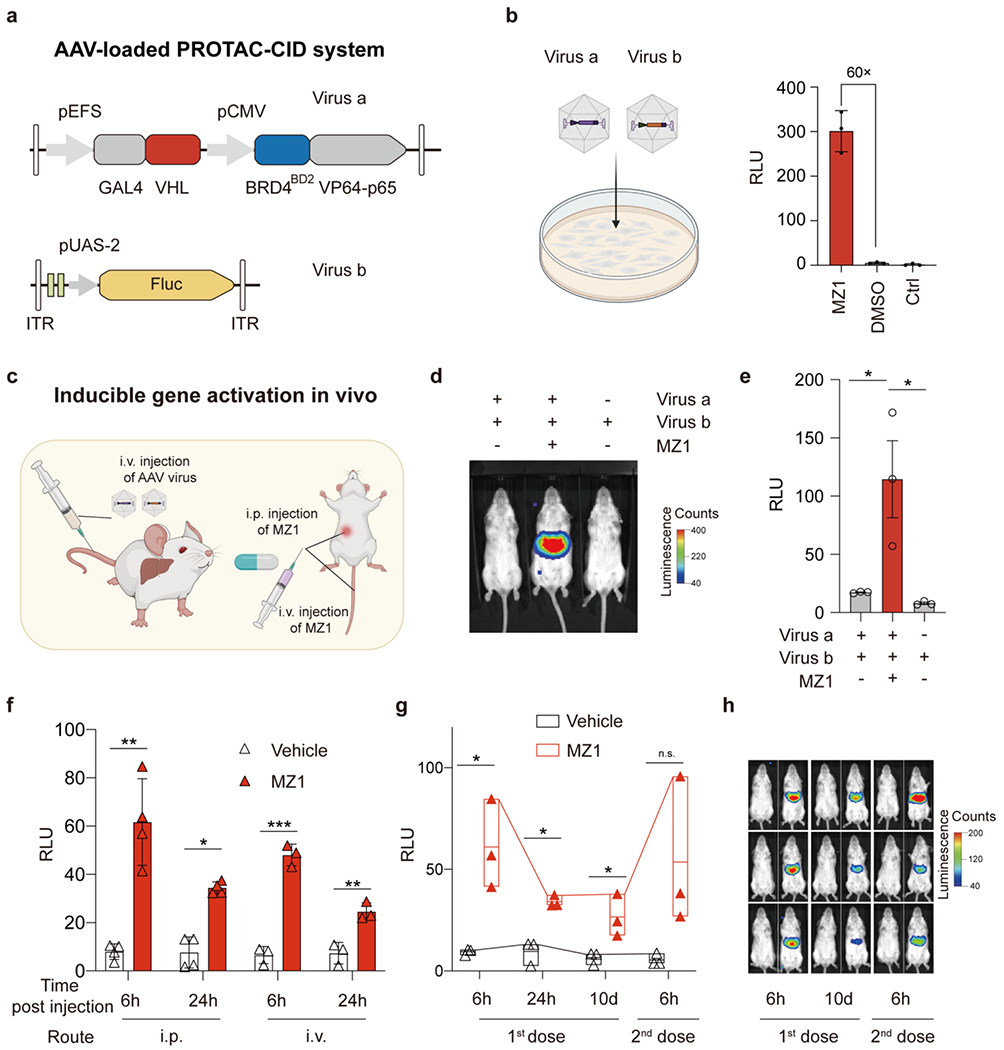
Gene regulation via chemically induced dimerization (CID) is useful for biomedical research. However, the number, type, versatility, and in vivo applications of CID tools remain limited. Here, we demonstrate the development of proteolysis-targeting chimera-based scalable CID (PROTAC-CID) platforms by systematically engineering the available PROTAC systems for inducible gene regulation and gene editing. Further, we show orthogonal PROTAC-CIDs that can fine-tune gene expression at gradient levels or multiplex biological signals with different logic gating operations. Coupling the PROTAC-CID platform with genetic circuits, we achieve digitally inducible expression of DNA recombinases, base- and prime-editors for transient genome manipulation. Finally, we package a compact PROTAC-CID system into adeno-associated viral vectors for inducible and reversible gene activation in vivo. This work provides a versatile molecular toolbox that expands the scope of chemically inducible gene regulation in human cells and mice.


Conflict of interest statement

X.G. and D.M. are co-inventors on a provisional patent application filed by Rice University related to this work. The other authors declare no competing interests.

Figures

Figure 1.
Figure 1.
Repurposing PROTACs for inducible gene activation. (a) Schematic of the PROTAC system for the degradation of target proteins (left). E2, E2 ubiquitin ligase. Ub, Ubiquitin. Schematic of the repurposed PROTAC-CID system for inducible gene expression (right). A PROTAC target protein or an E3 ubiquitin ligase fused with the DNA-binding domain GAL4 or the transactivation domain VPR. GAL4 binds to the cognate upstream activation sequence promoter (pUAS-1). PROTACs recruit the VPR domain to the pUAS-1 for enhanced yellow fluorescent (EYFP) protein expression. pA, polyA signal. (b) The relative EYFP fluorescence intensity was measured by flow cytometry in response to PROTACs or solvent Dimethylsulfoxide (DMSO) after 2 days of induction. The concentration for each small molecule and the protein fusion strategy are listed in Table S1. The target protein is shown in blue and E3 ubiquitin ligase is shown in red. (c-e), EYFP signal intensity in the presence of 5 μM dTRIM24 (c), 100 nM MZ1 or 1 μM AT1 (d), or 1 μM dBRD9 (e) or DMSO (shown as “-”) with truncated TRIM24, BRD4, and BRD9, respectively, as indicated. The same data are shown Figure 1b–e with full-length TRIM24, BRD4, and BRD9 for comparison, (b-e) Data are shown in n = 3 biologically independent samples with an error bar of standard deviation (SD). AU, arbitrary units. See Materials and Methods for the EYFP intensity normalization calculation. HEK293T cells transfected with the reporter plasmid encoding pUAS-1 driven EYFP, with no PROTAC or DMSO added, as the blank control group (Ctrl).
Figure 2.
Figure 2.
Multiplexing and gradient gene expression regulation by PROTAC-CIDs. (a), Orthogonality analysis of the PROTAC-CID systems. HEK293T cells were transfected with plasmids encoding each PROTAC-CID and the Fluc reporter, followed by treatment with indicated PROTACs or rapamycin (all cognate and noncognate pairs) for 2 days. Cells were lysed and assayed for the bioluminescence intensity. RLU, relative light units. n = 3 biologically independent repeats with the mean shown in the heatmap. (b), The diagram of a dual orthogonal inducible expression system simultaneously (left). Representative imaging of EYFP and BFP expression after dTAGV-1 or dBRD9 treatment (1 μM) (right). (c), Representative images of EYFP intensity of logic OR gate circuit in HEK293T cells. (b and c) Scale bar, 125 μm. (d), Representative images of the logic AND gate system based on inducible DNA recombinases in HEK293T cells. Scale bar, 100 μm. Pre-mature STOP transcriptional signal flanked with LoxP sites was placed between constitutive pCAG promoter and Gfp gene. Only two PROTAC inducers drive the Cre expression by inducing the TRE3G promoter and removing the STOP signal by induced Dre, the GFP signal will be observed. (c-d) HEK293T cells were induced by 1 μM dBRD9 and 100 nM dTAG-13 for 2 days. (e) Quantitative measurement and microscopy observation of EYFP intensity of the multiple-channel gene regulation system. dTRIM24 5 μM, MZ1 100 nM, Rapamycin 1 μM, dTAG-13 1 μM, dTAGV-1 1 μM. Scale bar, 125 μm. DMSO treated samples are shown as “-”. Data are shown in n = 3 biologically independent samples. Error bar represents SD.
Figure 3.
Figure 3.
High-induction and low-basal level gene regulation for transient genome editing. (a) GFP expression in HEK293T cells was measured by flow cytometry or microscopy to report the expression level of Cre gene in the presence of 100 nM dTAG-13 or DMSO. (b) Schematic of “three-layer” genetic circuits for tightly controlled digital output (left). Quantitative GFP intensity for measuring the Cre expression in HEK293T cells (right). (a) and (b) HEK293T cells transfected with LoxP-STOP-LoxP-GFP reporter plasmid were used as the control group (Ctrl). (c-e), Quantification of base editing efficiency by PROTAC-CID based inducible base editing tools in HEK293T cells driven by 100 nM dTAG-13 for 3 days. (c) C to T editing by inducible A3G5.13-SpCas9 (d) and (e) A to G editing by TRE3G driven or “three-layer” circuit driven PAM-expanded ABE base editor by fusing ABE8e with the SpG Cas9 variant (ABE8e-SpG). (f) Schematic of the PROTAC-CID based inducible prime editing reporter platform (above). Representative images of the GFP intensity induced by dTAG-13 or DMSO after 48h induction (below). HEK293T cells were induced in the presence of 100 nM dTAG-13 or DMSO. HEK293T cells transfected with the LoxP-STOP-LoxP-GFP reporter plasmid and the pCAG driven mutated Cre as the Control group (Ctrl). (g) Schematic of PROTAC-CID based inducible prime editing system for endogenous genome editing. (h) Quantification of His6 Tag insertion efficiency in HEK293T cells after 3 days of induction by 100 nM dTAG-13 or DMSO. The pegRNA and nicking sgRNA sequences are listed in Table S3. ***, p < 0.001. n = 3 biologically independent repeats for all experiments. Error bar represents SD. DMSO is shown as “-” Scale bar, 125 μm.
Figure 4.
Figure 4.
In vivo gene activation by PROTAC-CID. (a) Schematic of AAV-loaded PROTAC-CID system to induce Fluc gene expression. (b) Infecting HEK293T cells by Virus a and Virus b treated by 100 nM MZ1 or DMSO. HEK293T cells without treatment were used as the control (Ctrl). Cells were lysed at 3 days post-infection. (c) Schematic of AAV delivery and MZ1 administration routes. (d) Representative bioluminescence images of mice infected with AAV virus and treated with 10 mg/kg MZ1 or vehicle solution at 6 h post-MZ1 injection. (e) Quantification of the bioluminescence signals in (d). RLU, relative light units. n = 3 mice. The data are mean with standard error of the mean (SEM). (f) Bioluminescence signals after MZ1 injection intraperitoneally (i.p. 50 mg/kg, n = 4 mice) or intravenously (i.v. 10 mg/kg, n = 3 mice). The data shown are the mean with SD. (g-h) Floating bar plot of bioluminescence signals (min to max) with a line at mean and polyline linking the max point at different time points, and representative images of mice after repeated i.p. injection of 50 mg/kg MZ1 (n=3 mice). Asterisks indicate statistical significance using an unpaired two-tailed t-test. *, p < 0.05; **, p < 0.01; ***, p < 0.001; n.s., non-significant.

References

    1. Stanton BZ; Chory EJ; Crabtree GR, Chemically induced proximity in biology and medicine. Science 2018, 359 (6380), 1117–1126. - PMC - PubMed
    1. Fegan A; White B; Carlson JC; Wagner CR, Chemically controlled protein assembly: techniques and applications. Chem Rev 2010, 110 (6), 3315–3336. - PubMed
    1. Jaeger MG; Winter GE, Fast-acting chemical tools to delineate causality in transcriptional control. Mol Cell 2021, 81 (8), 1617–1630. - PubMed
    1. Kitada T; DiAndreth B; Teague B; Weiss R, Programming gene and engineered-cell therapies with synthetic biology. Science 2018, 359 (6376), 651–662. - PMC - PubMed
    1. Alerasool N; Leng H; Lin ZY; Gingras AC; Taipale M, Identification and functional characterization of transcriptional activators in human cells. Mol Cell 2022, 82 (3), 677–695 e7. - PubMed

Publication types