Review
. 2023 Nov 1;78(5):1602-1624.
doi: 10.1097/HEP.0000000000000005. Epub 2023 Jan 3.

Metabolic reprogramming and its clinical implication for liver cancer

Affiliations
Review

Metabolic reprogramming and its clinical implication for liver cancer

Flora Yang et al. Hepatology. .

Abstract

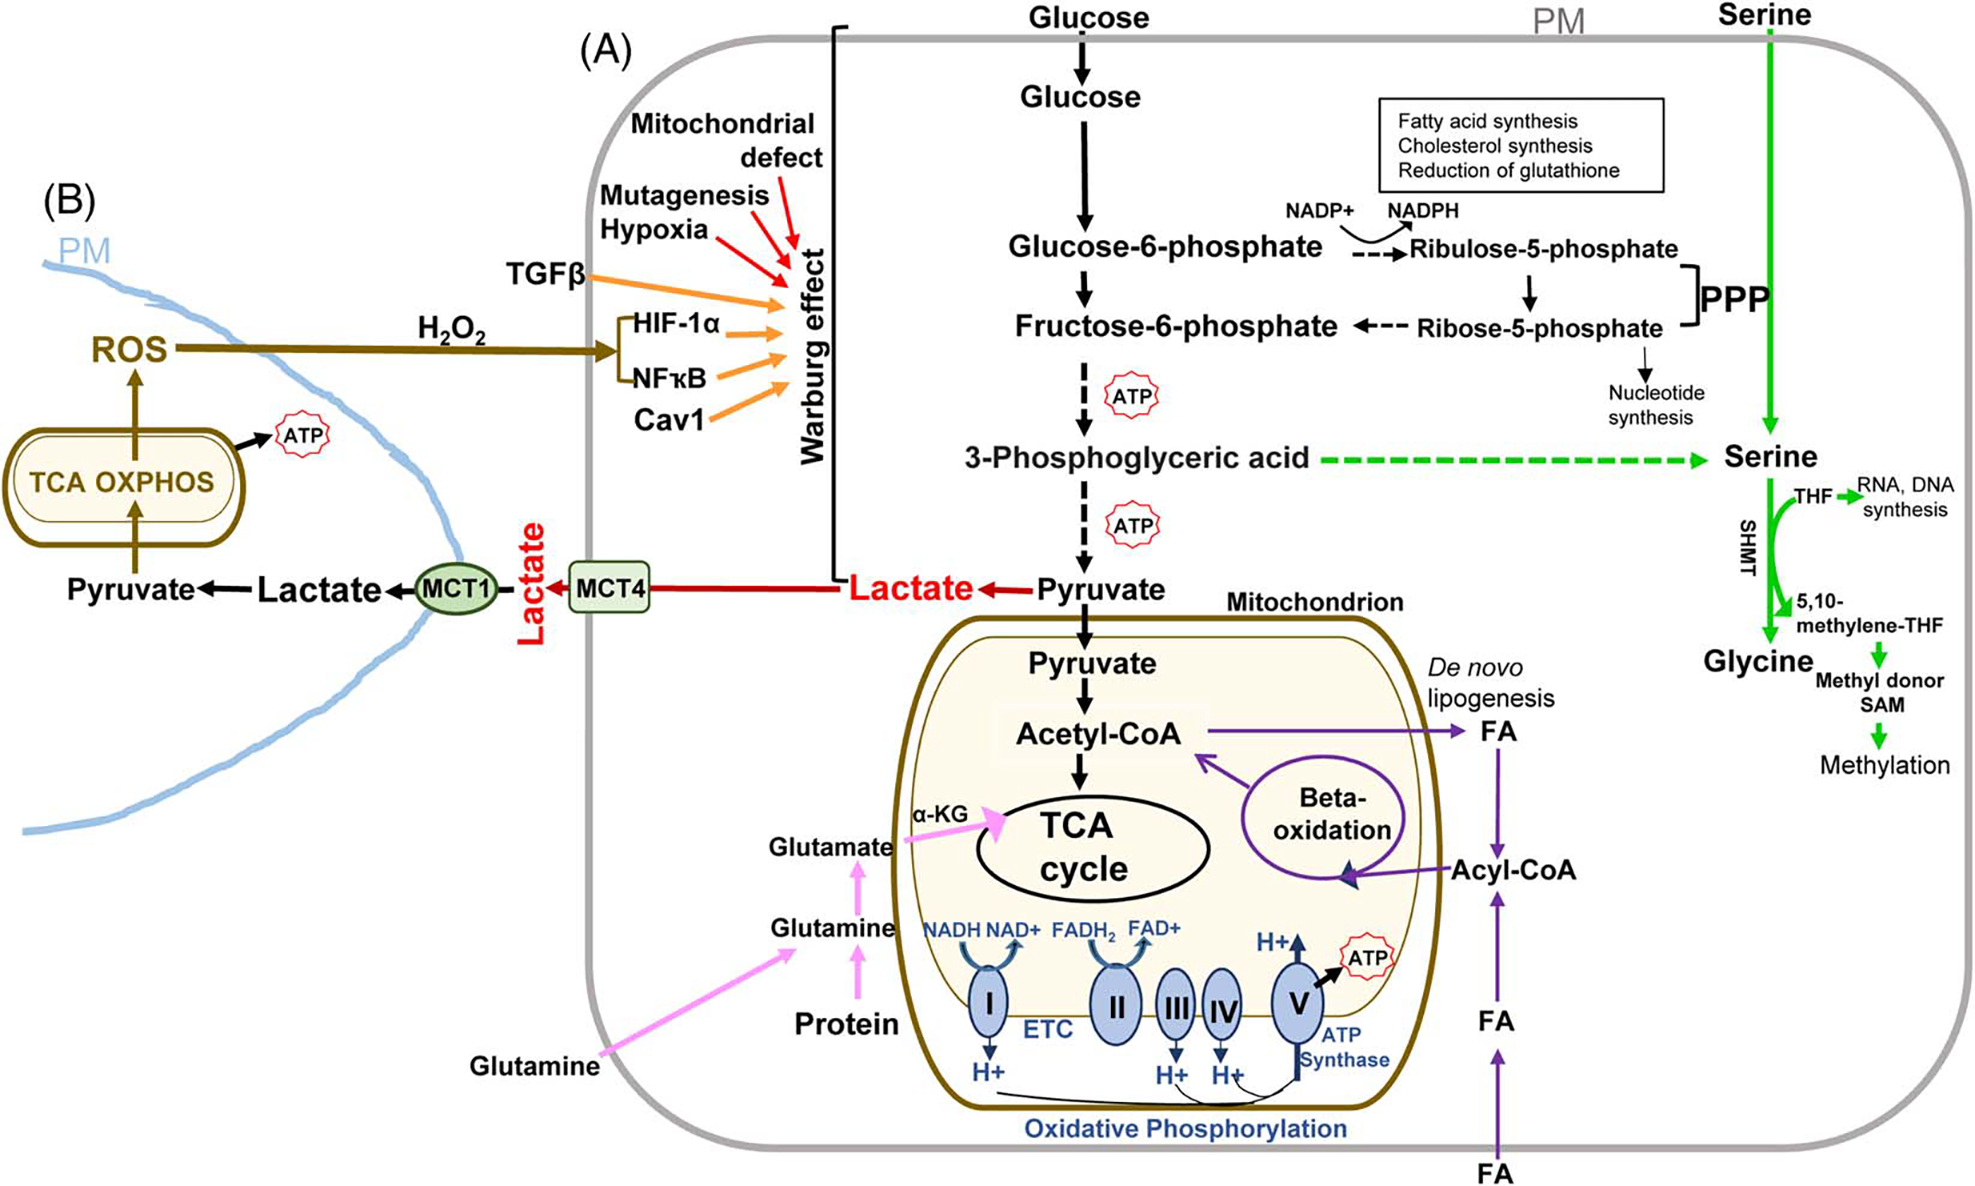
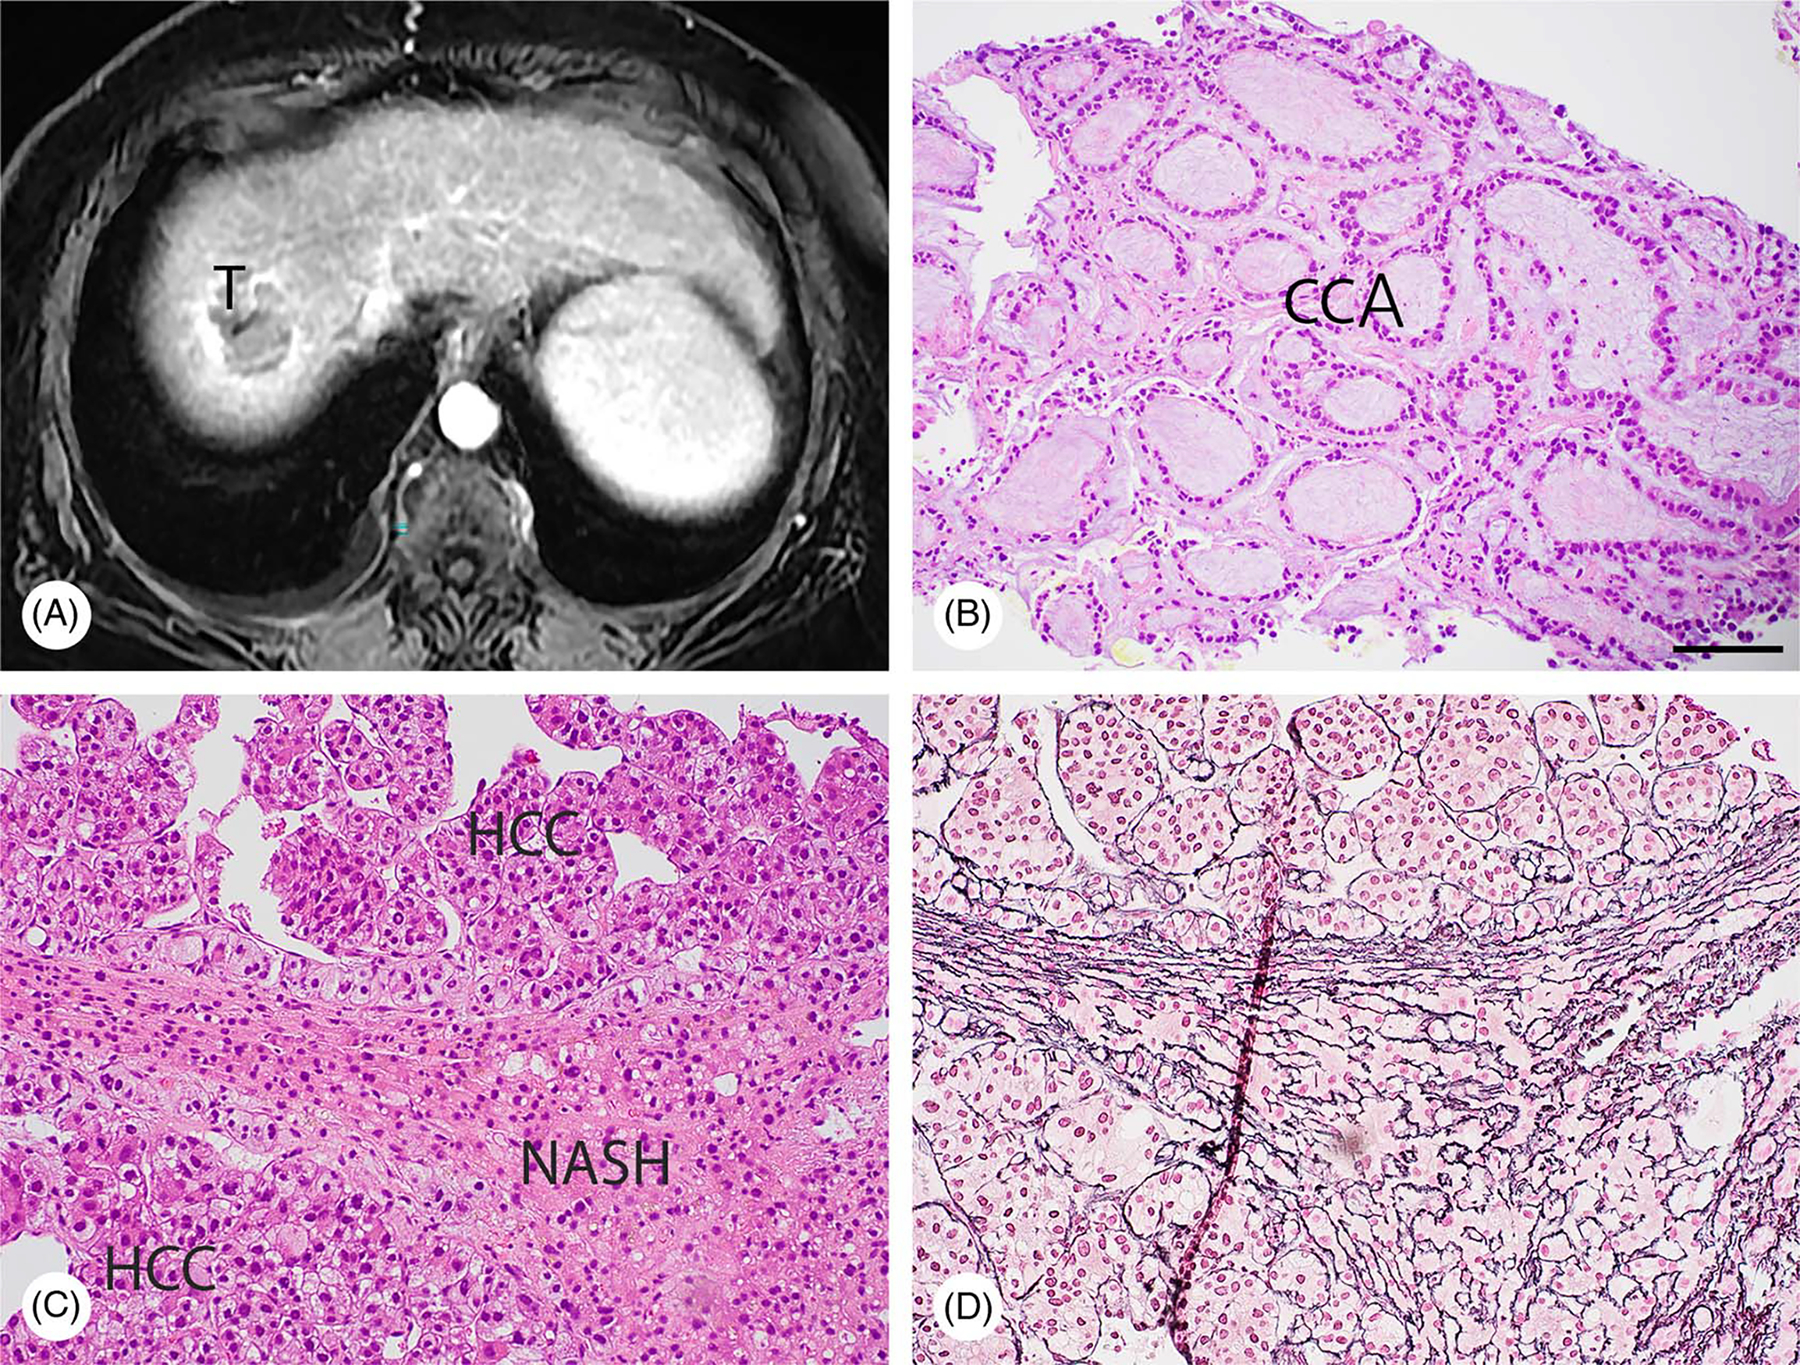
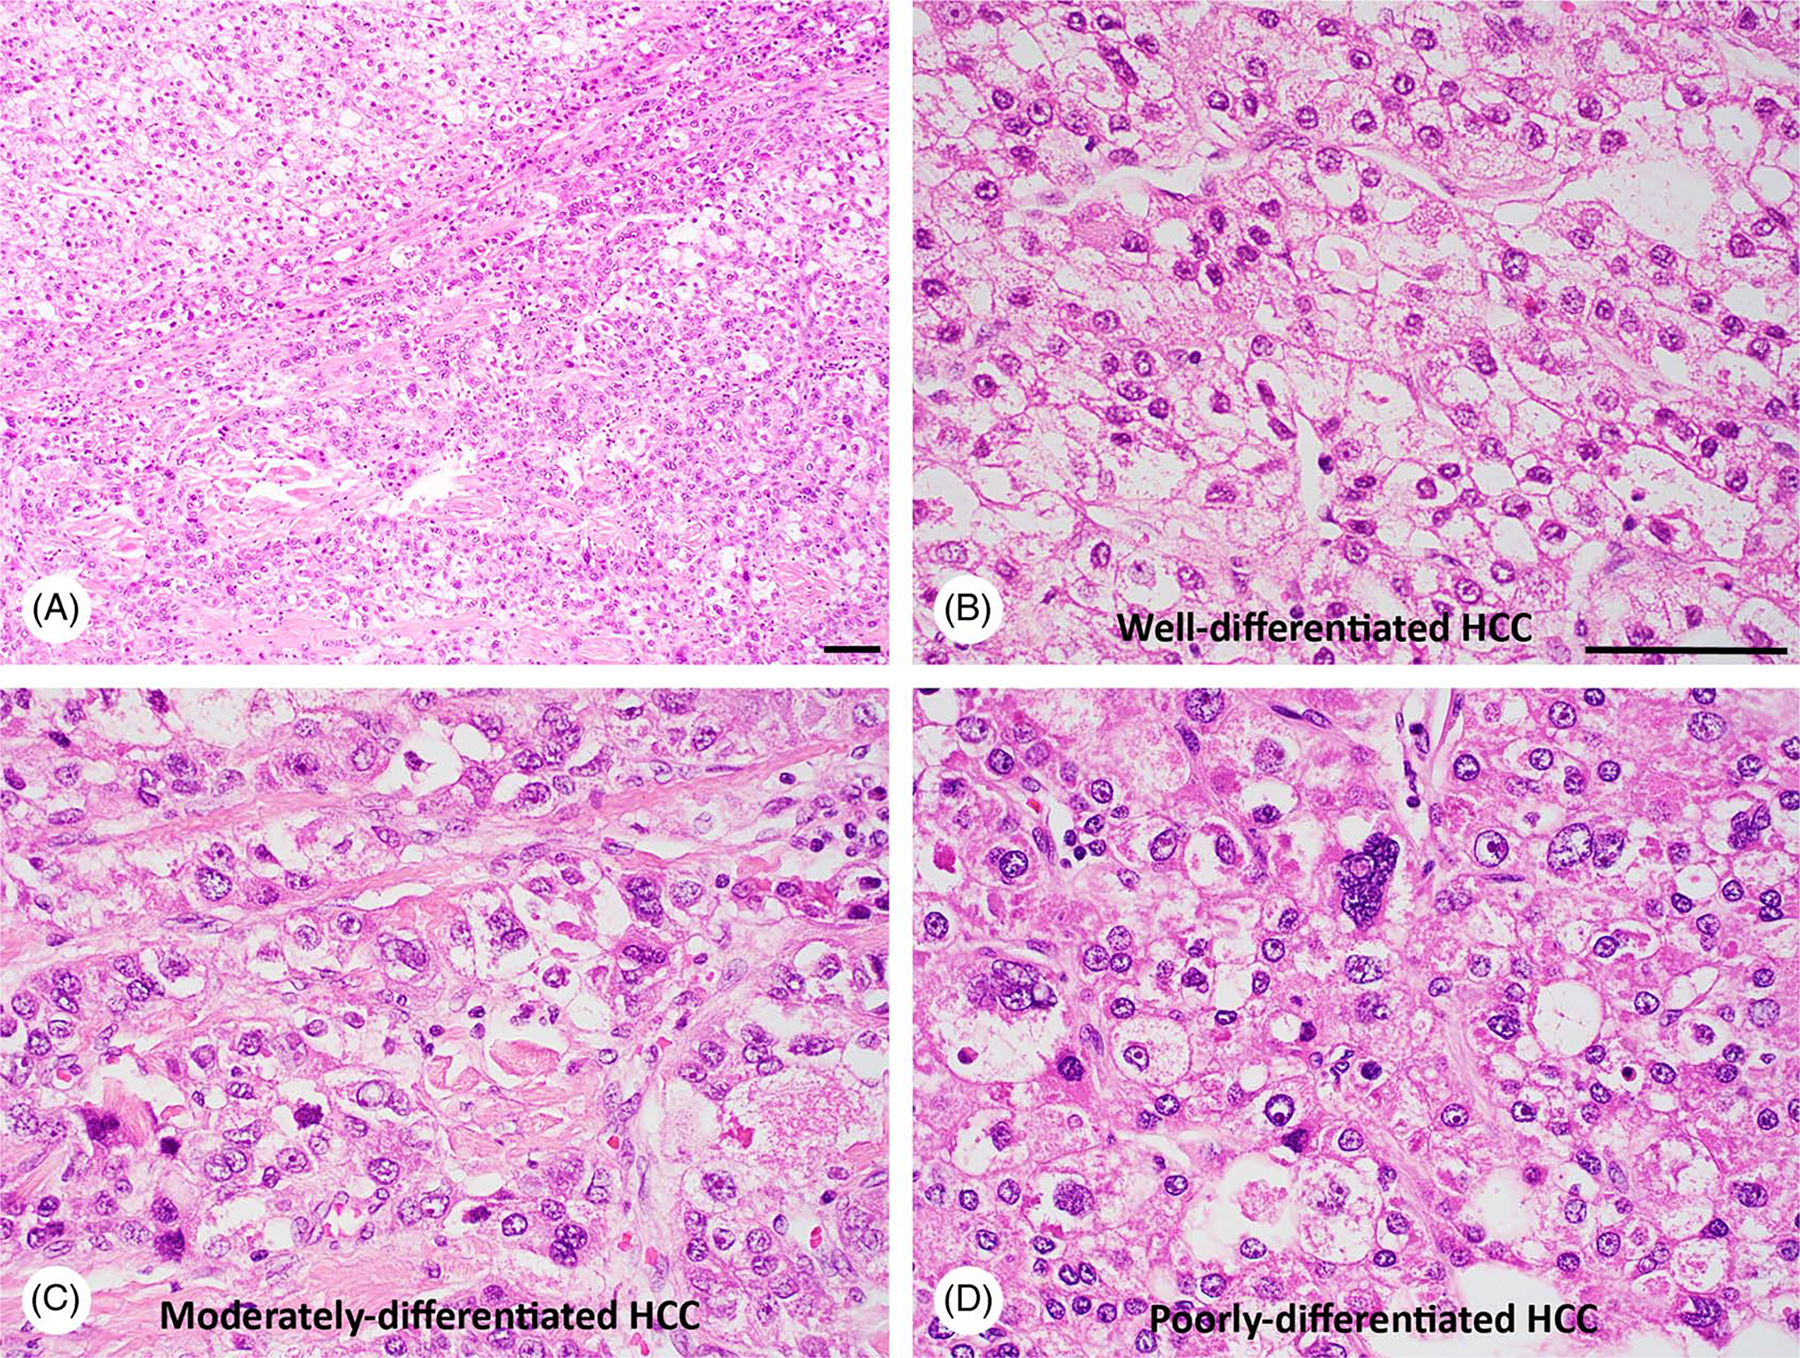
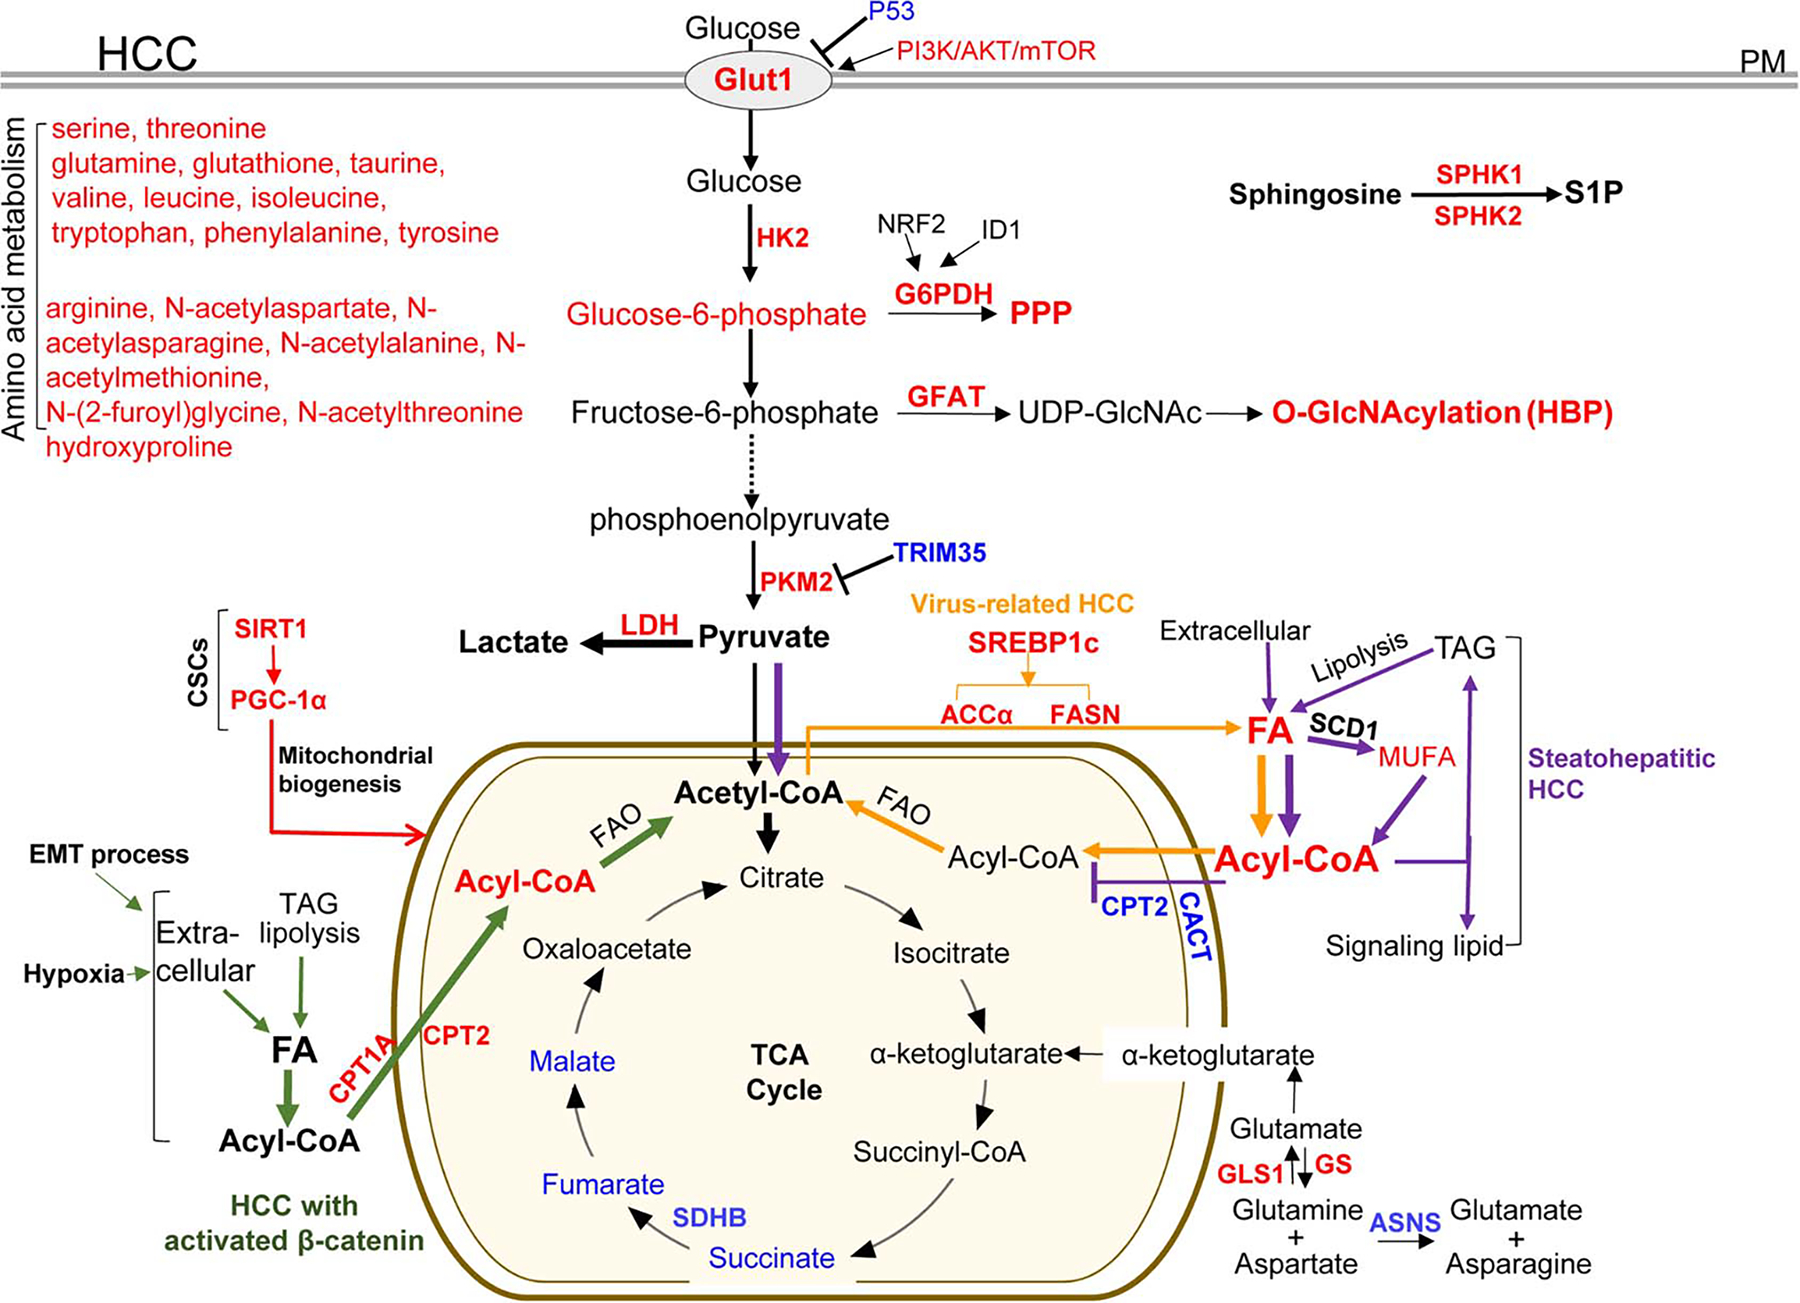
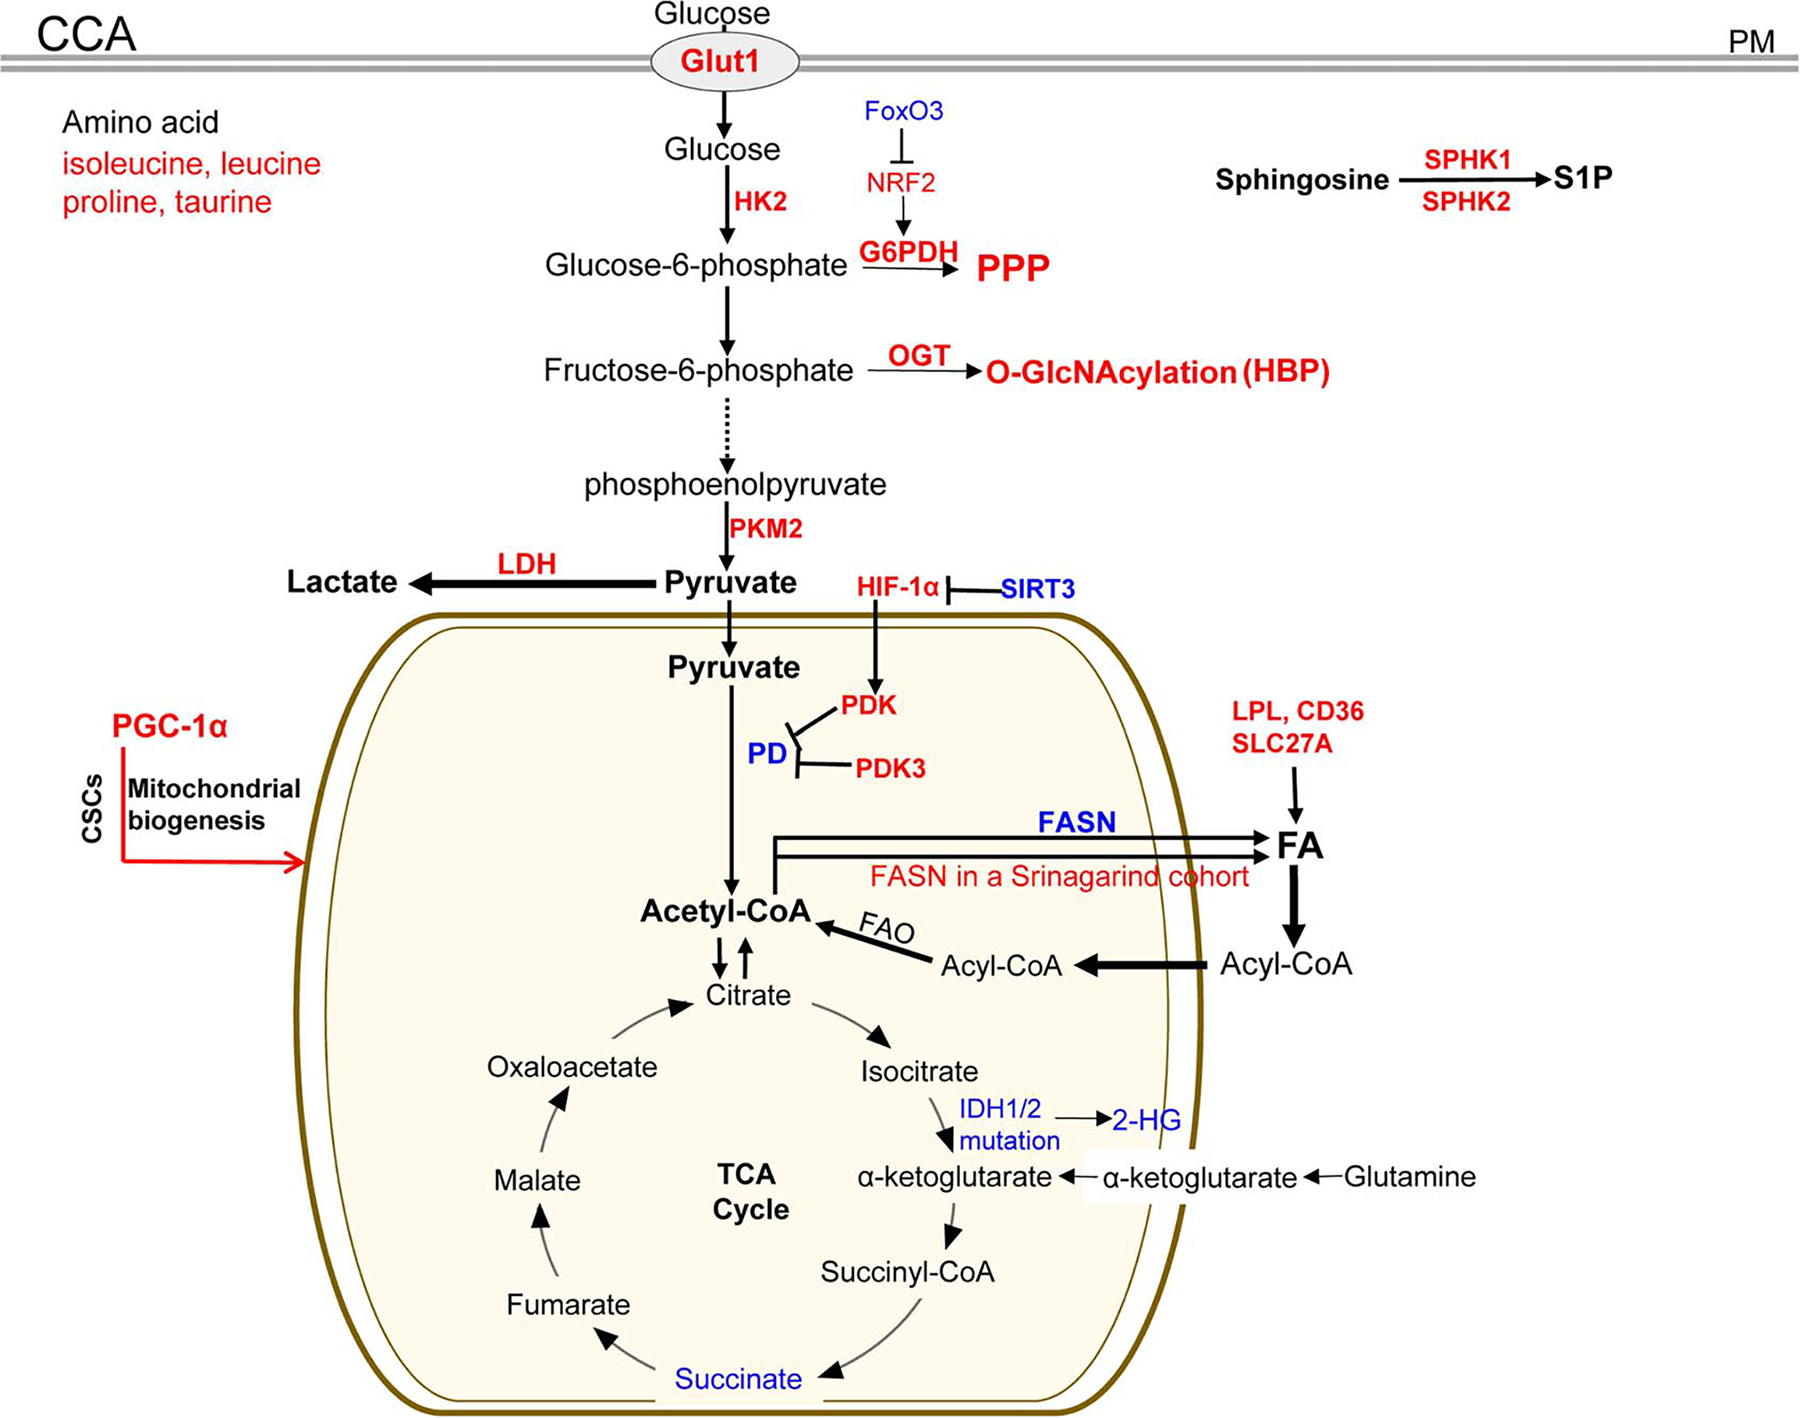
Cancer cells often encounter hypoxic and hypo-nutrient conditions, which force them to make adaptive changes to meet their high demands for energy and various biomaterials for biomass synthesis. As a result, enhanced catabolism (breakdown of macromolecules for energy production) and anabolism (macromolecule synthesis from bio-precursors) are induced in cancer. This phenomenon is called "metabolic reprogramming," a cancer hallmark contributing to cancer development, metastasis, and drug resistance. HCC and cholangiocarcinoma (CCA) are 2 different liver cancers with high intertumoral heterogeneity in terms of etiologies, mutational landscapes, transcriptomes, and histological representations. In agreement, metabolism in HCC or CCA is remarkably heterogeneous, although changes in the glycolytic pathways and an increase in the generation of lactate (the Warburg effect) have been frequently detected in those tumors. For example, HCC tumors with activated β-catenin are addicted to fatty acid catabolism, whereas HCC tumors derived from fatty liver avoid using fatty acids. In this review, we describe common metabolic alterations in HCC and CCA as well as metabolic features unique for their subsets. We discuss metabolism of NAFLD as well, because NAFLD will likely become a leading etiology of liver cancer in the coming years due to the obesity epidemic in the Western world. Furthermore, we outline the clinical implication of liver cancer metabolism and highlight the computation and systems biology approaches, such as genome-wide metabolic models, as a valuable tool allowing us to identify therapeutic targets and develop personalized treatments for liver cancer patients.


Conflict of interest statement

CONFLICT OF INTEREST

Nothing to report.

Figures

FIGURE 1
FIGURE 1
Major metabolic pathways and alterations in cancer. Upon entering a cell, glucose undergo glycolysis to form pyruvate. In the absence of oxygen, pyruvate engages in fermentation to form lactate (cell A, red). If the cell has a sufficient oxygen supply, pyruvate is converted into acetyl-CoA in the mitochondria where the TCA cycle and OXPHOS occur. The TCA cycle plays a central role in the breakdown of organic molecules and in generation of NADH and FADH2 for OXPHOS, a process that produces the most amount of ATP from the transfer of electrons through the ETC (cell A, blue). Through β-oxidation, FAs are broken down to form acetyl-CoA to enter the TCA cycle (cell A, purple lines). FAs are either imported from the extracellular space or by de novo lipogenesis (cell A, purple lines). Amino acids can enter different pathways of cellular respiration. For example, glutamine is converted to α-KG to refills the TCA cycle (cell A, pink lines). PPP is a branch of the glycolysis that forms ribulose-5-phosphate, NADPH, and ribose-5-phosphate used for synthesis of cholesterol, FAs, nucleotides, as well as for reduction of glutathione. The serine synthesis pathway is another branch of the glycolysis pathway (cell A, green lines). SHMT converts serine to glycine and the metabolites THF and 5,10-methylene THF are used for DNA and RNA synthesis or converted into a methyl donor S-adenosyl methionine (SAM). Mitochondrial defects, oncogenic mutations and signals, or hypoxia lead to the Warburg effect in cancer cells (cell A, red lines). TGFβ is in the extracellular space and ROS can be released from a neighboring cell that engages in mitochondrial metabolism (cell B, brown lines). TGFβ or ROS is able to reprogram a CAF or cancer cell to the Warburg effect by a HIF-1α-, NFҡB, or Cav1-dependent mechanism (cell A, orange lines). MCT4 at the plasma membrane is responsible for lactate export (cell A, green) and MCT1 is responsible for lactate uptake (cell B, green). A dashed line indicates multiple steps in between. Acetyl-CoA indicates acetyl coenzyme A; α-KG: α-ketoglutarate; CAF, cancer-associated fibroblast; Cav1, caveolin-1; ETC, electron transport chain; FA, fatty acid; FADH2, reduced flavin adenine dinucleotide; FAD, flavin adenine dinucleotide; HIF-1α, hypoxia-induced factor 1 alpha; OXPHOS, oxidative phosphorylation; MCT1, monocarboxylate transporter 1; MCT4, monocarboxylate transporter 4; PM, plasma membrane; PPP: the pentose phosphate pathway; ROS, reactive oxygen species; SAM, S-adenosyl methionine; SHMT, serine hydroxylmethyltransferase; TCA: tricarboxylic acid; THF, tetrahydrofolate; 5,10-methylene THF, 5,10-methylene tetrahydrofolate; I: NADH-coenzyme Q reductase; II: succinate coenzyme Q reductase; III: coenzyme Q cytochrome c reductase; IV: cytochrome c oxidase; V: ATP synthase.;
FIGURE 2
FIGURE 2
NASH leads to both HCC and CCA in a 71-year-old female patient. (A) MRI (axial, water Ph4/GAD) revealing a 4.7 cm liver segment VIII mass (T) not specific for HCC. (B and C) Needle core biopsies were subjected to H&E staining, demonstrating that mucin-producing CCA (B) and HCC (C) co-existed on the background of NASH. (D) The result of reticulin staining with an adjacent section is shown. Bar, 50 μm.
FIGURE 3
FIGURE 3
Intratumoral heterogeneity in HCC of a 68-year-old male NASH patient. The liver tumor mass was subjected to H&E staining, revealing well-differentiated HCC (A and B), moderately-differentiated HCC (A and C), as well as poorly-differentiated HCC (A and D). Bar, 50 μm.
FIGURE 4
FIGURE 4
Metabolic enzymes and pathways deregulated in HCC tumors or HCC subsets. Red: the expression level of the enzymes or metabolites is upregulated in HCC tumors compared with nontumoral tissues; blue: the expression level is downregulated. Green lines: a HCC subset with activated β-catenin exclusively uses FA catabolism; purple lines: a steatohepatitic HCC subset shuts down FA catabolism and pyruvate is re-routed into the TCA cycle; orange lines: enhanced lipogenesis in virus-related HCC; and red lines: metabolic changes in CSC cell subset. Acetyl-CoA indicates acetyl coenzyme A; ACCα, acetyl-CoA carboxylase alpha; ASNS, asparagine synthetase; CACT, carnitine acylcarnitine translocase; CPT1A, carnitine palmitoyltransferase 1A; CPT2, carnitine palmitoyltransferase 2; CSC: cancer stem-cell like; EMT, epithelial-to-mesenchymal transition; FAO, fatty acid oxidation; FASN, fatty acid synthase; HK2, hexokinase II; Glut1, glucose transporter 1; GLS1, glutaminase kidney isoform, mitochondrial; GS, glutamine synthetase; G6PDH, glucose-6-phosphate dehydrogenase; GFAT, glutamine:fructose-6-phosphate amidotransferase; HBP, hexosamine biosynthetic pathway; ID1, inhibitor of differentiation 1; LDH, lactic dehydrogenase; MUFA, monounsaturated fatty acids; mTOR, the mammalian target of rapamycin; NRF2, nuclear factor erythroid 2-related factor; O-GlcNAcylation, O-linked β-N-acetylglucosamine; PGC-1α, peroxisome proliferator-activated receptor-gamma coactivator-1alpha; PKM2, pyruvate kinase M; PM, plasma membrane; PPP, the pentose phosphate pathway; SCD1: stearoyl-CoA-desaturase 1; SDHB, succinate dehydrogenase subunit B; SREBP1c, sterol regulatory element-binding protein 1c; SPHK1/2: sphingosine kinase 1 and 2; S1P, sphingosine-1-phosphate;SIRT1, Sirtuin 1; TAG, triglyceride; TRIM35, tripartite motif-containing 35.
FIGURE 5
FIGURE 5
Metabolic enzymes and pathways deregulated in CCA tumors or CCA subsets. Red: the expression level of the enzymes or metabolites is upregulated in CCA tumors compared with nontumoral tissues; blue: the expression level is downregulated. CCA indicates cholangiocarcinoma; CD36, platelet glycoprotein 4; CSC, cancer stem-cell like; FAO, fatty acid oxidation; FoxO3, forkhead box protein O3; Glut1, glucose transporter 1; G6PDH, glucose-6-phosphate dehydrogenase; HIF-1α, hypoxia-induced factor 1 alpha; HK2, hexokinase II; HBP, hexosamine biosynthetic pathway; IDH, isocitrate dehydrogenase; NRF2, nuclear factor erythroid 2-related factor; LDH: lactic dehydrogenase; LPL, lipoprotein lipase; OGT, UDP-N-acetylglucosamine peptide N-acetylglucosaminyltransferase; O-GlcNAcylation, O-linked β-N-acetylglucosamine; PD, pyruvate dehydrogenase; PDK, pyruvate dehydrogenase kinase; PKM2, pyruvate kinase M; PM, plasma membrane; PPP, the pentose phosphate pathway; SIRT3, Sirtuin 3; PGC-1α: peroxisome proliferator-activated receptor-gamma coactivator-1alpha; SPHK1/2, sphingosine kinase 1 and 2; S1P, sphingosine-1-phosphate; SLC27A1, solute carrier family 27 member 1; 2-HG: D-2-hydroxyglutarate.

References

    1. Kim J, DeBerardinis RJ. Mechanisms and implications of metabolic heterogeneity in cancer. Cell Metab. 2019;30:434–46. - PMC - PubMed
    1. DeBerardinis RJ, Chandel NS. Fundamentals of cancer metabolism. Sci Adv. 2016;2:e1600200. - PMC - PubMed
    1. Martinez-Reyes I, Chandel NS. Cancer metabolism: looking forward. Nat Rev Cancer. 2021;21:669–80. - PubMed
    1. Hanahan D, Weinberg RA. Hallmarks of cancer: the next generation. Cell. 2011;144:646–74. - PubMed
    1. Pavlova NN, Thompson CB. The emerging hallmarks of cancer metabolism. Cell Metab. 2016;23:27–47. - PMC - PubMed

MeSH terms