. 2023 Jan 19;186(2):428-445.e27.
doi: 10.1016/j.cell.2022.12.016. Epub 2023 Jan 9.

Dual-specificity RNA aptamers enable manipulation of target-specific O-GlcNAcylation and unveil functions of O-GlcNAc on β-catenin

Affiliations

Dual-specificity RNA aptamers enable manipulation of target-specific O-GlcNAcylation and unveil functions of O-GlcNAc on β-catenin

Yi Zhu et al. Cell. .

Abstract

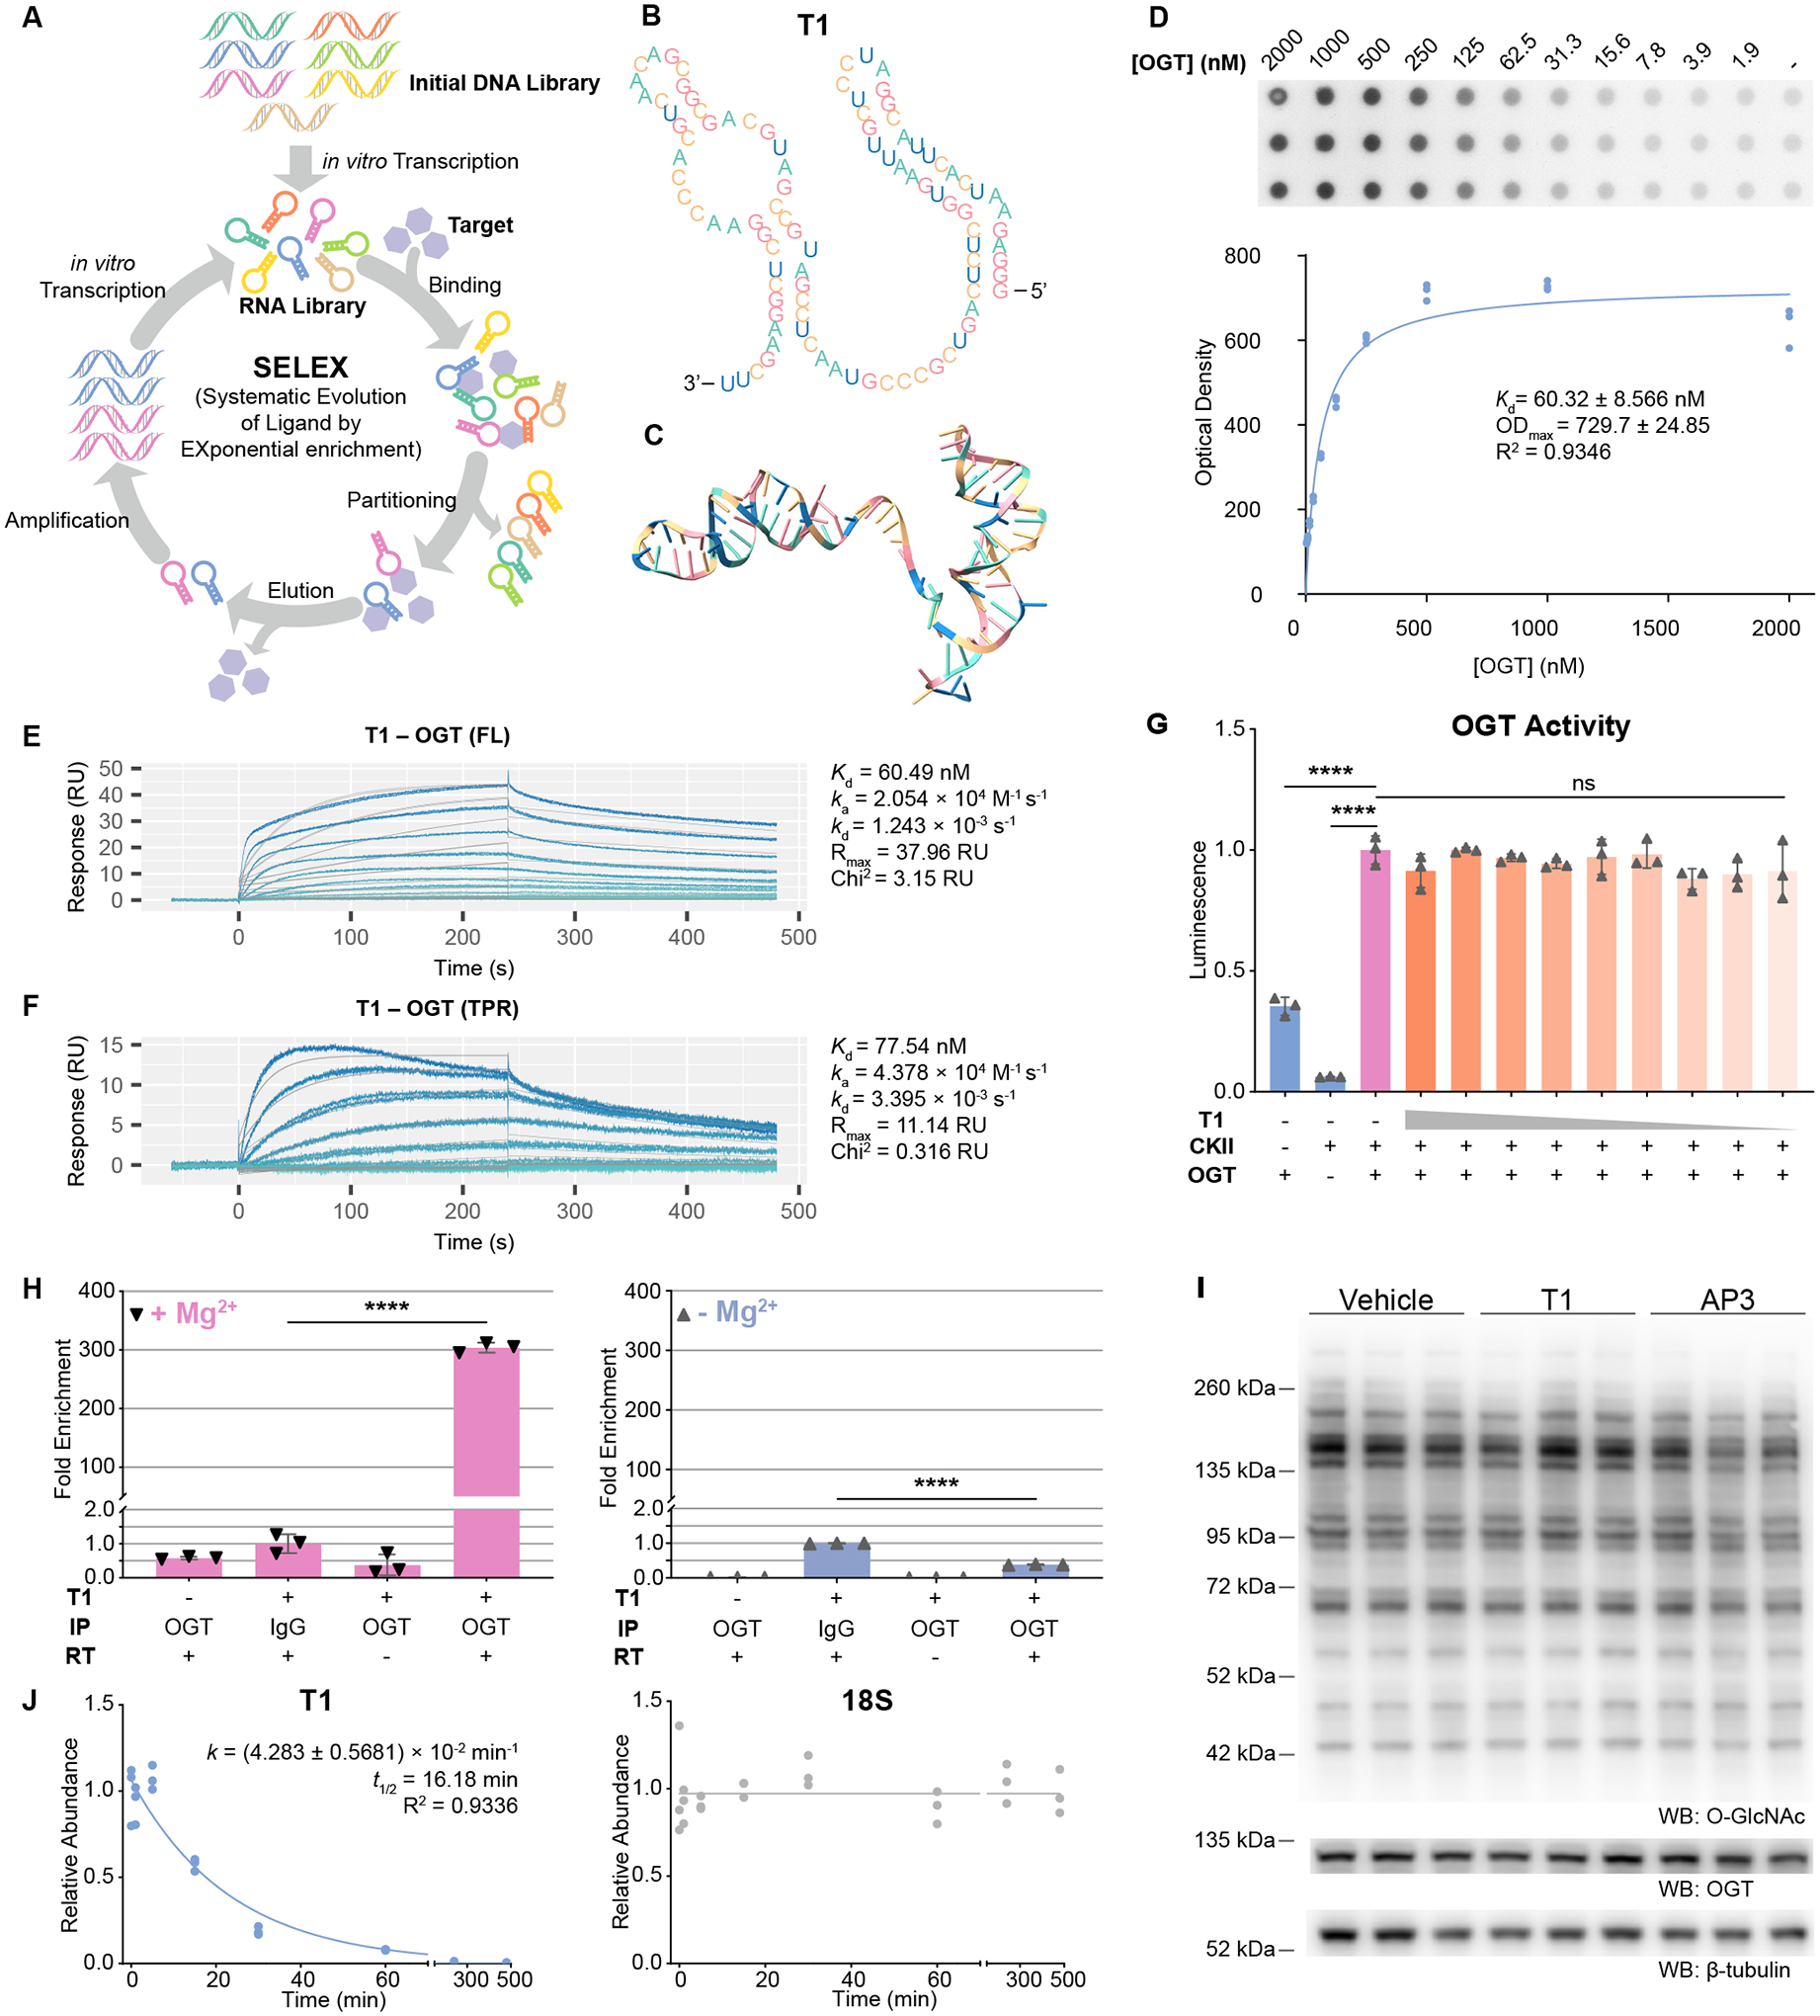
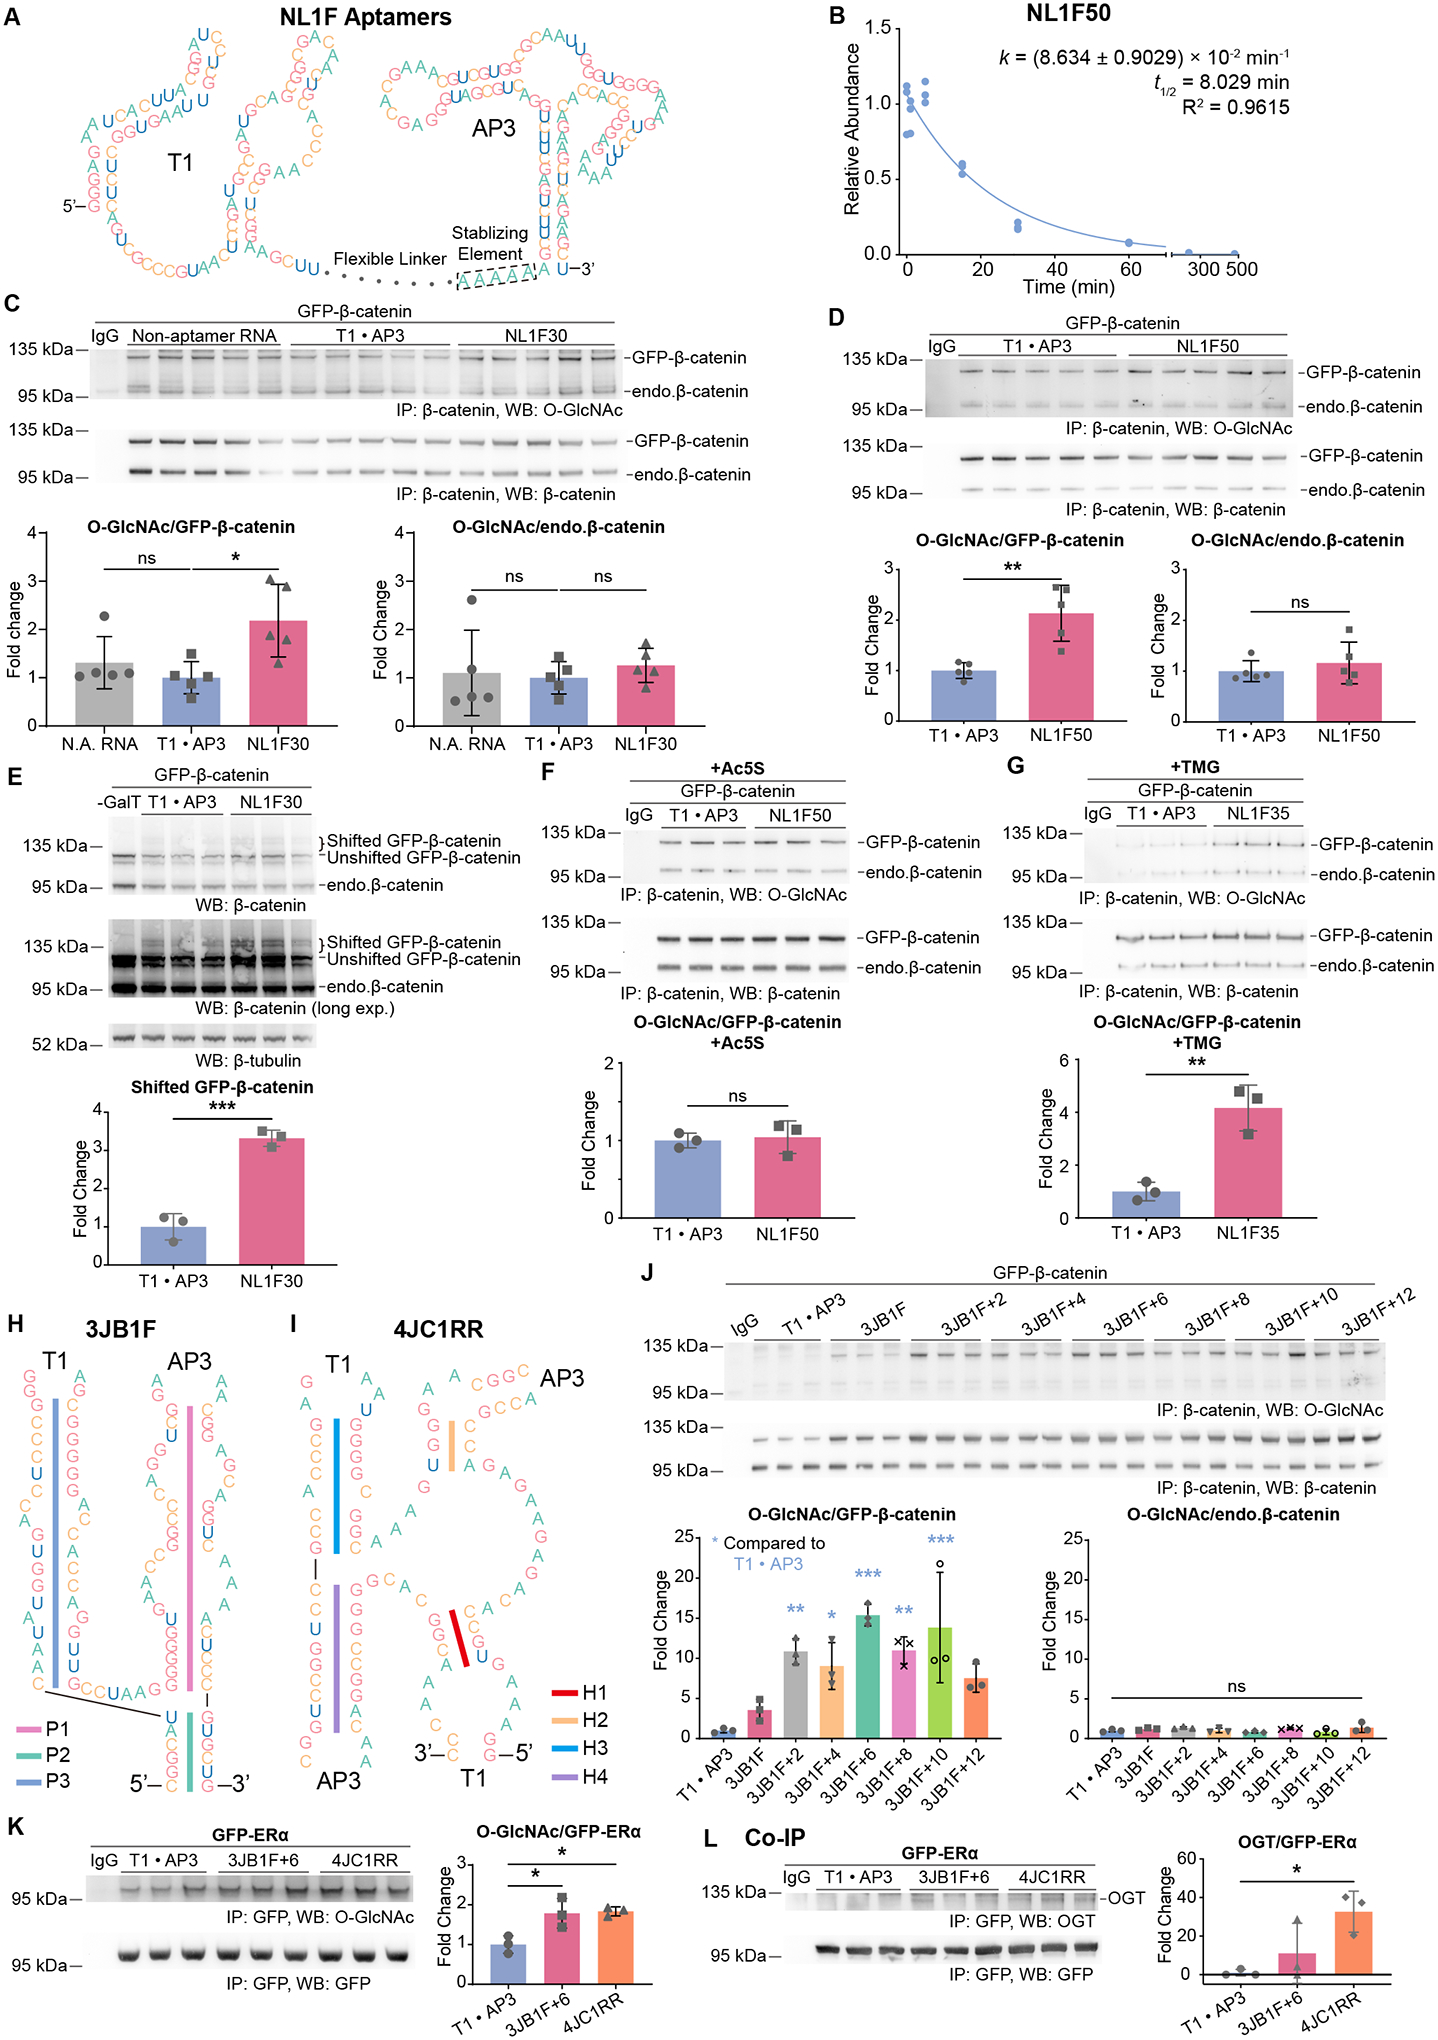
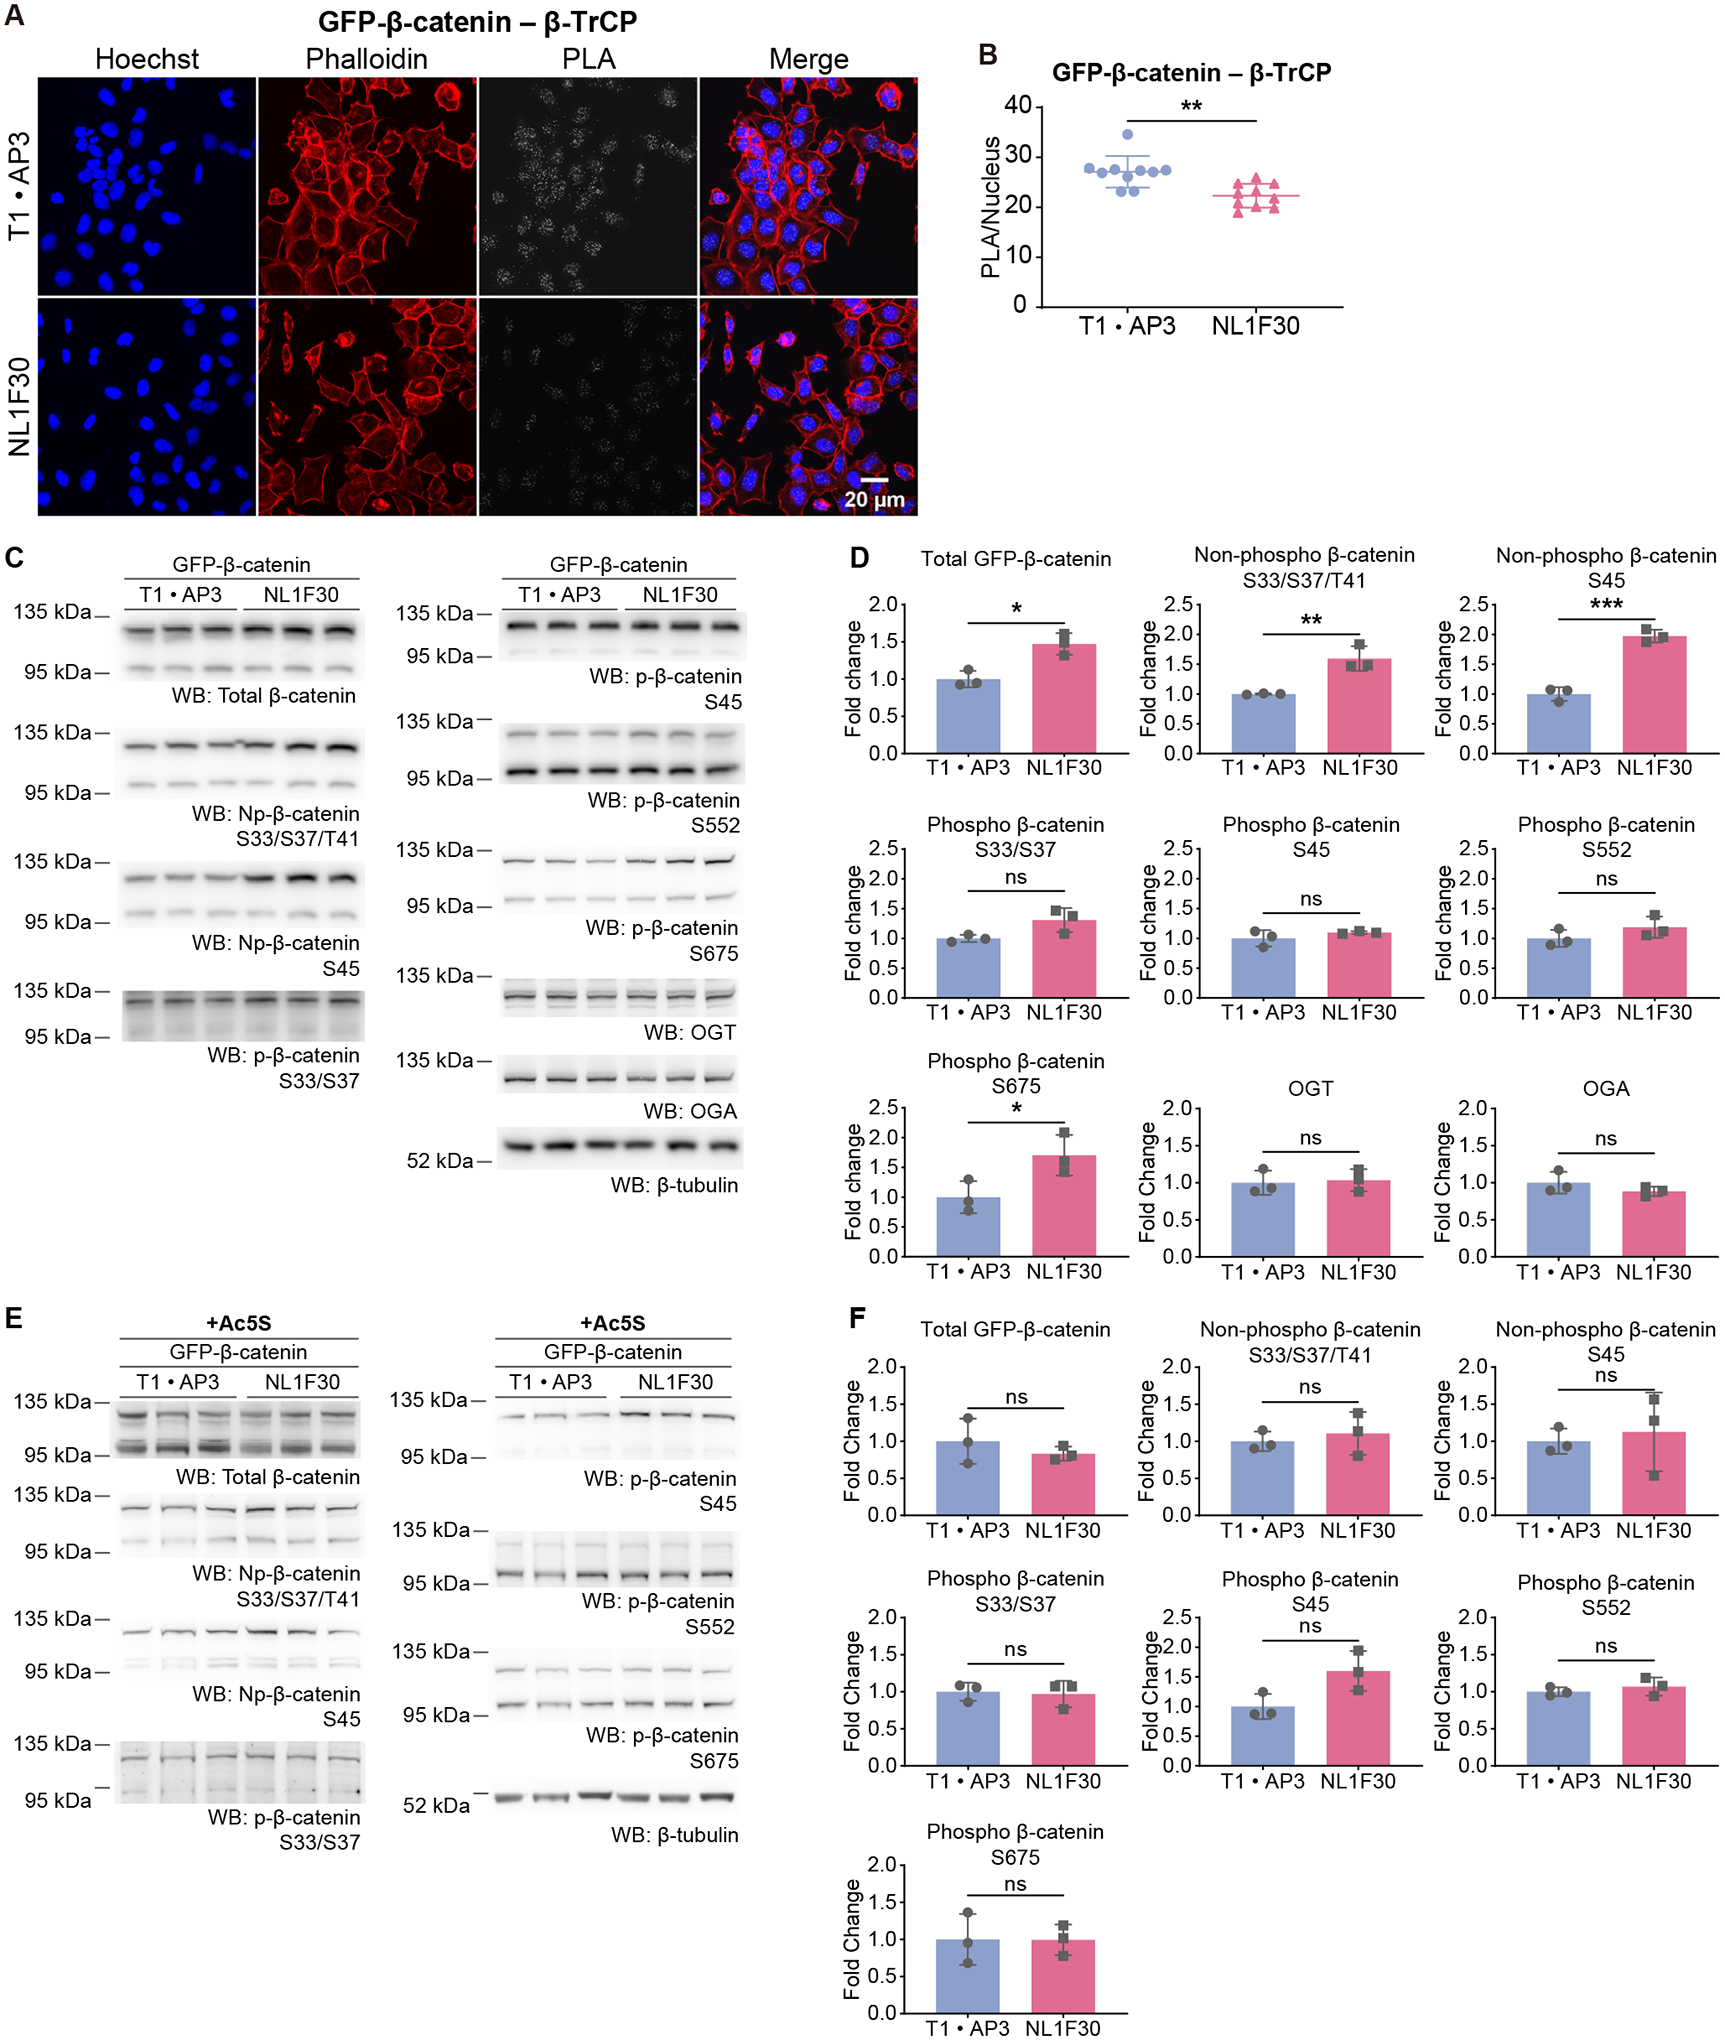
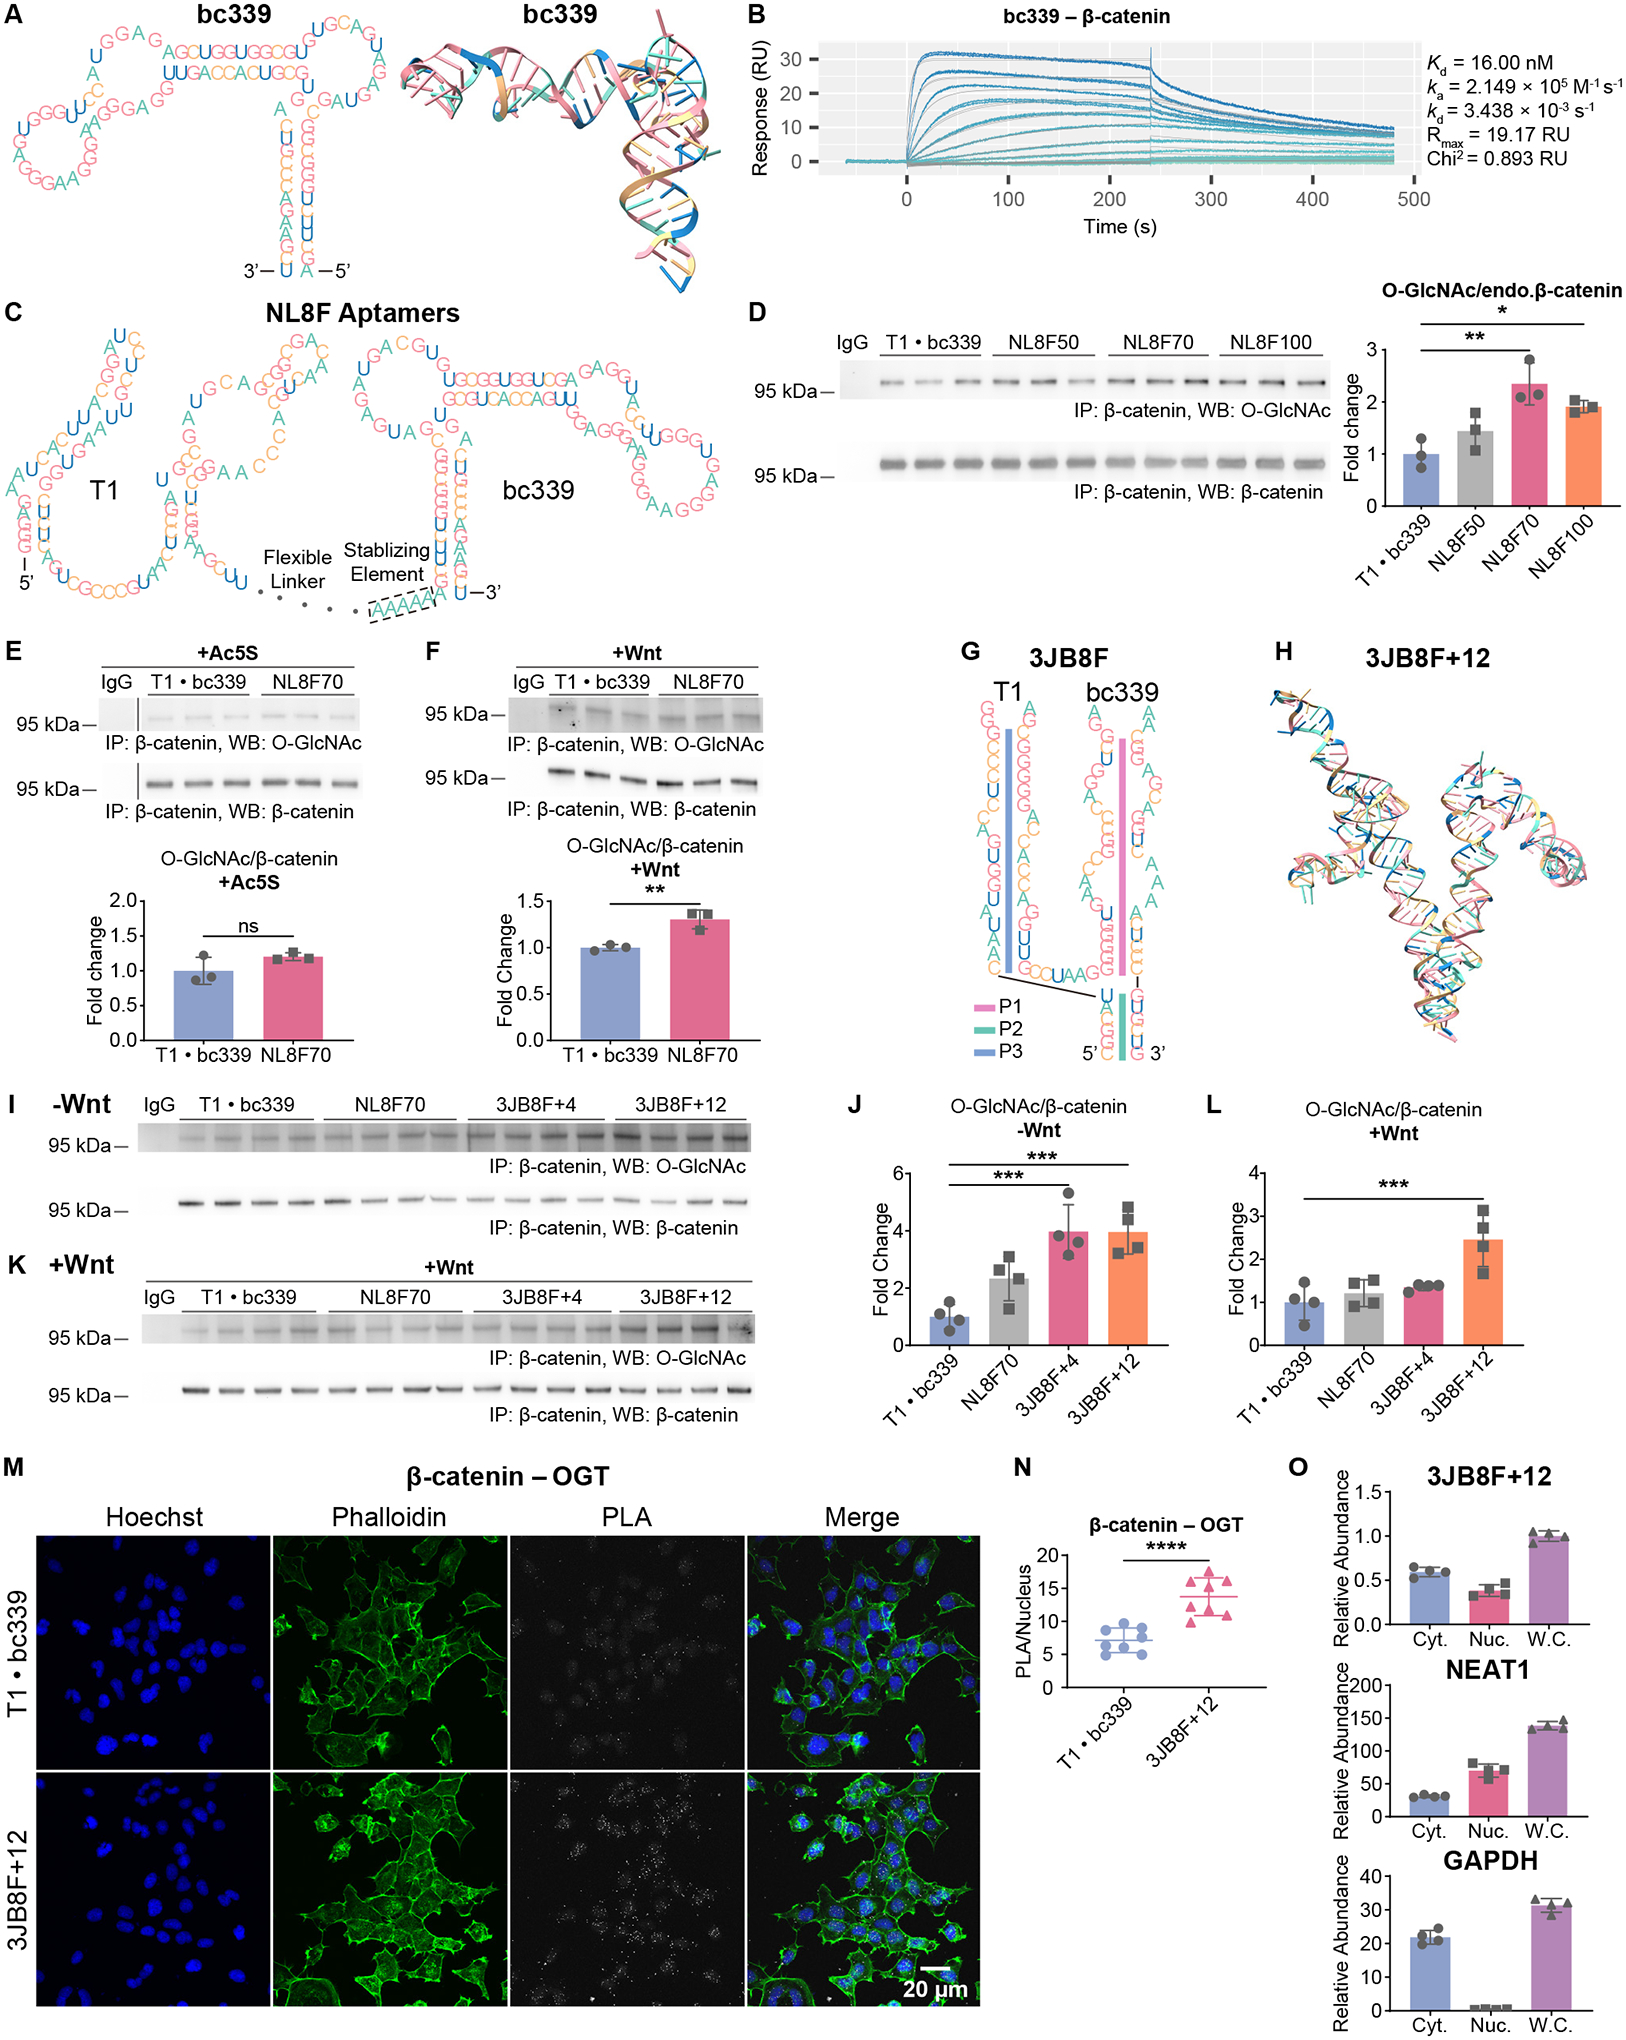
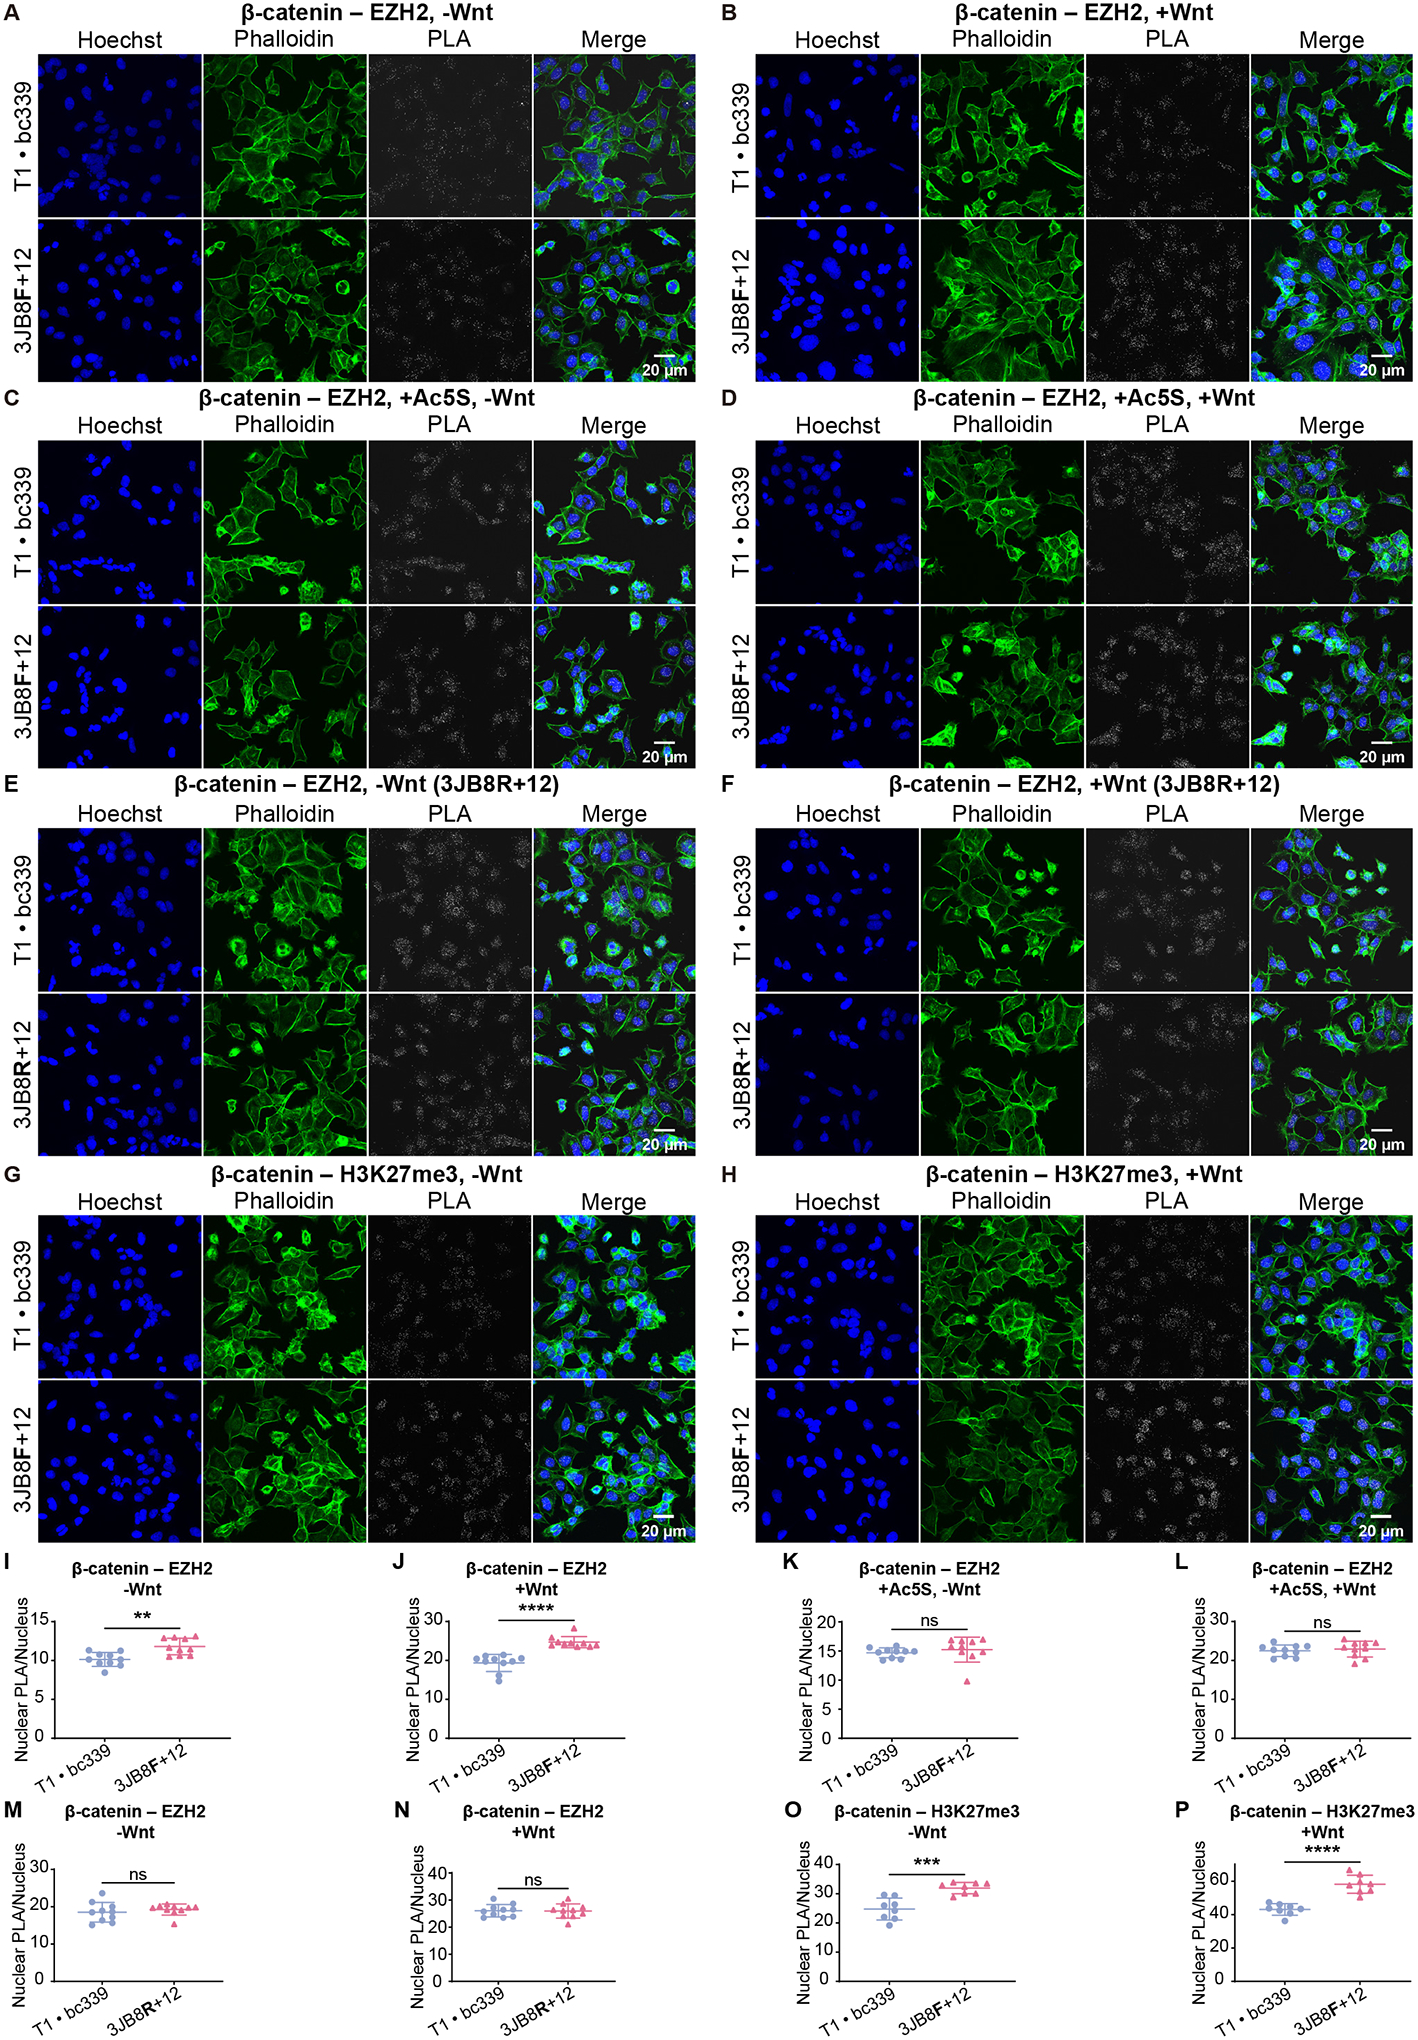
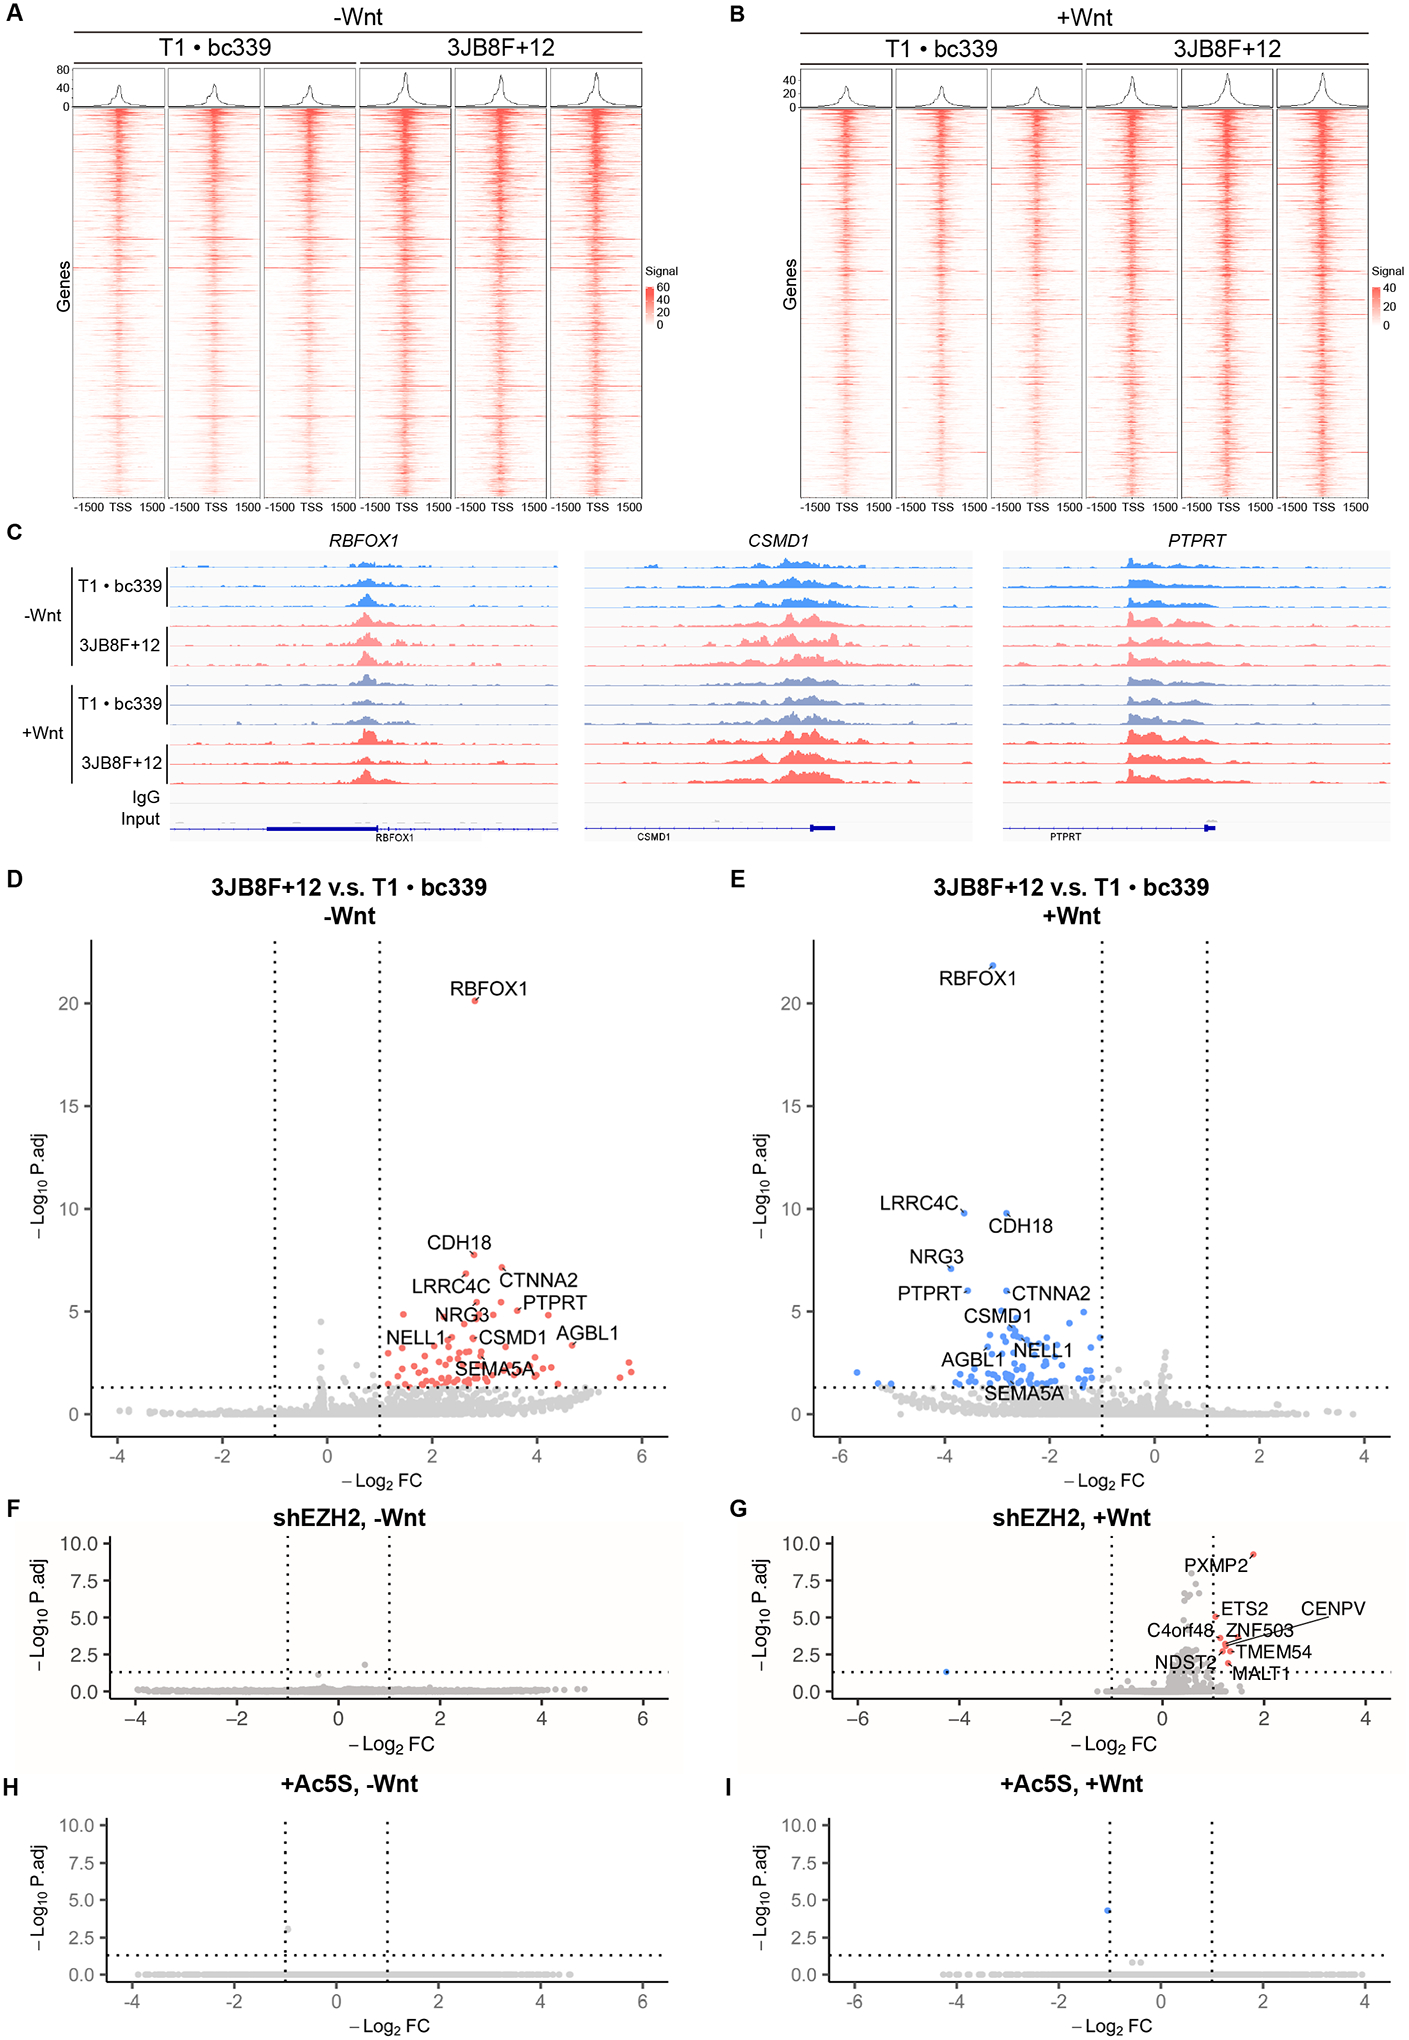
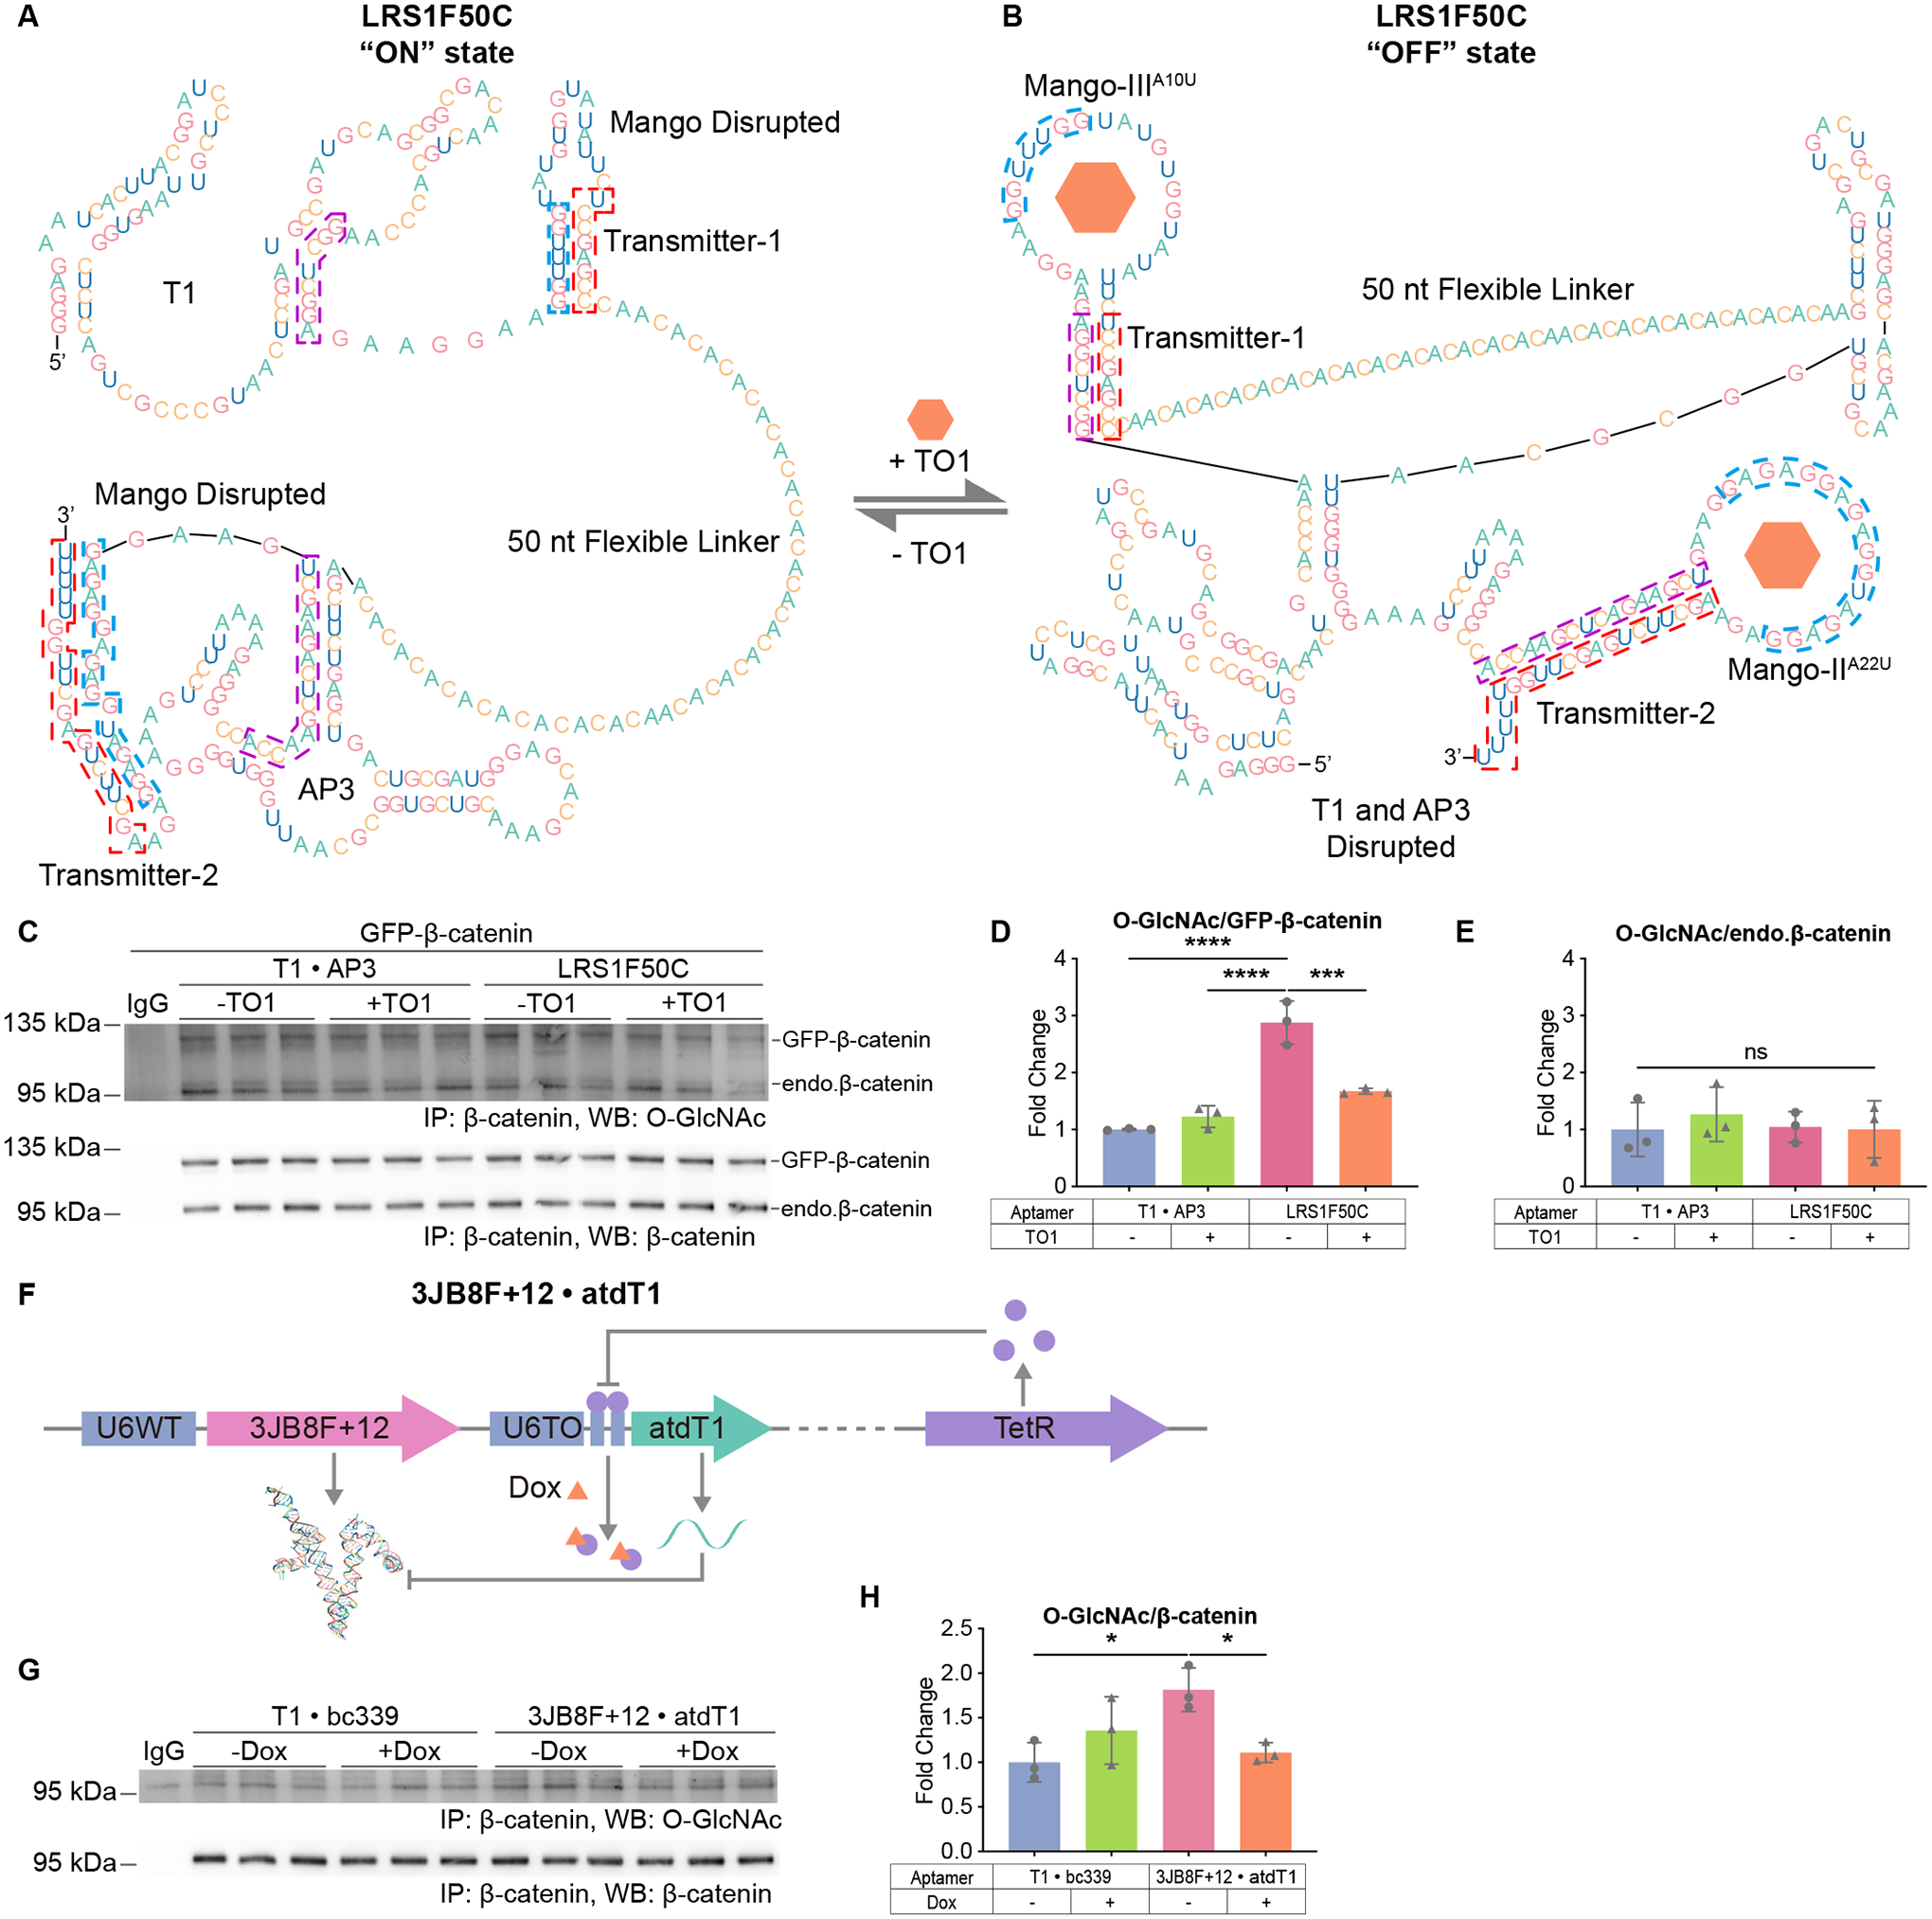
O-GlcNAc is a dynamic post-translational modification (PTM) that regulates protein functions. In studying the regulatory roles of O-GlcNAc, a major roadblock is the inability to change O-GlcNAcylation on a single protein at a time. Herein, we developed a dual RNA-aptamer-based approach that simultaneously targeted O-GlcNAc transferase (OGT) and β-catenin, the key transcription factor of the Wnt signaling pathway, to selectively increase O-GlcNAcylation of the latter without affecting other OGT substrates. Using the OGT/β-catenin dual-specificity aptamers, we found that O-GlcNAcylation of β-catenin stabilizes the protein by inhibiting its interaction with β-TrCP. O-GlcNAc also increases β-catenin's interaction with EZH2, recruits EZH2 to promoters, and dramatically alters the transcriptome. Further, by coupling riboswitches or an inducible expression system to aptamers, we enabled inducible regulation of protein-specific O-GlcNAcylation. Together, our findings demonstrate the efficacy and versatility of dual-specificity aptamers for regulating O-GlcNAcylation on individual proteins.

Keywords: EZH2; O-GlcNAc; O-GlcNAc transferase; RNA; Wnt signaling; aptamer; post-translational modification; riboswitch; transcriptome; β-catenin.


Conflict of interest statement

Declaration of interests A patent application based on this work has been filed. G.W.H. and Y.Z. are inventors of this patent.

Figures

Figure 1.
Figure 1.. A Noninhibiting RNA Aptamer Targeting ncOGT Was Generated From SELEX
(A) Schematic of SELEX. (B) and (C) Predicted secondary (B) and tertiary (C) structures of T1. Nucleotides in the two panels are color coded in the same way. (D) Radiolabeled Dot-Blot Assay measuring the binding affinity of T1 to full-length ncOGT. Data are fitted to a Michaelis-Menten model (curve). (E) and (F) Surface Plasmon Resonance (SPR) characterizing the binding affinity and kinetics of T1 to full-length ncOGT (E), and to the TPR domain (F). Sensorgrams represent OGT concentrations from 1 μM to 977 pM (E) or 1 μM to 488 pM (F), in 2× serial dilutions. Data are fitted to a 1:1 binding model. (G) UDP-Glo assay of OGT activity in the presence of T1. T1 was included in the indicated reactions (orange) from 2 μM to 7.8 nM in 2× serial dilution. Data are normalized to the positive control reaction (red). N=3. (H) RNA-IP and RT-qPCR quantification of OGT-bound T1 in cells. OGT was immunoprecipitated from T1-expressing cells, using buffers with Mg2+ (left panel) or without Mg2+ (right panel). Then OGT-bound T1 was quantified by RT-qPCR. Data are normalized to the IgG groups. RT – Reverse Transcriptase. N=3. (I). Western Blot (WB) analysis of global O-GlcNAcylation in HEK293T cells expressing T1 or AP3. N=3. (J) Pulse-chase experiments on the half-life of T1 in cells. Cells stably expressing T1 were treated with ActD for the indicated periods. Abundance of T1 was quantified by RT-qPCR (left panel) and normalized to that of 18S rRNA (right panel) and initial timepoint (T=0). Data are fitted to a one-phase decay model (curve). N=3. One-way ANOVA test in (G), (H). Data are represented as mean ± SD. ns, p ≥ 0.05; ****, p < 0.0001.
Figure 2.
Figure 2.. Dual-Specificity Aptamers Increase O-GlcNAcylation on GFP-Tagged Proteins
(A) Schematic of DS aptamers with flexible linkers (NL1F, T1-linker-AP3). Five adenine residues are inserted upstream of AP3 to stabilize the transcribed U6 terminator. (B) Pulse-chase experiments on the half-life of NL1F50 (T1–50nt-AP3). Experiments were performed and analyzed in the same way as in Figure 1J. N=3. (C) and (D) IP-WB on cells expressing GFP-β-catenin and the indicated aptamers. N.A. – Non-aptamer. endo. – endogenous. N=5. (E) Mass-shift assays on cells expressing GFP-β-catenin and the indicated aptamers. Two blots on β-catenin with short and long exposure time are shown. Intensities of the shifted bands are normalized to that of β-tubulin. N=3. (F) and (G) IP-WB on cells expressing GFP-β-catenin and the indicated aptamers and treated with 50 μM Ac5S for 20 hr (F) or 2 μM TMG for 6 hr (G). N=3. (H) and (I) Schematics of the DS aptamers with folded linkers. 3JB1F has a three-way RNA junction (H) and 4JC1RR has a four-way RNA junction (I) as linkers. (J) Optimization of the folded linker in 3JB1F. IP-WB on cells expressing GFP-β-catenin and the indicated aptamers. N=3. (K) and (L) IP-WB (K) or Co-IP (L) on HEK293T cells expressing GFP-ERα and the indicated aptamers. N=3. T1 · AP3 – Individual T1 and AP3 aptamers (control). NL1F30/50 – DS aptamers (T1-linker-AP3) with flexible linkers of 30/50 nt. 3JB1F/4JC1RR – DS aptamers (T1-linker-AP3) with folded linkers. +2/+4/…/+12, serial additions (bp) into the folded linker. Quantitated WB data are normalized to the control groups (T1 · AP3). Aptamers and proteins were expressed from plasmids. One-way ANOVA test in (C), (J), (K), (L). Student’s t-test in other panels. Data are represented as mean ± SD. ns, p ≥ 0.05; *, p < 0.05; **, p < 0.01; ***, p < 0.001. See also Figures S1 and S2.
Figure 3.
Figure 3.. O-GlcNAc Stabilizes GFP-β-catenin by Inhibiting Its Interaction With β-TrCP
(A) Confocal images of Proximity Ligation Assay (PLA) on cells expressing GFP-β-catenin and the indicated aptamers. PLA was performed with antibodies targeting GFP and β-TrCP. (B) Quantification of (A). PLA puncta are counted and normalized to the number of nuclei in each image. N=10. (C) to (F) WB on HEK293T cells expressing GFP-β-catenin and the indicated plasmids. In (E), cells were treated with 50 μM Ac5S for 20 hr. (D) and (F) Quantifications of (C) and (E). Intensity of each band is normalized to that of β-tubulin. Np – non-phosphorylated. p – phosphorylated. N=3. T1 · AP3 – Individual T1 and AP3 aptamers (control). NL1F30 – DS aptamers (T1-linker-AP3) with a flexible linker of 30 nt. Quantitated data are normalized to the control groups (T1 · AP3). Student’s t-test. Data are represented as mean ± SD. ns, p ≥ 0.05; *, p < 0.05; **, p < 0.01; ***, p < 0.001. See also Figure S3.
Figure 4.
Figure 4.. DS Aptamers Increase O-GlcNAcylation on Endogenous β-catenin
(A) Predicted secondary (left panel) and tertiary (right panel) structures of bc339. Nucleotides in the two panels are color coded in the same way. (B) SPR characterizating the binding affinity and kinetics of bc339. Sensorgrams represent β-catenin concentrations from 1 μM to 122 pM in 2× serial dilutions. Data are fitted to a 1:1 binding model. (C) Schematic of DS aptamers with flexible linkers (NL8F, T1-linker-bc339). Five adenine residues are inserted upstream of bc339 to stabilize the transcribed U6 terminator. (D) IP-WB on HEK293T cells expressing the indicated aptamers. N=3. (E) and (F) IP-WB on HEK293T cells expressing the indicated aptamers and treated with 50 μM Ac5S for 20 hr (E) or Wnt3A-conditioned medium for 4 hr (F). Irrelevant lanes are cropped. N=3. (G) Schematic of DS aptamers (3JB8F, T1-linker-bc339) with folded linkers. (H) Predicted tertiary structure of the DS aptamer 3JB8F+12. Nucleotides are color coded in the same way as in (G). Complete sequence and secondary structure prediction are shown in Figure S1C. (I) to (L) IP-WB on HEK293T cells expressing the indicated aptamers, under −Wnt (I, J) and +Wnt (K, L) conditions. (J) and (L) Quantification of (I) and (K). N=4. (M) and (N) Confocal images of PLA on HEK293T cells expressing the indicated aptamers. (N) Quantification of (M). Total PLA puncta is counted and normalized to the number of nuclei in each image. N=8. (O) Subcellular localization of 3JB8F+12. Nucleus and cytoplasm of cells stably expressing 3JB8F+12 was isolated, and RNA in each fraction was quantified by RT-qPCR. RNA abundances are normalized to that of 3JB8F+12 in whole cell lysate (purple bar in upper panel). NEAT1 is a nuclear RNA control. GAPDH is a cytoplasmic RNA control. Cyt. – Cytoplasm. Nuc. – Nucleus. W.C. – Whole Cell. N=4. T1 · bc339 – Individual T1 and bc339 aptamers (control). NL8F50/70/100 – DS aptamers (T1-linker-bc339) with flexible linkers of 50/70/100 nt. 3JB8F – DS aptamers (T1-linker-bc339) with folded linkers. +4/+12, serial additions (bp) into the folded linker. Quantitated data are normalized to the control groups (T1 · bc339). Aptamers were expressed from plasmids. Student’s t-test in (E), (F), (N). One-way ANOVA test in other panels. Data are represented as mean ± SD. ns, p ≥ 0.05; *, p < 0.05; **, p < 0.01; ***, p < 0.001; ****, p < 0.0001. See also Figure S1 and S4.
Figure 5.
Figure 5.. O-GlcNAc Promotes β-catenin’s Interactions With EZH2
(A) to (H) Confocal images of PLA on HEK293T cells expressing the control aptamers (T1 · bc339) or a DS aptamer (3JB8F+12 or 3JB8R+12), under −Wnt or +Wnt conditions. PLA was performed with antibodies targeting β-catenin and EZH2 or H3K27me3. In (C) and (D), cells were treated with 50 μM Ac5S for 20 hr. (I) to (P) Quantification of (A) to (H). PLA puncta in nucleus are counted and normalized to the number of nuclei in each image. Student’s t-test, N=10 (I to N) or 8 (O, P). Data are represented as mean ± SD. ns, p ≥ 0.05; **, p < 0.01; ***, p < 0.001; ****, p < 0.0001. T1 · bc339 – Individual T1 and bc339 aptamers (control). 3JB8F+12/R+12 – DS aptamers (T1-linker-bc339) with folded linkers. See also Figures S5 and S6.
Figure 6.
Figure 6.. O-GlcNAc on β-catenin Recruits EZH2 to Promoters and Shifts the Transcriptome
(A) and (B) Heatmap of the differential binding sites of EZH2. CUT&RUN sequencing was performed to HEK293T cells expressing the indicated aptamers and exposed to regular (−Wnt) or Wnt3A-conditioned (+Wnt) medium. (C) The binding peaks of EZH2 on three promoters under indicated conditions. (D) to (I) Volcano plot of RNA-seq data. HEK293T cells expressing the control (T1 · bc339) or DS (3JB8F+12) aptamers were treated with regular (−Wnt) or Wnt3A-conditioned (+Wnt) medium. In (F) and (G), EZH2 was knocked-down in cells with a shRNA. In (H) and (I), cells were treated with Ac5S. T1 · bc339 – Individual T1 and bc339 aptamers (control). 3JB8F+12 – DS aptamer (T1-linker-bc339) with a folded linker. See also Figure S7; Tables S4, S5.
Figure 7.
Figure 7.. Inducible Regulation of O-GlcNAcylation by Coupling DS Aptamers to Riboswitches or a Tet-On System
(A) and (B) Schematics of LRS1F50C and its conformation transitions. The transmitter elements are boxed in red, their alternative binding sequences are boxed in blue and purple. (A) The “ON” state of LRS1F50C. (B) The “OFF” state of LRS1F50C. (C) to (E) IP-WB on cells expressing GFP-β-catenin and the indicated aptamers, and treated with 750 μM TO1 (+TO1) or equal volume of DMF (−TO1). (D) and (E) Quantification of (C). N=3. (F) Schematic of controlling 3JB8F+12 with a Tet-On system. (G) and (H) IP-WB on cells transfected with the indicated plasmids, and treated with Dox (+Dox) or equal volume of DMSO (−Dox). (H) Quantification of (G). N=3. Two-way ANOVA test. Data are represented as mean ± SD. ns, p ≥ 0.05; *, p < 0.05; ***, p < 0.001; ****, p < 0.0001.

Comment in

References

    1. Torres CR, and Hart GW (1984). Topography and polypeptide distribution of terminal N-acetylglucosamine residues on the surfaces of intact lymphocytes. Evidence for O-linked GlcNAc. J Biol Chem 259, 3308–3317. - PubMed
    1. Hanover JA, Cohen CK, Willingham MC, and Park MK (1987). O-linked N-acetylglucosamine is attached to proteins of the nuclear pore. Evidence for cytoplasmic and nucleoplasmic glycoproteins. J Biol Chem 262, 9887–9894. - PubMed
    1. Wulff-Fuentes E, Berendt RR, Massman L, Danner L, Malard F, Vora J, Kahsay R, and Olivier-Van Stichelen S (2021). The human O-GlcNAcome database and meta-analysis. Sci Data 8, 25. 10.1038/s41597-021-00810-4. - DOI - PMC - PubMed
    1. Haltiwanger RS, Blomberg MA, and Hart GW (1992). Glycosylation of nuclear and cytoplasmic proteins. Purification and characterization of a uridine diphospho-N-acetylglucosamine:polypeptide beta-N-acetylglucosaminyltransferase. J Biol Chem 267, 9005–9013. - PubMed
    1. Dong DL, and Hart GW (1994). Purification and characterization of an O-GlcNAc selective N-acetyl-beta-D-glucosaminidase from rat spleen cytosol. Journal of Biological Chemistry 269, 19321–19330. 10.1016/s0021-9258(17)32170-1. - DOI - PubMed

Publication types

MeSH terms