. 2023 Jan 10;14(1):35.
doi: 10.1038/s41467-022-35343-w.

Machine learning models to accelerate the design of polymeric long-acting injectables

Affiliations

Machine learning models to accelerate the design of polymeric long-acting injectables

Pauric Bannigan et al. Nat Commun. .

Abstract

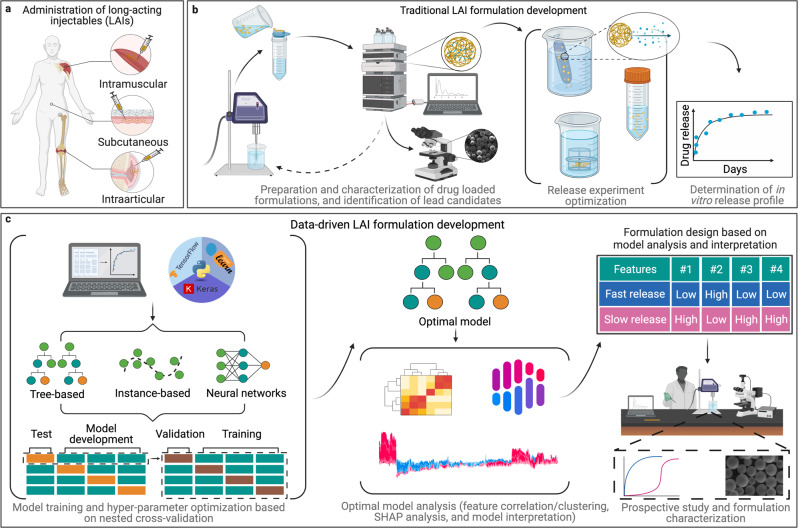
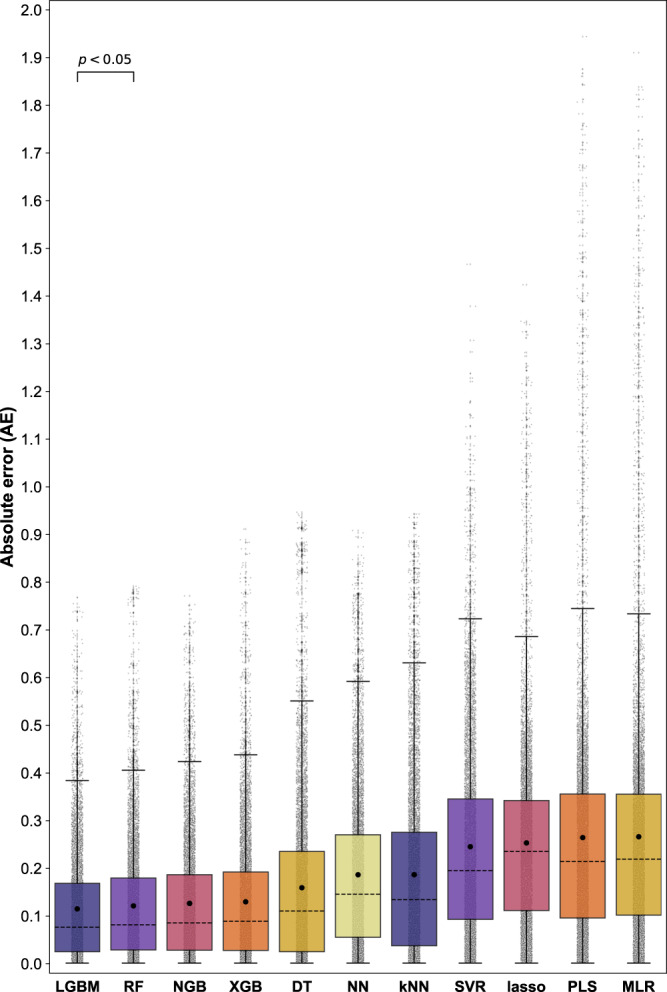
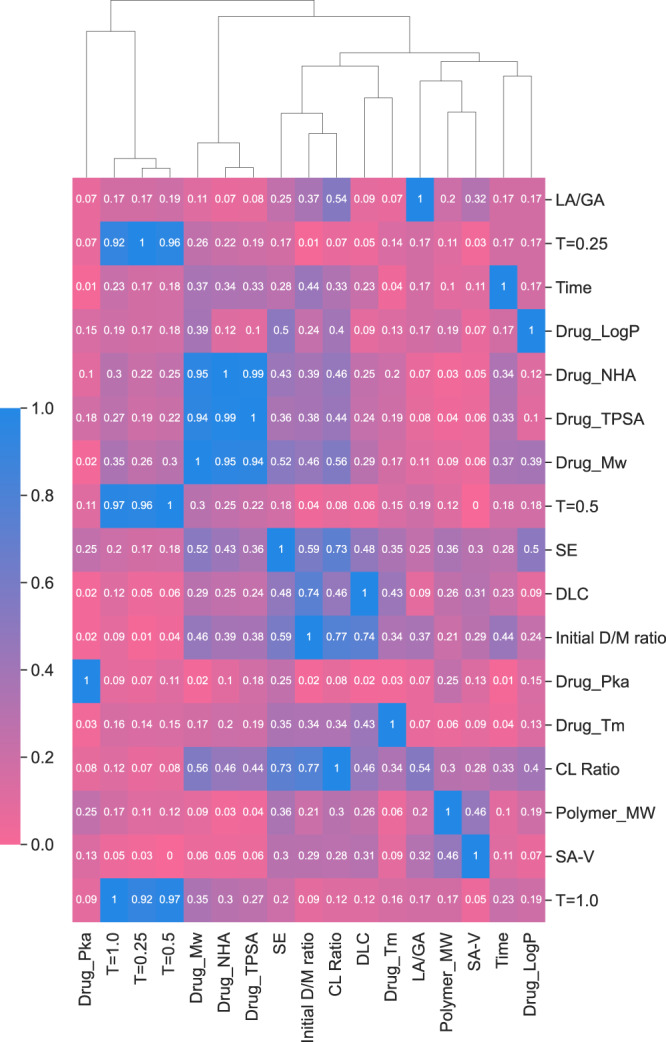
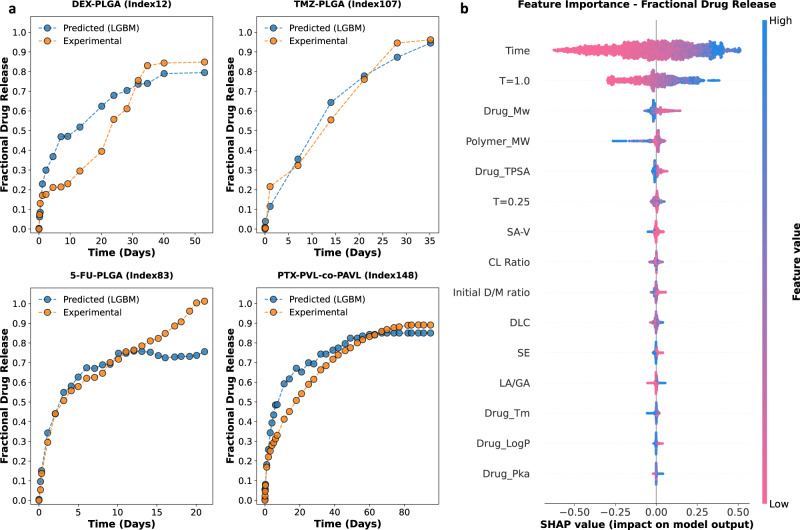
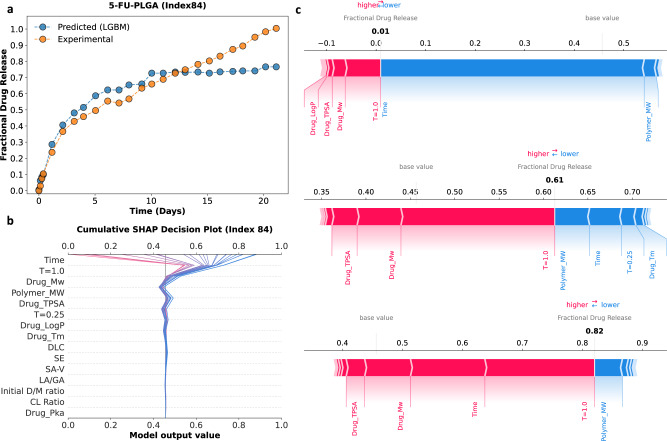
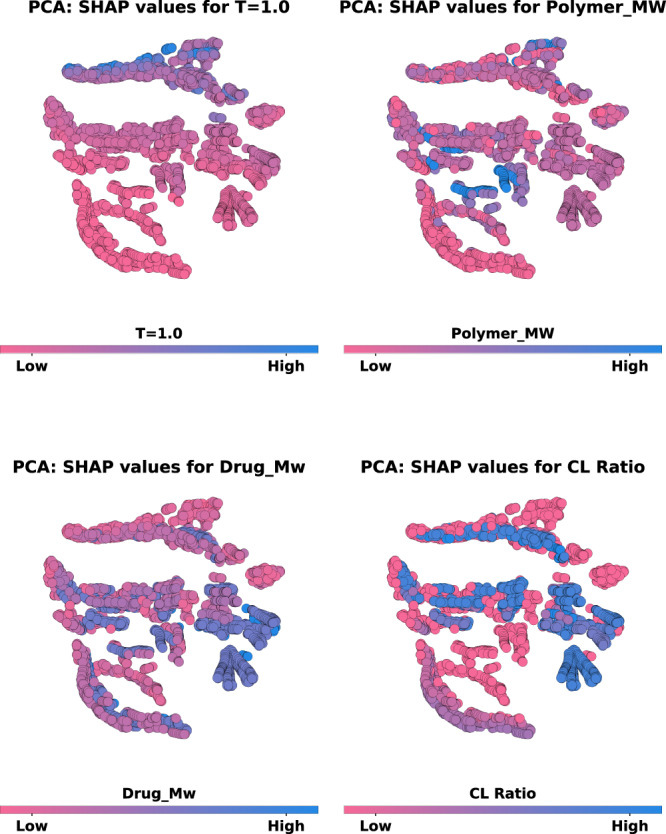
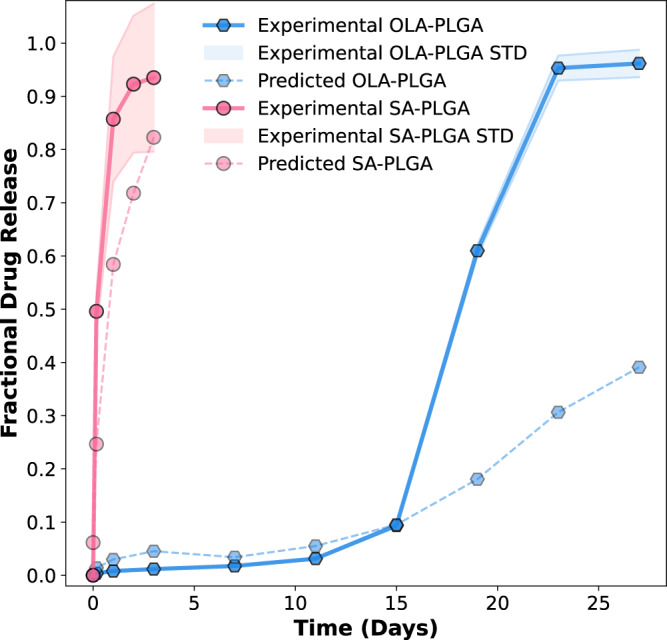
Long-acting injectables are considered one of the most promising therapeutic strategies for the treatment of chronic diseases as they can afford improved therapeutic efficacy, safety, and patient compliance. The use of polymer materials in such a drug formulation strategy can offer unparalleled diversity owing to the ability to synthesize materials with a wide range of properties. However, the interplay between multiple parameters, including the physicochemical properties of the drug and polymer, make it very difficult to intuitively predict the performance of these systems. This necessitates the development and characterization of a wide array of formulation candidates through extensive and time-consuming in vitro experimentation. Machine learning is enabling leap-step advances in a number of fields including drug discovery and materials science. The current study takes a critical step towards data-driven drug formulation development with an emphasis on long-acting injectables. Here we show that machine learning algorithms can be used to predict experimental drug release from these advanced drug delivery systems. We also demonstrate that these trained models can be used to guide the design of new long acting injectables. The implementation of the described data-driven approach has the potential to reduce the time and cost associated with drug formulation development.


Conflict of interest statement

The authors declare no competing interests.

Figures

Fig. 1
Fig. 1. Schematic demonstrating traditional and data-driven formulation development approaches for long-acting injectables (LAIs).
a Selected routes of administration for FDA-approved LAI formulations. b Typical trial-and-error loop commonly employed during the development of LAIs termed “traditional LAI formulation development”. c Workflow employed in this study to train and analyze machine learning (ML) models to accelerate the design of new LAI systems, termed “Data-driven LAI formulation development”.
Fig. 2
Fig. 2. Summary of the overall predictive performance of the various ML models represented as a box and whisker plot.
The data represent the absolute error (AE) obtained for fractional drug release predictions during nested cross-validation (i.e., n = 10 trials). Each column represents the AE value for 8013 data instances from the collective nested cross-validation test sets (light gray circles). The mean absolute error (MAE) and median AE values for each model are displayed within the boxes as closed black circles, and black dashed lines, respectively. The first and second quartiles are shown by the upper and lower edges of the respective boxes. The whiskers extend to show the rest of the distribution, excluding points determined to be “outliers” using the interquartile range method. Source data are provided as a Source Data file.
Fig. 3
Fig. 3. Heatmap of the absolute Spearman’s Rank correlation between the initial 17 input features.
Dark blue signifies an absolute Spearman’s Rank correlation = 1, and pink represents an absolute Spearman’s Rank correlation of 0. Attached to the heatmap is a dendrogram that displays the hierarchies of feature clusters that were determined via agglomerative hierarchical clustering analysis. Source data are provided as a Source Data file.
Fig. 4
Fig. 4. Deployment of the trained 15-feature lightGBM (LGBM) model.
a Select examples of experimental fractional drug release profiles (orange circles) in comparison to predicted fractional drug release profiles (blue circles) generated by the LGBM model. These include dexamethasone-loaded PLGA MPs (DEX-PLGA); temozolomide-loaded PLGA MPs (TMZ-PLGA); fluorouracil-loaded PLGA MPs (5-FU-PLGA); and paclitaxel-loaded PVL-co-PAVL cross-linked cylinders. b Shapley additive explanations (SHAP) analysis for the 15-feature LGBM model. The impact of each feature on fractional drug release is illustrated through a swarm plot of their corresponding SHAP values. The color of the dot represents the relative value of the feature in the dataset (high-to-low depicted as pink-to-blue). The horizontal location of the dots shows whether the effect of that feature value contributed positively or negatively in that prediction instance (x-axis). Source data are provided as a Source Data file.
Fig. 5
Fig. 5. A visual representation of how the 15-feature LGBM model generates fractional drug release predictions using the example of 5-FU-PLGA (index 84 in the attached dataset).
a Experimental fractional drug release profile (orange circles) for 5-FU-PLGA plotted against the predicted fractional drug release profile (blue circles) generated by the LGBM model. b Decision path taken for each fractional drug release prediction for the 5-FU-PLGA system. This plot illustrates how the LGBM model combines the relative contribution of each input feature to return the predicted fractional drug release value. c Shapley additive explanations (SHAP) force plots for the three selected data instances (i.e., fractional drug release prediction 0.01, 0.61, and 0.82) showing a decomposition of predicted fractional drug release values into the relative SHAP contribution values for each input feature. The relative SHAP values for each input feature are shown by pink (positive) or blue (negative) bands on the force plot, with the width of the band representing the numerical contribution to the final model output. Source data are provided as a Source Data file.
Fig. 6
Fig. 6. Dimensionality reduction combined with Shapley additive explanations (SHAP) analysis.
Two-dimensional visualization of the SHAP values calculated for the input features of the LGBM model. The SHAP values for the 15 input features were condensed into two principal components using principal component analysis (PCA) and then grouped together using a simple unsupervised clustering algorithm (T-distributed Stochastic Neighbor Embedding). This low-dimensional/clustered plot was then utilized to visualize and compare the location of data instances corresponding to different input features, including T= 1.0; CL_Ratio; Polymer_MW; and Drug_Mw. In each case, the attached colorbar depicts the relative value of that feature in the dataset ranked from high (blue) to low (pink). Source data are provided as a Source Data file.
Fig. 7
Fig. 7. Comparison of the experimental and predicted fractional drug release profiles for the salicylic acid-PLGA MP (SA-PLGA) and olaparib-PLGA MP (OLA-PLGA) formulations.
The design of both the SA-PLGA and OLA-PLGA was based on SHAP analysis of the trained LGBM model. Three independent batches of both formulations were prepared, and their experimental drug release was characterized in 0.5 wt% sodium dodecyl sulfate (SDS) to ensure sink conditions throughout the experiments. The fractional experimental drug release profiles for SA-PLGA and OLA-PLGA are plotted together as pink circles with a solid line (SA-PLGA) and blue hexagons with a solid line (OLA-PLGA), respectively. In both cases, the standard deviation (STD) observed for these experimental drug release measurements is displayed as a colored halo (n = 3). The fractional drug release profiles predicted by the LGBM model are also shown as pale pink circles with a broken line (SA-PLGA) and pale blue hexagons with a broken line (OLA-PLGA), respectively. Source data are provided as a Source Data file.

References

    1. Brigham NC, Ji R-R, Becker ML. Degradable polymeric vehicles for postoperative pain management. Nat. Commun. 2021;12:1367. doi: 10.1038/s41467-021-21438-3. - DOI - PMC - PubMed
    1. Ghitman J, Biru EI, Stan R, Iovu H. Review of hybrid PLGA nanoparticles: future of smart drug delivery and theranostics medicine. Mater. Des. 2020;193:108805. doi: 10.1016/j.matdes.2020.108805. - DOI
    1. O’Brien MN, Jiang W, Wang Y, Loffredo DM. Challenges and opportunities in the development of complex generic long-acting injectable drug products. J. Controlled Release. 2021;336:144–158. doi: 10.1016/j.jconrel.2021.06.017. - DOI - PubMed
    1. Siepmann, J. & Siepmann, F. Microparticles used as drug delivery systems. in Smart Colloidal Materials (ed Richtering, W.) vol. 133 15–21 (Springer, Berlin, Heidelberg, 2006).
    1. Agnihotri SM, Vavia PR. Pharmacokinetics of intramuscular microparticle depot of valdecoxib in an experimental model. Drug Dev. Ind. Pharm. 2009;35:1043–1047. doi: 10.1080/03639040902762979. - DOI - PubMed

Publication types