. 2023 Jan 10;23(1):9.
doi: 10.1186/s12880-022-00957-5.

18F-FDG gallbladder uptake: observation from a total-body PET/CT scanner

Affiliations

18F-FDG gallbladder uptake: observation from a total-body PET/CT scanner

Anna Calabro' et al. BMC Med Imaging. .

Abstract

Background: Total-body positron emission tomography/computed tomography (PET/CT) scanners are characterized by higher signal collection efficiency and greater spatial resolution compared to conventional scanners, allowing for delayed imaging and improved image quality. These advantages may also lead to better detection of physiological processes that diagnostic imaging professionals should be aware of. The gallbladder (GB) is not usually visualized as an 18F-2-fluorodeoxyglucose (18F-FDG)-avid structure in routine clinical PET/CT studies; however, with the total-body PET/CT, we have been increasingly visualizing GB activity without it being involved in an inflammatory or neoplastic process. The aim of this study was to report visualization rates and characteristics of GB 18F-FDG uptake observed in both healthy and oncological subjects scanned on a total-body PET/CT system.

Materials and methods: Scans from 73 participants (48 healthy and 25 with newly diagnosed lymphoma) who underwent 18F-FDG total-body PET/CT were retrospectively reviewed. Subjects were scanned at multiple timepoints up to 3 h post-injection. Gallbladder 18F-FDG activity was graded using liver uptake as a reference, and the pattern was qualified as present in the wall, lumen, or both. Participants' characteristics, such as age, sex, body-mass index, blood glucose, and other clinical parameters, were collected to assess for any significant correlation with GB 18F-FDG uptake.

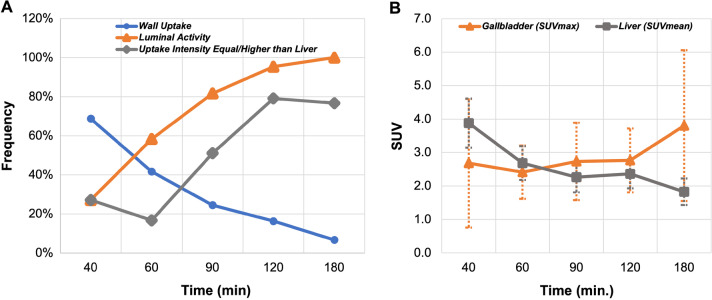
Results: All 73 subjects showed GB uptake at one or more imaging timepoints. An increase in uptake intensity overtime was observed up until the 180-min scan, and the visualization rate of GB 18F-FDG uptake was 100% in the 120- and 180-min post-injection scans. GB wall uptake was detected in a significant number of patients (44/73, 60%), especially at early timepoint scans, whereas luminal activity was detected in 71/73 (97%) subjects, especially at later timepoint scans. No significant correlation was found between GB uptake intensity/pattern and subjects' characteristics.

Conclusion: The consistent observation of GB 18F-FDG uptake recorded in this study in healthy participants and subjects with a new oncological diagnosis indicates that this is a normal physiologic finding rather than representing an exception.

Keywords: Fluorodeoxyglucose F18; Gallbladder; Positron emission tomography computed tomography; Sodium-glucose transporter 1; Total-body PET/CT.


Conflict of interest statement

UC Davis has a revenue-sharing agreement with United Imaging Healthcare. RDB, SRC, and LN and are investigators on a research grant funded by United Imaging Healthcare. No other potential conflicts of interest relevant to this article exist. LN is site Principal Investigator of clinical trials supported by Novartis Pharmaceuticals Corporation. LN is site Principal Investigator of a clinical trial supported by Telix Pharmaceuticals. LN is site Principal Investigator a clinical trial supported by Lantheus Medical Imaging. LN is site Principal Investigator of a clinical trials supported by General Electric Healthcare.

Figures

Fig. 1
Fig. 1
18F-FDG uptake patterns in the gallbladder wall and lumen. PET and fused PET/CT images after i.v. injection of 379 MBq in a 30 y/o healthy participant. AC 40 min post injection scan shows gallbladder wall activity, equal to the liver; DF 180 min post injection scan shows gallbladder luminal activity, higher than the liver
Fig. 2
Fig. 2
Qualitative and quantitative changes in gallbladder uptake over time. Frequency of gallbladder visualization (wall & lumen) and changes in the uptake intensity in respect to the liver background activity (A), and gallbladder & liver standardized uptake values (B) in relation to the scanning timepoints in 73 study participants. Error bars represent the standard deviation. Please note that the same subject was not scanned across all the given timepoints. Details of the study subgroups and scanning protocols are summarized in Table 1. Also, please note that the small category where both wall and lumen were visualized was added to their respective category in this graph. Details about the exact numbers are given in Table 3
Fig. 3
Fig. 3
Changes in the gallbladder 18F-FDG uptake pattern and intensity on serial total-body PET/CT acquisitions. Axial PET, CT and fused images acquired after i.v. injection of 389 MBq in a 53 y/o healthy participant. Images at 40-min timepoint show wall activity, equal to the liver background; images at 90-min timepoint show luminal uptake, equal to the liver uptake; and images acquired at 180-min post-injection show increased luminal uptake, higher than that of the liver background. Arrows: gallbladder; Asterisks: gallbladder lumen; A PET, CT and fused PET/CT images at 40-min timepoint; B PET, CT and fused PET/CT images at 90-min timepoint; C PET, CT and fused PET/CT images at 180-min timepoint
Fig. 4
Fig. 4
Uneven 18F-FDG uptake in the gallbladder. PET, CT and fused PET/CT images of a 61 y/o healthy female participant, scanned at 90-min post-injection of 334 MBq of 18F-FDG. Images show distribution of 18F-FDG uptake in the gallbladder: one portion shows uptake with lower attenuation on the corresponding CT, while the other portion shows no uptake and higher attenuation on the corresponding CT. These findings suggest the presence of different luminal content. Arrowhead: gallbladder portion showing tracer uptake with lower attenuation on the corresponding CT; arrows: gallbladder portion showing no uptake and higher attenuation on the corresponding CT. A axial, B coronal, planes of PET, CT and fused PET/CT images

References

    1. Kostakoglu L, Hardoff R, Mirtcheva R, Goldsmith SJ. PET-CT fusion imaging in differentiating physiologic from pathologic FDG uptake. Radiographics. 2004;24(5):1411–1431. doi: 10.1148/rg.245035725. - DOI - PubMed
    1. Oe A, Kawabe J, Torii K, Kawamura E, Higashiyama S, Kotani J, Hayashi T, Kurooka H, Tsumoto C, Kubo S, et al. Distinguishing benign from malignant gallbladder wall thickening using FDG-PET. Ann Nucl Med. 2006;20(10):699–703. doi: 10.1007/BF02984683. - DOI - PubMed
    1. Bai X, Wang X, Zhuang H. FDG accumulation in the lumen of the gallbladder without related pathology. Clin Nucl Med. 2018;43(5):383–385. doi: 10.1097/RLU.0000000000002044. - DOI - PubMed
    1. Hussain RP, Nausheen S, Ahmed N, Mahmood T. Benign uptake of (18)F-fluorodeoxyglucose in the gallbladder on positron emission tomography-computed tomography. World J Nucl Med. 2020;19(3):288–290. doi: 10.4103/wjnm.WJNM_82_19. - DOI - PMC - PubMed
    1. Asmar K, El Amine MA, Bejjani A, Makki M, Tamim H, Abi-Ghanem AS. Factors influencing incidental (18)F-FDG uptake in the gallbladder in a large cohort of patients: a retrospective study. Clin Imaging. 2020;61:43–48. doi: 10.1016/j.clinimag.2020.01.003. - DOI - PubMed

Publication types

MeSH terms

Substances