. 2023 Jan 10;18(1):27.
doi: 10.1186/s13018-022-03381-1.

IRF8 and its related molecules as potential diagnostic biomarkers or therapeutic candidates and immune cell infiltration characteristics in steroid-induced osteonecrosis of the femoral head

Affiliations

IRF8 and its related molecules as potential diagnostic biomarkers or therapeutic candidates and immune cell infiltration characteristics in steroid-induced osteonecrosis of the femoral head

Xue-Zhen Liang et al. J Orthop Surg Res. .

Abstract

Purpose: Steroid-induced osteonecrosis of the femoral head (SONFH) was a refractory orthopedic hip joint disease in the young and middle-aged people, but the pathogenesis of SONFH remained unclear. We aimed to identify the potential genes and screen potential therapeutic compounds for SONFH.

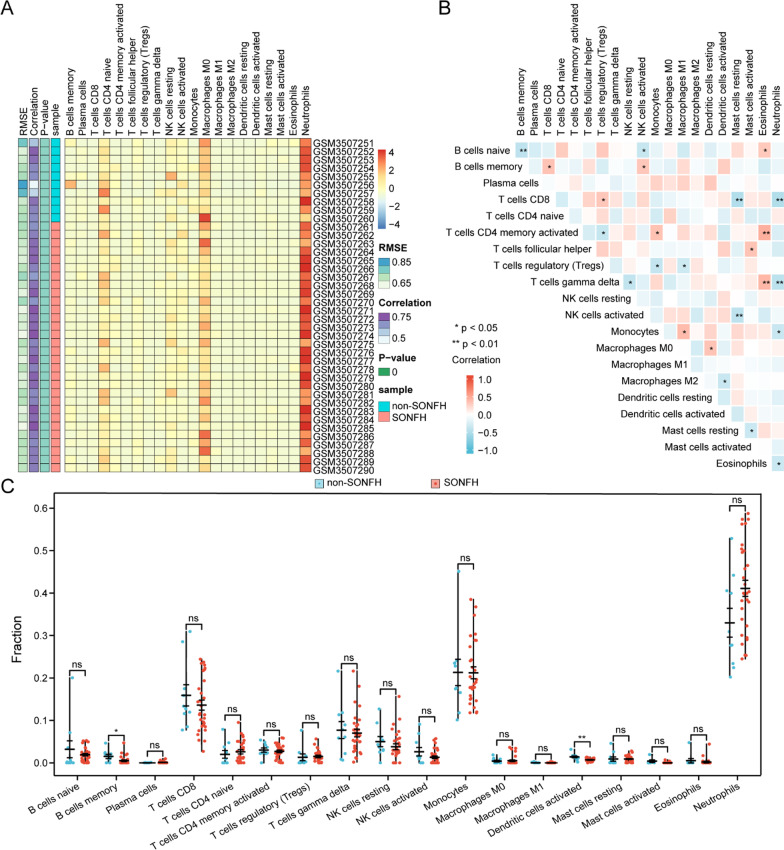
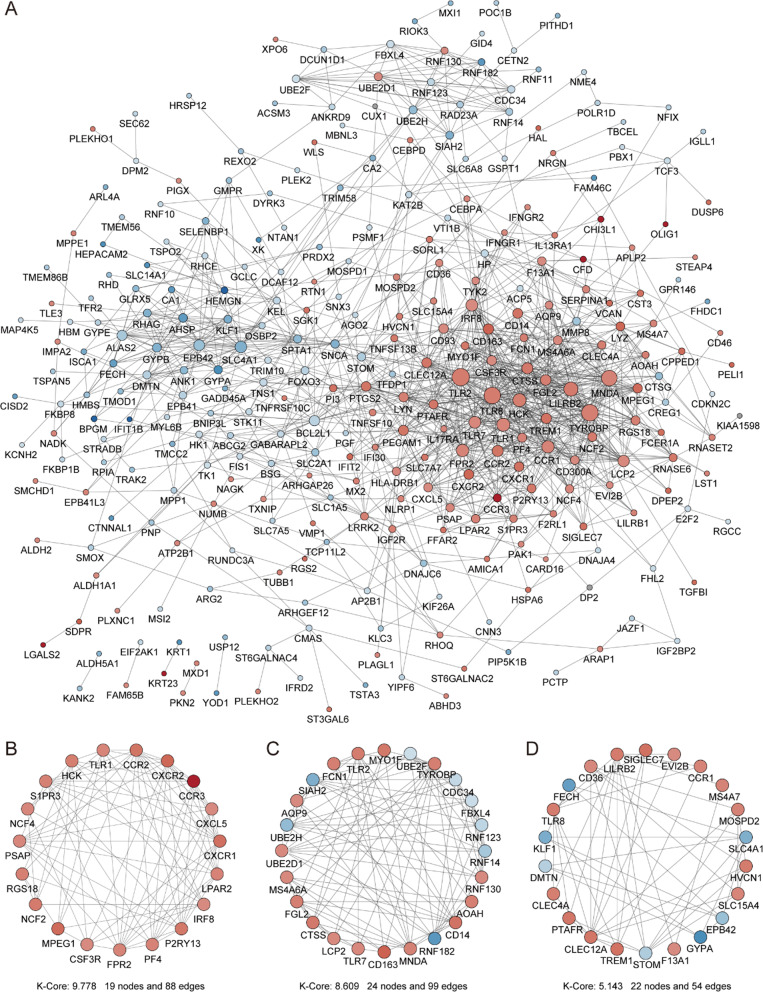
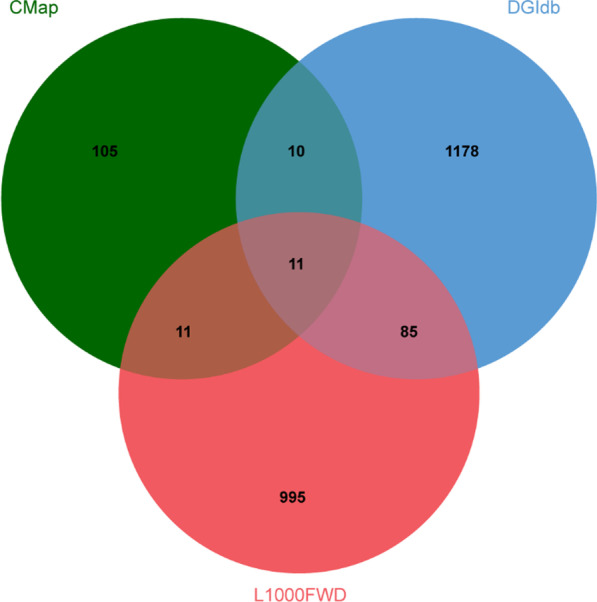
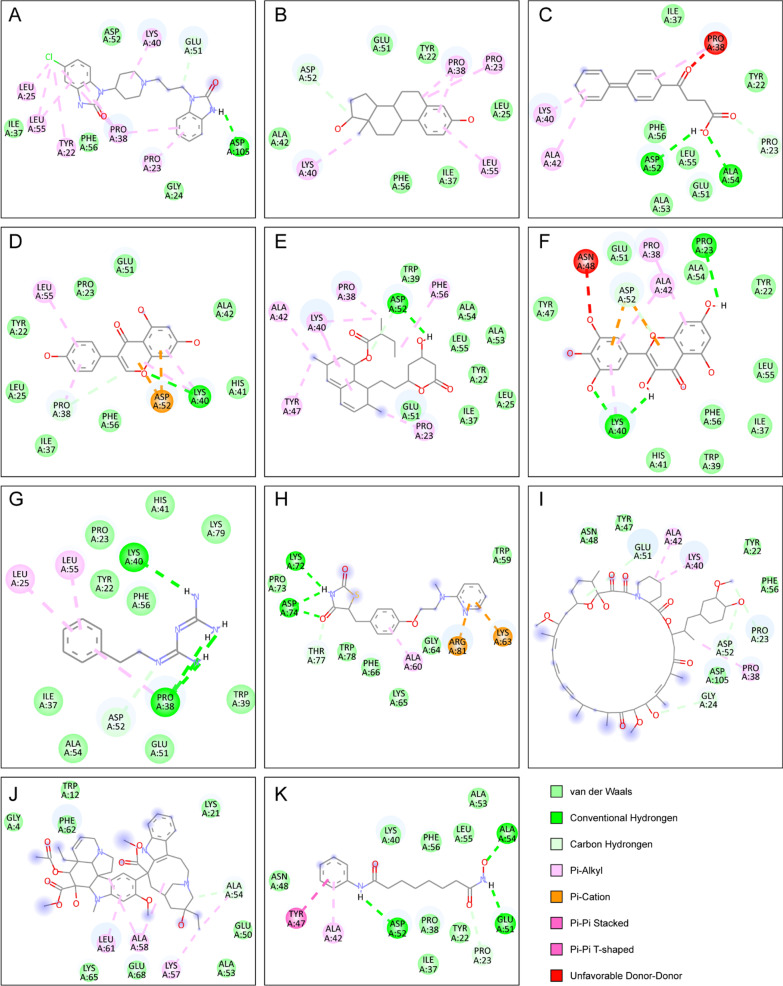
Methods: The microarray was obtained for blood tissue from the GEO database, and then it identifies differentially expressed genes (DEGs). The DEGs were analyzed to obtain the differences in immune cell infiltration. The gene functional enrichment analysis of SONFH was analyzed. The PPI of DEGs was identified through the STRING database, and the cluster modules and hub genes were ascertained using MCODE and CytoHubba, and the ROC curve of hub genes was analyzed, and the tissues distribution of hub genes was understood by the HPA, Bgee and BioGPS databases. The hub genes and target miRNAs and corresponding upstream lncRNAs were predicted by TargetScan, miRDB and ENCORI database. Subsequently, we used CMap, DGIdb and L1000FWD databases to identify several potential therapeutic molecular compounds for SONFH. Finally, the AutoDockTools Vina, PyMOL and Discovery Studio were employed for molecular docking analyses between compounds and hub genes.

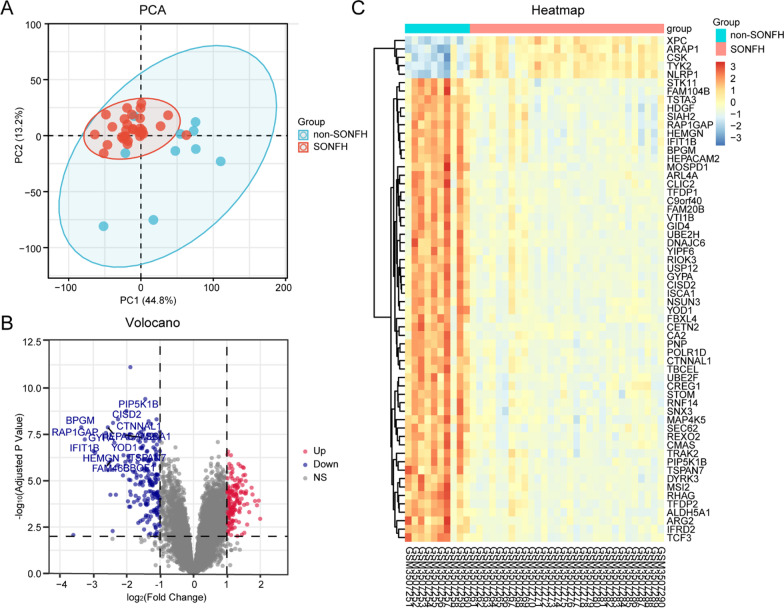
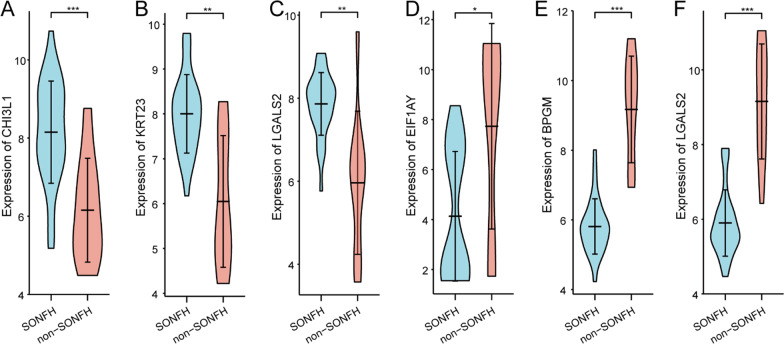
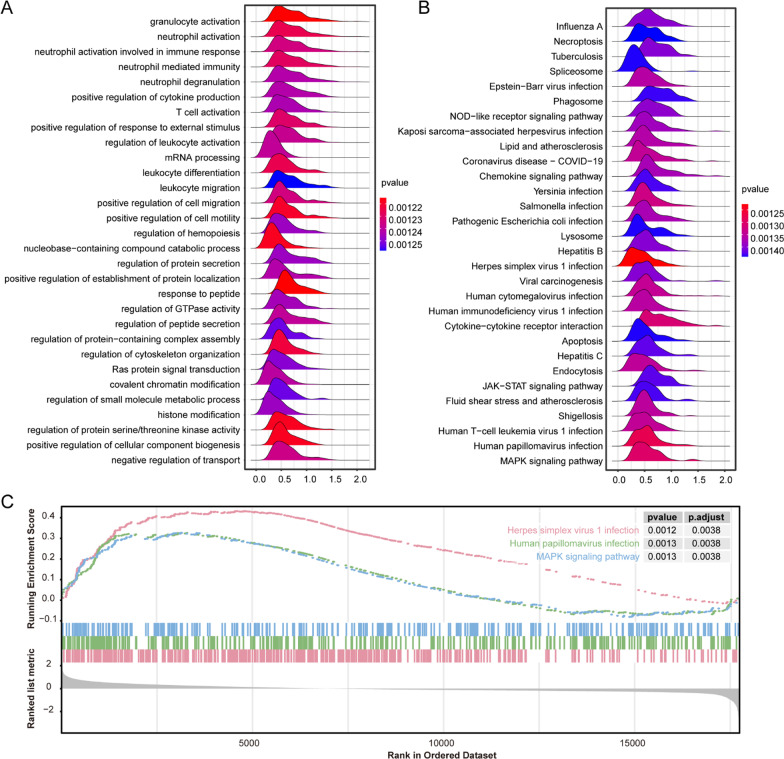
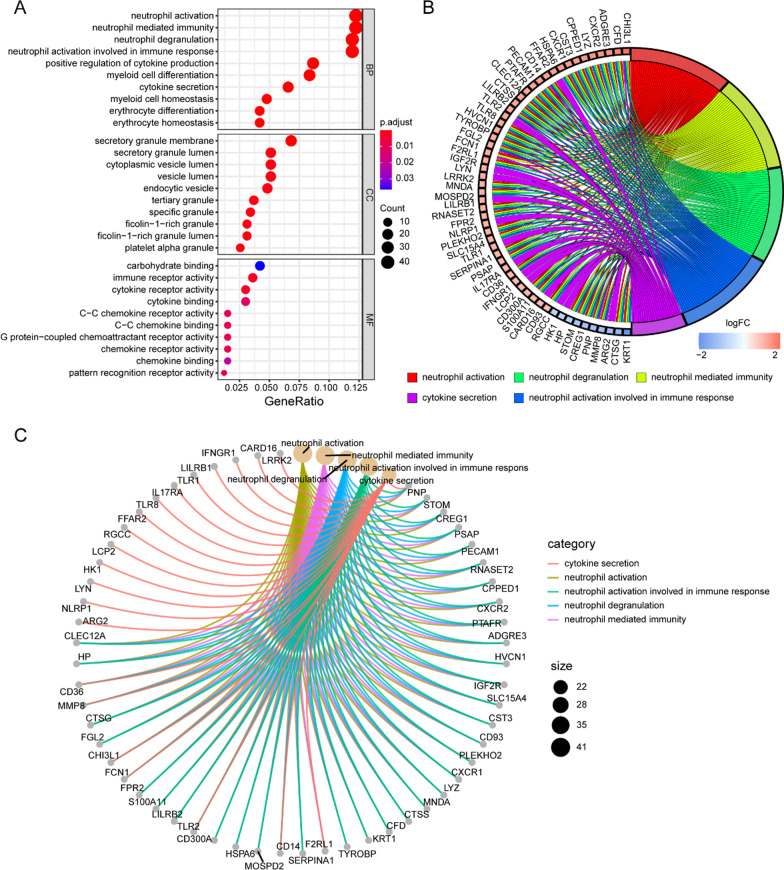
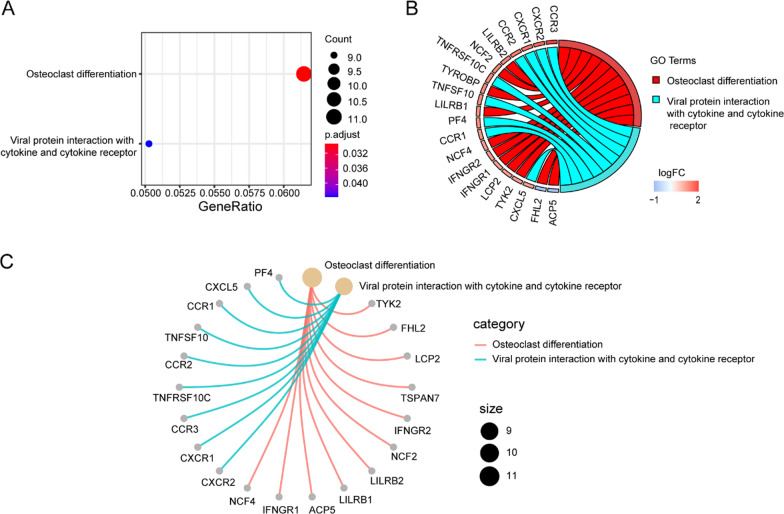
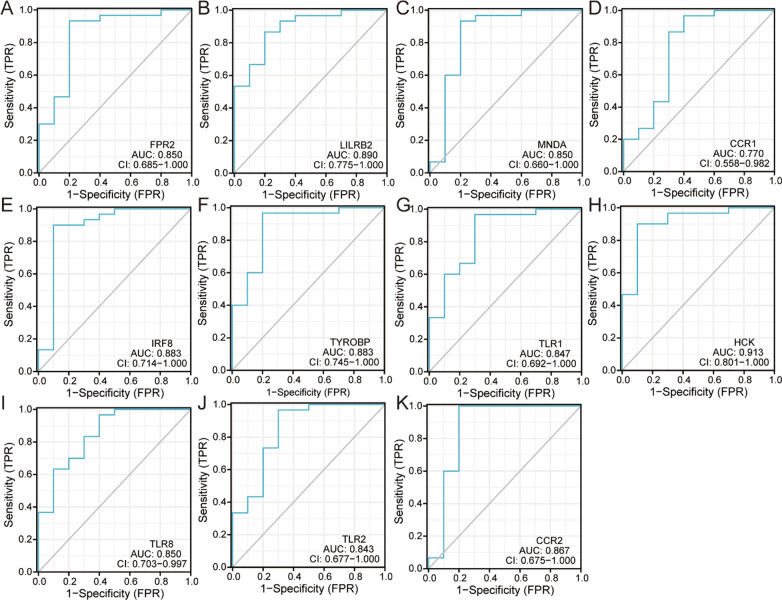
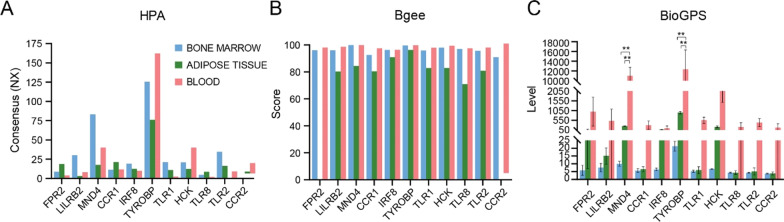
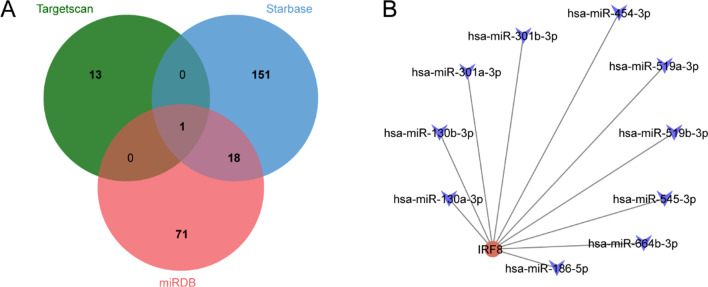
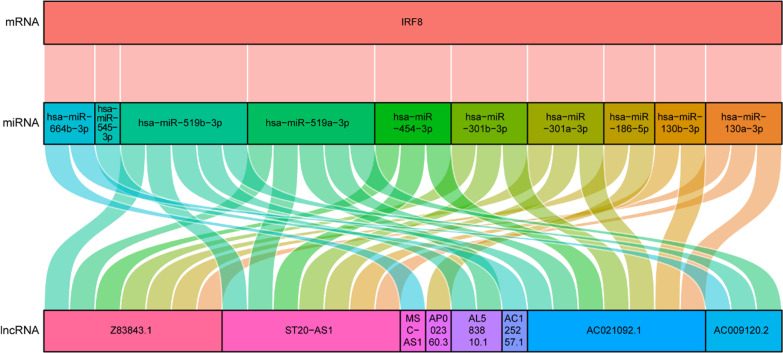
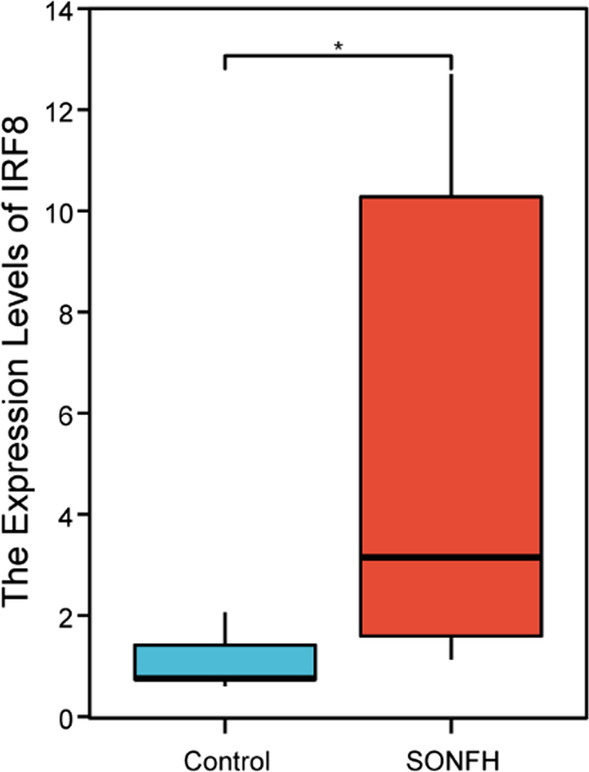
Results: The microarray dataset GSE123568 was obtained related to SONFH. There were 372 DEGs including 197 upregulated genes and 175 downregulated genes by adjusted P value < 0.01 and |log2FC|> 1. Several significant GSEA enrichment analysis and biological processes and KEGG pathway associated with SONFH were identified, which were significantly related to cytoskeleton organization, nucleobase-containing compound catabolic process, NOD-like receptor signaling pathway, MAPK signaling pathway, FoxO signaling pathway, neutrophil-mediated immunity, neutrophil degranulation and neutrophil activation involved in immune response. Activated T cells CD4 memory, B cells naïve, B cells memory, T cells CD8 and T cells gamma delta might be involved in the occurrence and development of SONFH. Three cluster modules were identified in the PPI network, and eleven hub genes including FPR2, LILRB2, MNDA, CCR1, IRF8, TYROBP, TLR1, HCK, TLR8, TLR2 and CCR2 were identified by Cytohubba, which were differed in bone marrow, adipose tissue and blood, and which had good diagnostic performance in SONFH. We identified IRF8 and 10 target miRNAs that was utilized including Targetsan, miRDB and ENCORI databases and 8 corresponding upstream lncRNAs that was revealed by ENCORI database. IRF8 was detected with consistent expression by qRT-PCR. Based on the CMap, DGIdb and L1000FWD databases, the 11 small molecular compounds that were most strongly therapeutic correlated with SONFH were estradiol, genistein, domperidone, lovastatin, myricetin, fenbufen, rosiglitazone, sirolimus, phenformin, vorinostat and vinblastine. All of 11 small molecules had good binding affinity with the IRF8 in molecular docking.

Conclusion: The occurrence of SONFH was associated with a "multi-target" and "multi-pathway" pattern, especially related to immunity, and IRF8 and its noncoding RNA were closely related to the development of SONFH. The CMap, DGIdb and L1000FWD databases could be effectively used in a systematic manner to predict potential drugs for the prevention and treatment of SONFH. However, additional clinical and experimental research is warranted.

Keywords: Competing endogenous RNA; Connectivity map database; Drug gene interaction database; Immune cell infiltration; L1000 fireworks display database; Molecular docking; Noncoding RNA; Steroid-induced osteonecrosis of the femoral head.


Conflict of interest statement

The authors declare no conflicts of interest regarding this work.

Figures

Fig. 1
Fig. 1
Microarray data processing and identification of DEGs of GSE123568 in SONFH samples compared to non-SONFH samples. A PCA of GSE123568 in SONFH samples compared to non-SONFH samples. The blue dot represented non-SONFH samples, and the red dot represented SONFH samples. B Volcano plots of DEGs. Data points in red represent upregulated, and blue represent downregulated genes. The differences were set as |log2FC|> 1 and adjusted P value < 0.01. The text was added directly to the plot by adjusted P value < 0.000001 and |log2FC|> 2. C Hierarchical clustering heatmap of the top 60 DEGs sorted by adjusted P value. Legend on the top right indicates the log2FC
Fig. 2
Fig. 2
Violin plot of gene expressions for the top 3 upregulated and downregulated mRNAs based on fold change
Fig. 3
Fig. 3
GSEA analysis of the most enriched gene sets of all detected genes in the non-SONFH and SONFH samples in the GSE123568. A The GSEA analysis ridgeplot of top 30 significant-enriched GO pathway gene sets. B The GSEA analysis ridgeplot of top 30 significant-enriched KEGG pathway gene sets. CThe GSEA plot of top 3 most significant upregulated enriched KEGG pathway gene sets
Fig. 4
Fig. 4
Gene ontology (GO) enrichment analysis of DEGs of GSE123568. A Advanced bubble chart showed the top 10 GO enrichment significance items of DEGs sorted by adjusted P value in BP, CC and MF. The x-axis label represented the gene ratio, and the y-axis label represented GO terms. B Chord plot showed the distribution of DEGs in different GO-enriched functions. Symbols of DEGs were presented on the left side of the graph with their fold change values mapped by color scale. Gene involvement in the GO terms was determined by colored connecting lines. C Cnet plot showed the relationship between the DEGs and GO terms
Fig. 5
Fig. 5
KEGG pathway analysis of DEGs of GSE123568. A Advanced bubble chart showed enrichment of DEGs in signaling pathways. The x-axis label represented the gene ratio and the y-axis label represented pathway. B Chord plot showed the distribution of DEGs in different KEGG pathways. Symbols of DEGs were presented on the left side of the graph with their fold change values mapped by color scale. Gene involvement in the KEGG pathways was determined by colored connecting lines. C Cnet plot showed the relationship between the DEGs and KEGG pathways
Fig. 6
Fig. 6
Evaluation and visualization of immune cell infiltration. A Heatmap plot of immune cell infiltration between non-SONFH samples and SONFH samples. B Spearman correlation analysis among 22 types of immune cells. The size of the colored squares represents the strength of the correlation; blue represent a positive correlation, red represents a negative correlation. The darker the color the stronger the correlation. * represents P < 0.05, ** represents P < 0.01. C Violin diagram of the proportion of 22 types of immune cells. The red marks represent the difference in infiltration between the two groups of samples
Fig. 7
Fig. 7
PPI network of DEGs and three cluster modules identified by MCODE. A The PPI network of DEGs was consisted of 300 nodes and 1192 edges. Each node represented one protein, while each edge represented one interaction. The color of nodes reflected the fold change, red color represented a upregulated gene, and blue color represented a downregulated gene, the darker the color indicated the greater the multiple of the fold change; the size of nodes reflected the degree value, the larger the node, the greater the degree value. B cluster 1: score 9.778, 19 nodes and 88 edges; C cluster 2: score 8.609, 24 nodes and 99 edges; D cluster 3: score 5.143, 22 nodes and 54 edges
Fig. 8
Fig. 8
ROC curve of the 11 specifically expressed hub genes in SONFH samples
Fig. 9
Fig. 9
The expression level of hub genes on mRNA in human bone marrow, adipose tissues and blood using by HPA, Bgee and BioGPS. Blue color was bone marrow, and green color was adipose tissue, and red color was blood. ** represents P < 0.01
Fig. 10
Fig. 10
A mRNA-miRNA co-expressed network. A Venn diagram of target miRNAs predicted by the hub genes at least 3 datasets. B The mRNA-miRNA co-expressed network was constructed by Cytoscape including 11 nodes and 10 edges. Node represented mRNA or miRNA, while edge represented interaction of mRNA and miRNA. Red circles represent the hub genes, and blue V-shapes represent miRNAs
Fig. 11
Fig. 11
The Sankey diagram of ceRNA networks of IRF8. Upper side of the plots represent the hub genes, and middle side of the plots represent the target miRNAs, and lower side of the plots and yellow diamonds represent the upstream lncRNAs
Fig. 12
Fig. 12
Validation of the expression of IRF8 via qRT-PCR. *P < 0.05
Fig. 13
Fig. 13
Venn diagram of potential drugs or molecular compounds in the L1000FWD, DGIdb and CMap databases
Fig. 14
Fig. 14
Molecular docking patterns of IRF8 and 11 small molecules complex (AK) the 2D molecular docking pattern of IRF8 with vorinostat, estradiol, fenbufen, phenformin, rosiglitazone, genistein, domperidone, vinblastine, myricetin, lovastatin and sirolimus, respectively

References

    1. Hines JT, Jo WL, Cui Q, et al. Osteonecrosis of the femoral head: an updated review of ARCO on pathogenesis, staging and treatment. J Korean Med Sci. 2021;36(24):e177. doi: 10.3346/jkms.2021.36.e177. - DOI - PMC - PubMed
    1. Mont MA, Cherian JJ, Sierra RJ, et al. Nontraumatic osteonecrosis of the femoral head: where do we stand today? A ten-year update. J Bone Joint Surg Am. 2015;97(19):1604–1627. doi: 10.2106/JBJS.O.00071. - DOI - PubMed
    1. Zhao DW, Yu M, Hu K, et al. Prevalence of nontraumatic osteonecrosis of the femoral head and its associated risk factors in the Chinese population: results from a Nationally Representative Survey. Chin Med J (Engl) 2015;128(21):2843–2850. doi: 10.4103/0366-6999.168017. - DOI - PMC - PubMed
    1. Cui Q, Jo WL, Koo KH, et al. ARCO consensus on the pathogenesis of non-traumatic osteonecrosis of the femoral head. J Korean Med Sci. 2021;36(10):e65. doi: 10.3346/jkms.2021.36.e65. - DOI - PMC - PubMed
    1. Fu W, Liu B, Wang B, et al. Early diagnosis and treatment of steroid-induced osteonecrosis of the femoral head. Int Orthop. 2019;43(5):1083–1087. doi: 10.1007/s00264-018-4011-y. - DOI - PMC - PubMed