. 2023 Jun;19(6):1821-1843.
doi: 10.1080/15548627.2022.2162245. Epub 2023 Jan 10.

The mitophagy receptor BNIP3 is critical for the regulation of metabolic homeostasis and mitochondrial function in the nucleus pulposus cells of the intervertebral disc

Affiliations

The mitophagy receptor BNIP3 is critical for the regulation of metabolic homeostasis and mitochondrial function in the nucleus pulposus cells of the intervertebral disc

Vedavathi Madhu et al. Autophagy. 2023 Jun.

Abstract

The contribution of mitochondria to the metabolic function of hypoxic NP cells has been overlooked. We have shown that NP cells contain networked mitochondria and that mitochondrial translocation of BNIP3 mediates hypoxia-induced mitophagy. However, whether BNIP3 also plays a role in governing mitochondrial function and metabolism in hypoxic NP cells is not known. BNIP3 knockdown altered mitochondrial morphology, and number, and increased mitophagy. Interestingly, BNIP3 deficiency in NP cells reduced glycolytic capacity reflected by lower production of lactate/H+ and lower ATP production rate. Widely targeted metabolic profiling and flux analysis using 1-2-13C-glucose showed that the BNIP3 loss resulted in redirection of glycolytic flux into pentose phosphate and hexosamine biosynthesis as well as pyruvate resulting in increased TCA flux. An overall reduction in one-carbon metabolism was noted suggesting reduced biosynthesis. U13C-glutamine flux analysis showed preservation of glutamine utilization to maintain TCA intermediates. The transcriptomic analysis of the BNIP3-deficient cells showed dysregulation of cellular functions including membrane and cytoskeletal integrity, ECM-growth factor signaling, and protein quality control with an overall increase in themes related to angiogenesis and innate immune response. Importantly, we observed strong thematic similarities with the transcriptome of a subset of human degenerative samples. Last, we noted increased autophagic flux, decreased disc height index and aberrant COL10A1/collagen X expression, signs of early disc degeneration in young adult bnip3 knockout mice. These results suggested that in addition to mitophagy regulation, BNIP3 plays a role in maintaining mitochondrial function and metabolism, and dysregulation of mitochondrial homeostasis could promote disc degeneration.Abbreviations: ECAR extracellular acidification rate; HIF hypoxia inducible factor; MFA metabolic flux analysis; NP nucleus pulposus; OCR oxygen consumption rate; ShBnip3 short-hairpin Bnip3.

Keywords: BNIP3; disc degeneration; hypoxia; intervertebral disc; metabolism; mitochondria; mitophagy; nucleus pulposus.


Conflict of interest statement

R.A. Barve may receive royalty income based on the CompBio technology developed by R.A. Barve and licensed by Washington University to PercayAI. The remaining authors declare they have no competing interests to disclose in relation to the contents of this article.

Figures
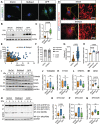
Figure 1.
Figure 1.
BNIP3 loss in NP cells affects mitochondria number and morphology. (A) Immunofluorescence staining for BNIP3 in ShCtrl- and ShBnip3 #1-transduced cells and 24-h DFP-treated cells. (B, C) Western blot of BNIP3 and corresponding densitometric analysis of multiple blots shown in NP cells after transduction with Bnip3 shRNA #1. (D) NP cells transduced with ShBnip3 showed tubular and well-networked mitochondria compared to ShCtrl. Scale bar: 15 and 4 μm. (E, F) Mitochondrial morphology and network analysis showed increased length and branching complexity of mitochondria in BNIP3-deficient NP cells. (G, H) Increase in mitochondrial number and mitoDNA content in BNIP3-deficient cells; 50 cells quantified from two independent experiments for data shown in G. (I-M) Immunoblot and quantification of mitochondrial outer membrane translocase TOMM20, inner membrane protein CYCS, fission protein DNM1L and fusion protein OPA1. (N-Q) Western blot and corresponding densitometry analysis of ETC proteins. Data represent six independent experiments. Statistical significance was determined using t-test (F, G) or One-way ANOVA (I-L, N-P) with Sidaks’s post hoc test as appropriate.
Figure 2.
Figure 2.
Loss of BNIP3 induces NP cell mitophagy. Immunofluorescence staining for (A, B) LC3 and comparable colocalization of LC3 puncta with mitochondria. (C, D) Immunofluorescence staining for LAMP1 and comparable colocalization of LAMP1 with mitochondria in ShBnip3 #1 and ShCtrl transduced cells. Z-stack images of 50 cells per group. Scale bar: 15 and 4 μm. (E) Western blot and densitometric quantification (F, G) of LC3 and LAMP1 in ShBnip3 #1, ShCtrl transduced NP cells and DFP treated cells. (H, I) Western blot analysis of ShCtrl and ShBnip3 transduced cells cultured under hypoxia with or without bafilomycin A1. (J) Schematic of mCherry-GFP-FIS1 knockin mitoQC mouse. The knockin was achieved by using a neomycin resistant CAG (cytomegalovirus early enhancer-chicken ACTB) promoter that included hGHpA (human growth hormone poly A). (K, L) Representative confocal images and quantification of mCherry-positive mitolysosmes of WT-mitoQC and bnip3-KO-mitoQC mouse NP cells. DAPI stained nuclei are shown in blue. Z-stack images of 30 cells per group. Scale bar: 15 and 4 μm. Western blot data represent 4–6 independent experiments. Statistical significance was determined using t-test (B, D) or Mann-Whitney test (L) or One-way ANOVA (F, G, I) with Sidaks’s post hoc test as appropriate.
Figure 3.
Figure 3.
BNIP3 loss does not result in a compensatory increase in levels and colocalization of other mitophagy receptors. (A, B) Western blot and densitometric quantification of mitophagy receptors BNIP3L, BCL2L13, and FUNDC1 in ShCtrl, ShBnip3 #1, and DFP-treated NP cells. (C, D) Immunofluorescence staining BNIP3L and quantification of BNIP3L colocalizing with mitochondria, and (E, F) Immunofluorescence staining FUNDC1 and quantification of FUNDC1 colocalizing with mitochondria. (G, H) Western blot and densitometric quantification of canonical mitophagy pathway protein PRKN in ShCtrl, ShBnip3, and DFP-treated NP cells. Western blot data represent six independent experiments. Colocalization BNIP3L and FUNDC1 with mitochondria was measured from Z-stack images of 100 cells per group. Scale bar: 15 and 4 μm. Statistical significance was determined using a t-test (D, F) or One-way ANOVA (B, H) with Sidaks’s post hoc test as appropriate.
Figure 4.
Figure 4.
BNIP3-loss dysregulates glycolytic capacity and ATP production rate in NP cells. (A, B) NP cells were transduced with ShCtrl and ShBnip3 and measured raw traces of extracellular acidification rate (ECAR) and oxygen consumption rate (OCR) in absence of exogenous glucose, after sequential addition of 10 mM glucose followed by rotenone plus myxothiazol and then monensin plus FCCP. (C) Calculation of proton production rate (PPR) of the A and B. (D) Raw traces of ECAR and OCR in absence of exogenous glucose, after sequential addition of 10 mM glucose followed by oligomycin and then rotenone plus myxothiazol and (F) ATP production rate of glycolytic and oxidative was calculated from graph D and E. Data represent four independent experiments each with four technical replicates/group. Statistical significance was determined using a One-way ANOVA with Sidaks’s post hoc test as appropriate.
Figure 5.
Figure 5.
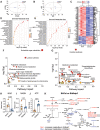
BNIP3 is a key regulator of hypoxic NP cell metabolism. (A) Unsupervised principal component analysis (PCA) of widely targeted small metabolites. (B) Supervised partial least square-discrimination analysis (PLS-DA) model. (C) Heat map normalized concentration of metabolites differentially found between ShCtrl and ShBnip3 using FDR adjusted p-value ≤0.05%. (D, E) Metabolite set enrichment analysis (MSEA) of upregulated and down regulated metabolites in NP cells transduced with ShCtrl and ShBnip3. (F, G) Metabolic pathway analysis (MetPA) of up and down regulated metabolites between ShCtrl and ShBnip3. (H-J) Differentially measured metabolites NAD, NADH, and ATP between ShCtrl and ShBnip3 cells. (K) Schematic showing metabolites that are increased (blue) or decreased (red) after the knockdown of BNIP3. Data are from four independent experiments. Statistical significance was computed using t-test (H-J). The significance of affected metabolites less than p < 0.05 were used for the enrichment and pathway analysis.
Figure 6.
Figure 6.
BNIP3 loss results in dysregulated eicosanoid metabolism in NP cells. Unsupervised principal component analysis (PCA) of widely targeted small metabolites. (B) Supervised partial least square-discrimination analysis (PLS-DA) model. (C) Heat map normalized concentration of eicosanoids differentially present between ShCtrl and ShBnip3 using ≤0.05% FDR adjusted p value. (D) Metabolic pathway analysis (MetPA) of differentially measured eicosanoids in ShBnip3. Data are from four independent experiments. The significance of affected metabolites less than p < 0.05 were used for the enrichment and pathway analysis.
Figure 7.
Figure 7.
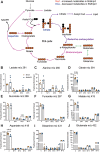
Loss of BNIP3 dysregulates glycolytic and mitochondrial metabolic flux in NP cells. (A) Summation of flux results through glycolysis, pentose, and TCA cycle using [1,2]-13C-glucose and assessing lactate and glutamate isotopomers after 24 of [1,2]-13C-glucose addition. Metabolites that are decreased shown in red after knockdown of BNIP3. If glucose directly metabolized through glycolytic pathway [1,2]-13C-glucose becomes [2,3]-13C lactate (and unlabeled lactate 1:1) [3].-13C-lactate is generated if glucose is diverted into the pentose phosphate pathway [2,3].-13C-pyruvate can enter the TCA cycle through PDH (pyruvate dehydrogenase) or PCX (pyruvate carboxylase). M1 of glutamate around m/z 103 reflects the presence of 13C at the fourth carbon position. This reflects acetyl units originating from glucose to pyruvate entering through PDH. M2 of glutamate 104 reflects the presence of 13C at the second and third carbon position, indicating pyruvate entering the oxaloacetate pool through PCX. M2 of Glutamate around 131 reflects the presence of 13C at either the third and fourth carbon position, or the fourth carbon and fifth carbons, and reflects the overall TCA cycle flux, from either pyruvate entering from PCX or PDH. (B) Glycolysis flux measured by M2 lactate m/z 91, (C) Pentose cycle flux measured by lactate using formula (M1/M2)/ (3 + M1/M2, (D) PCX+PDH flux measured glutamate m/z 131, I PCX flux measured glutamate m/z 104, (F) PDH flux measured glutamate m/z 103 (G) PDH/PCX flux measured by glutamate m/z 103-M1/104-M2, (H) alanine m/z 260, (I) citrate m/z 591, (J) succinate m/z 289, (K) fumarate m/z 287, (L) malate m/z 419, aspartate m/z 418, (N) glutamate m/z 432, (O) serine m/z 390, (P) cholesterol m/z 443 (Q) palmitate (C16:0) m/z 313, (R) stearic acid (C18:0) m/z 341, (S) oleic acid (C18:1) m/z 339. Data are from five independent experiments. Data points are not included for negative values (not detectable ∑ mn). Statistical significance was computed using t-test (B-G, H, J-P, R, S) or Mann-Whitney test (I, Q) as appropriate.
Figure 8.
Figure 8.
BNIP3 loss does not significantly alter glutamine flux through TCA cycle. (A) Summation of flux results through glycolysis, pentose, and TCA cycle using U13C-glucose and assessing isotopomers after 24 h of U13C-glutamine addition. Metabolites that are decreased are shown in red after the knockdown of BNIP3. (B) lactate m/z 261, (C) alanine m/z 260, (D) citrate m/z 591, (E) succinate m/z 289, (F) fumarate m/z 287, (G) malate m/z 419, (H) aspartate m/z 418, (I) glutamine m/z 431, (J) glutamate m/z 432. Data shown are from five independent experiments. Statistical significance was computed using a t-test (B-J).
Figure 9.
Figure 9.
BNIP3-loss in NP cells significantly impacts NP cell transcriptomic program. (A) Transcriptomic clustering profile by Principal Component Analysis (PCA) of ShCtrl and ShBnip3 cells. (B, C) Volcano plot and Hierarchical clustering of differentially expressed genes (DEGs) with FDR ≤0.05%, >2-fold change. The CompBio biological process maps generated from DEGs FDR ≤0.05% and 2-fold change are shown. (D) Themes associated with upregulated DEGs immune responses (blue), green), ECM-angiogenesis (red), sphingolipids (yellow) are highlighted. (E) Themes associated with downregulated DEGs ECM-muscle (Orange), cell-matrix interaction (blue), cell-membrane receptors (green) are highlighted. The size of a sphere is related to its enrichment score and thickness of the lines connecting themes signifies the number of genes shared between them.
Figure 10.
Figure 10.
Transcriptomic profiling of BNIP3-deficient NP cells shows commonality with transcriptomes of a subset of degenerative human discs. (A, B) ShBnip3 upregulated and down regulated themes showing similarity with transcriptome-based clusters generated from GSE70362 deposited microarray data based on histological grades. A pseudo heatmap showing global similarity as well as theme level similarity between transcriptional profiles of ShBnip3 model and human clusters (GSE70362). FDR ≤0.05% and 2-fold change transcripts were used for the comparison study. (A) Pseudo heat map for upregulated DEGs (B) pseudo heat map for downregulated DEGs.
Figure 11.
Figure 11.
Deletion of Bnip3 does affect disc health of 4-month-old mice. (A) Representative images of disc sections from 4-month-old WT and bnip3 KO-mitoQC reporter mice showing mitochondrial morphology (GFP labeling) and mCherry-positive (red) mitolysosomes from the NP compartment. (B) Quantification of mCherry-positive mitolysosmes from WT-mitoQC and bnip3 KO- mitoQC mouse NP tissue sections. DAPI-stained nuclei are shown in blue. Z-stack images were used for the calculations. (n = 3–4 discs/animal, 4 animals/genotype, 14–16 discs/genotype). (C) Disc height, and disc height index of 4-month-old WT and bnip3 KO mice. (n = 5–6 lumbar discs/animal, 9 animals/genotype, 52–54 lumbar discs/genotype). (D) Safranin O/Fast Green staining of lumbar discs showing disc morphology and overall proteoglycan content in the intervertebral disc. Whole disc (scale bar: 200 μm) and high-magnification images of the NP and AF compartment (scale bar: 100 μm) in 4-month wild-type and bnip3-KO mice. (E) Histological grade of degeneration using modified Thompson grading scale. (n = 5–6 lumbar discs/animal, 10 animals/genotype, 59–60 discs/genotype). (F, G) Representative images and quantitative immunohistological staining of SLC2A1 and COL10A1 from WT and bnip3 KO discs. (n = 5–6 lumbar discs/animal, 3 animals/genotype, 17–18 discs/genotype). Quantitative data represent mean ± SEM. Statistical significance was determined using a t-test (C, G) or Mann-Whitney test (B, E) if data were not normally distributed. (H) Schematic showing the consequences of BNIP3-loss on metabolic homeostasis and mitochondrial function in NP cells. PPP: pentose phosphate pathway; HBP: hexosamine biosynthetic pathway; PDH: pyruvate dehydrogenase. Quantitative measures were determined by using an unpaired t-test or Mann-Whitney test if data were not normally distributed.

References

    1. Livshits G, Popham M, Malkin I, et al. Lumbar disc degeneration and genetic factors are the main risk factors for low back pain in women: the UK twin spine study. Ann Rheum Dis. 2011;70(10):1740–1745. PMID: 2164416. - PMC - PubMed
    1. James SL, Abate D, Abate KH, et al. Global, regional, and national incidence, prevalence, and years lived with disability for 354 diseases and injuries for 195 countries and territories, 1990-2017: a systematic analysis for the global burden of disease study 2017. Lancet. 2018;392:1789–1858. PMID: 30496104. - PMC - PubMed
    1. Silagi ES, Shapiro IM, Risbud MV.. Glycosaminoglycan synthesis in the nucleus pulposus: dysregulation and the pathogenesis of disc degeneration. Matrix Biol. 2018;72:368–379. PMID: 29501510. - PMC - PubMed
    1. Choi H, Tessier S, Silagi ES, et al. A novel mouse model of intervertebral disc degeneration shows altered cell fate and matrix homeostasis. Matrix Biol. 2018. PMID: 29605718;70:102–122. - PMC - PubMed
    1. Tessier S, Tran VA, Ottone OK, et al. TonEBP-deficiency accelerates intervertebral disc degeneration underscored by matrix remodeling, cytoskeletal rearrangements, and changes in proinflammatory gene expression. Matrix Biol. 2020. PMID: 31707045;87:94–111. - PMC - PubMed

Publication types