. 2023 Mar;10(9):e2204175.
doi: 10.1002/advs.202204175. Epub 2023 Jan 11.

Engineering Cyborg Bacteria Through Intracellular Hydrogelation

Affiliations

Engineering Cyborg Bacteria Through Intracellular Hydrogelation

Luis E Contreras-Llano et al. Adv Sci (Weinh). 2023 Mar.

Abstract

Natural and artificial cells are two common chassis in synthetic biology. Natural cells can perform complex tasks through synthetic genetic constructs, but their autonomous replication often causes safety concerns for biomedical applications. In contrast, artificial cells based on nonreplicating materials, albeit possessing reduced biochemical complexity, provide more defined and controllable functions. Here, for the first time, the authors create hybrid material-cell entities termed Cyborg Cells. To create Cyborg Cells, a synthetic polymer network is assembled inside each bacterium, rendering them incapable of dividing. Cyborg Cells preserve essential functions, including cellular metabolism, motility, protein synthesis, and compatibility with genetic circuits. Cyborg Cells also acquire new abilities to resist stressors that otherwise kill natural cells. Finally, the authors demonstrate the therapeutic potential by showing invasion into cancer cells. This work establishes a new paradigm in cellular bioengineering by exploiting a combination of intracellular man-made polymers and their interaction with the protein networks of living cells.

Keywords: cellular chassis; hybrid material; hydrogel; nonculturable cells; nonreplicating bacteria; synthetic biology.


Conflict of interest statement

L.E.C‐L., C.M.H., and C.T submitted a provisional patent application covering the process described in this study. The rest of the authors declare no competing interests.

Figures
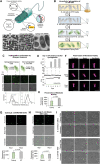
Figure 1
Figure 1
Engineering Cyborg Cells through intracellular hydrogelation. A) Top panel: Graphic representation of a Cyborg Cell highlighting its characteristics. Cyborg Cells do not divide, preserve metabolic and protein‐synthesis activities, maintain membrane fluidity, and gain new resistance to environmental stressors. Bottom panel: TEM images of Cyborg and Wild Type (WT) E. coli BL21 (DE3) Cells (Scale bar = 1 µm, zoomed image = 200 nm) (See Methods Section M17). B) Schematic illustrating the procedure to hydrogelate E. coli cells. 1) Mix the hydrogel buffer with an exponentially growing culture of the desired E. coli strain. 2) Make the hydrogel buffer permeate the bacterial membrane through a freeze and thaw cycle (−80 to 37 °C). 3) Eliminate replicating cells using a high concentration of Carbenicillin. C) Membrane solubilization using 1% SDS to evaluate successful bacterial hydrogelation of E. coli BL21(DE3). Top panels: Representative microscopy images of the bacteria infused with hydrogel components treated (+) and untreated (‐) with 1% SDS. Bottom panels: Histogram of single‐cell fluorescence intensity. Non‐hydrogelated bacteria show a decrease in fluorescence intensity caused by the escape of Fluorescein DA after SDS treatment. In contrast, Cyborg Cells maintain green fluorescence intensity after 1% SDS treatment. (Scale bar = 5 µm, n = 3 independent experiments). See Methods Section M3, and Figure S1, Supporting Information, for replicates. D) CFU counting assays confirm that Cyborg Cells cannot replicate. Top panel: CFU counts of hydrogelated and non‐hydrogelated bacteria under different conditions on Day 1. Bottom panel: CFU counts of Cyborg Cells and Wild Type bacteria (WT, E. coli BL21 (DE3) across 7 days. (Error bar = SD, n = 3 independent experiments). E) Cyborg Bacteria Cells preserve metabolic activity. Cyborg Cells created using the strain E. coli BL21 (DE3) show comparable levels of metabolic activity according to an assay measuring reduction capacity inside the cell. See Methods M4. Data are presented as mean values. (Error bar = SD, n  =  3 independent experiments). Standard two‐tail t‐test. F) Fluorescence recovery after photobleaching (FRAP) assay shows the preservation of membrane fluidity in Cyborg Cells. (Scale bar = 2 µm, n = 3 independent experiments). See Methods Section M7 and Figure S5, Supporting Information. G&H) Cyborg E. coli MG1655 (G) and E. coli Nissle 1917 (H) Cells. Top panels: Fluorescence microscopy images of hydrogelated bacteria. The hydrogel was labeled with Fluorescein (Methods Section M2, Figure S6) (Scale bar = 5 µm, n = 3 independent experiments). Bottom panels: Metabolic activity of Cyborg & Wild Type cells (Figure S7, Supporting Information) (n = 3 independent experiments). I) Cyborg E. coli BL21 (DE3) and MG1655 Cells exhibit motility similar to untreated cells. Sequential timelapse images of Cyborg and untreated cells showing similar motility patterns. We followed individual cells across 100 Frames (≈5 s) (See Videos [Link], [Link], [Link], [Link], Supporting Information) (Scale bar = 5 µm, n = 3 independent experiments).
Figure 2
Figure 2
Protein expression and proteome characterization of Cyborg Cells A) Cyborg Bacterial Cells express mOrange in response to IPTG induction. Fluorescence microscopy images of Cyborg Cells derived from the strain E. coli BL21 (DE3) pIURKL‐mOrange pLysS after 12 h incubation with and without 1 mM IPTG. (Scale bar = 5 µm, n = 3 independent experiments). B) Single‐cell tracking of mOrange expressing Cyborg Cells. Cyborg Cells do not grow but express mOrange after 8 h of IPTG induction. (Scale bar = 5 µm, Methods Section M5). C) Cyborg Cells and Wild Type Bacteria show comparable mOrange expression. Expression levels of mOrange after 12 h incubation with (+, filled bar) and without (‐, unfilled bar) IPTG (Methods Section M11). See Figure S8, Supporting Information, for the continuous tracking of the reaction and for optical density measurements of the samples during this experiment. (Error bar = SD, n  =  4 independent experiments). Standard two‐tail t‐test. D) Principal component analysis (PCA) shows the grouping of our different samples based on their protein profile. E) Total log difference between the protein intensities of each sample calculated as the average of each functional group and compared against the abundance of the proteins in our Wild Type control. The colorbar indicates the color code for the value of the total log difference.
Figure 3
Figure 3
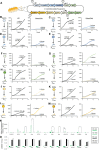
Cyborg Cells can be functionalized using synthetic biology parts. A) Schematic of the Marionette‐Pro strain and its sensor array. B‐M) Response of Wild Type Controls (Left Panel) and Cyborg Cells (Right Panel) to the small molecule activating YFP expression in each strain. Wild Type and Cyborg Cells uninduced (‐) and induced (+) using: B) 25 µM DAPG (2,4‐diacetylphloroglucinol). C) 100 µM Cuma (Cuminic acid). D) 10 µM OC6 (3OC6‐AHL). E) 100 µM Van (Vanillic acid). F) 1 mM IPTG (Isopropyl‐β‐d‐thiogalactoside). G) 200 nM aTc (anhydrotetracycline). H) 4 mM Ara (L‐arabinose). I) 10 mM Cho (choline chloride). J) 1 mM Nar (naringenin). K) 1 mM DHBA (3,4‐Dihydroxybenzoic acid). L) 100 µM Sal (sodium salicylate). M) 10 µM OHC14 (3OHC14:1‐AHL). Each schematic on the left of each plot shows the activation (black arrow) of each promoter by the corresponding small molecule inducer (colored circles). Results are not normalized or adjusted based on their optical density. (n = 4 independent experiments). N) Expression rate of each Wild Type and Cyborg Cell strain functionalized with different synthetic circuits. Filled green bar = Cyborg Cells without inducer. Open green bar = Cyborg Cells with inducer. Filled black bar = Wild Type cells without inducer. Open black bar = Wild Type Cells with inducer. CC = Cyborg Cells. WT = Wild Type Cells. (Error bars = SD, n = 4 independent experiments). Most uninduced and induced pairs show significant differences, except as indicated (n.s.). Only the significantly different induced expression rates between WT and CC are highlighted (*). O) Optical density changes (OD600nm) over 10 h of each circuit. (Error bars SD, n = 4 independent experiments). See Methods Section M10.
Figure 4
Figure 4
Cyborg Cells gain new non‐native functions A) Cyborg E. coli (Migula) Castellani and Chalmers Cells remain stable after hydrogen peroxide (H2O2) treatment (10% w/w, 3 M). Wild Type Cells are lysed under the treatment with H2O2. All cells were fixed with 4% paraformaldehyde and then stained with DAPI (10 µg mL−1) (Blue color). Representative images (n = 3 independent experiments). B) Cyborg E. coli BL21(DE3) Cells resist D‐Cycloserine treatment. Wild Type Cells (WT) are lysed. Cyborg Cells remain stable and are capable of mOrange expression when incubated in media containing 200 µg mL−1 D‐Cycloserine. (n = 3 independent experiments). See Figure S12, Supporting Information. C) Cyborg E. coli BL21(DE3) Cells remain stable in media with high pH. Cyborg Cells express mOrange when incubated in media at pH 7–9. Under our experimental conditions, at pH 8, Wild Type Cells form filaments and stop expressing the fluorescent protein reporter. At pH 9, the cells are lysed. (n = 3 independent experiments). All cells were induced with IPTG (1 mM) and incubated in a media at the specific pH at the same time. See Figure S13, Supporting Information.
Figure 5
Figure 5
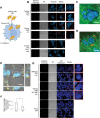
Cyborg Cells are capable of cancer cell invasion A) Schematic of Cyborg Cells expressing mOrange and Invasin (inv+) invading cancer cells. This uptake is facilitated by the binding of invasin and β1‐integrins displayed on the membrane of cancer cells. B) Confocal microscopy images of SY‐SY5Y cells coincubated with Cyborg E. coli BL21(DE3) Cells expressing (+inv) and not expressing (‐inv) invasin. Controls are SY‐SY5Y cells stained with Hoechst with no Cyborg Cells. All Cyborg Cells express mOrange (orange) and all SY‐SY5Y cells are stained with Hoechst (blue) (Scale bar = 10 µm, n = 2 independent experiments). See Methods Section M14. C) Representative image of Cyborg Cells expressing mOrange incubated with SH‐SY5Y cells. The images were obtained through confocal microscopy (Methods Section M14). They were pseudo‐colorized for clarity and to facilitate blind counting of Cyborg Cells invading mammalian cells. (Scale bar = 10 µm, n = 2 independent experiments). D) Representative image of Cyborg Cells expressing mOrange and Invasin incubated with SH‐SY5Y cells. The images were obtained through confocal microscopy (Methods Section M14) and pseudo‐colorized for clarity and to help the analysis through blind counting of Cyborg Cells invading mammalian cells. (Scale bar = 10 µm, n = 3 independent experiments) E) Cross‐sectional Z‐stack images obtained by confocal microscopy showing Cyborg Cells expressing mOrange and Invasin incubated with SH‐SY5Y cells. Blue: cell nuclei of cells stained with Hoechst dye. Orange: mOrange of Cyborg Cells. Grey: Bright field. See Methods Section M14. (Scale bar = 10 µm, n = 2 independent experiments). F) Ratio of SH‐SY5Y cells invaded by Cyborg Cells (inv = Invasin). Error bar = SEM (n = 12). See Methods Section M14, and Figure S15, Supporting Information. G) Representative images of Wild Type, Cyborg, and Fixed Cells, incubated with HeLa cells. Methods Section M15, (Scale bars = 10 & 5 µm).

Similar articles

Cited by

References

    1. Nielsen J., Keasling J. D., Cell 2016, 164, 1185. - PubMed
    1. Xie M., Fussenegger M., Nat. Rev. Mol. Cell Biol. 2018, 19, 507. - PubMed
    1. Charbonneau M. R., Isabella V. M., Li N., Kurtz C. B., Nat. Commun. 2020, 11, 1738. - PMC - PubMed
    1. Dvořák P., Nikel P. I., Damborský J., de Lorenzo V., Biotechnol. Adv. 2017, 35, 845. - PubMed
    1. Din M. O., Danino T., Prindle A., Skalak M., Selimkhanov J., Allen K., Julio E., Atolia E., Tsimring L. S., Bhatia S. N., Hasty J., Nature 2016, 536, 81. - PMC - PubMed

Publication types