. 2023 Apr;14(2):940-954.
doi: 10.1002/jcsm.13171. Epub 2023 Jan 11.

The X-linked Becker muscular dystrophy (bmx) mouse models Becker muscular dystrophy via deletion of murine dystrophin exons 45-47

Affiliations

The X-linked Becker muscular dystrophy (bmx) mouse models Becker muscular dystrophy via deletion of murine dystrophin exons 45-47

Christopher R Heier et al. J Cachexia Sarcopenia Muscle. 2023 Apr.

Abstract

Background: Becker muscular dystrophy (BMD) is a genetic neuromuscular disease of growing importance caused by in-frame, partial loss-of-function mutations in the dystrophin (DMD) gene. BMD presents with reduced severity compared with Duchenne muscular dystrophy (DMD), the allelic disorder of complete dystrophin deficiency. Significant therapeutic advancements have been made in DMD, including four FDA-approved drugs. BMD, however, is understudied and underserved-there are no drugs and few clinical trials. Discordance in therapeutic efforts is due in part to lack of a BMD mouse model which would enable greater understanding of disease and de-risk potential therapeutics before first-in-human trials. Importantly, a BMD mouse model is becoming increasingly critical as emerging DMD dystrophin restoration therapies aim to convert a DMD genotype into a BMD phenotype.

Methods: We use CRISPR/Cas9 technology to generate bmx (Becker muscular dystrophy, X-linked) mice, which express an in-frame ~40 000 bp deletion of exons 45-47 in the murine Dmd gene, reproducing the most common BMD patient mutation. Here, we characterize muscle pathogenesis using molecular and histological techniques and then test skeletal muscle and cardiac function using muscle function assays and echocardiography.

Results: Overall, bmx mice present with significant muscle weakness and heart dysfunction versus wild-type (WT) mice, despite a substantial improvement in pathology over dystrophin-null mdx52 mice. bmx mice show impaired motor function in grip strength (-39%, P < 0.0001), wire hang (P = 0.0025), and in vivo as well as ex vivo force assays. In aged bmx, echocardiography reveals decreased heart function through reduced fractional shortening (-25%, P = 0.0036). Additionally, muscle-specific serum CK is increased >60-fold (P < 0.0001), indicating increased muscle damage. Histologically, bmx muscles display increased myofibre size variability (minimal Feret's diameter: P = 0.0017) and centrally located nuclei indicating degeneration/regeneration (P < 0.0001). bmx muscles also display dystrophic pathology; however, levels of the following parameters are moderate in comparison with mdx52: inflammatory/necrotic foci (P < 0.0001), collagen deposition (+1.4-fold, P = 0.0217), and sarcolemmal damage measured by intracellular IgM (P = 0.0878). Like BMD patients, bmx muscles show reduced dystrophin protein levels (~20-50% of WT), whereas Dmd transcript levels are unchanged. At the molecular level, bmx muscles express increased levels of inflammatory genes, inflammatory miRNAs and fibrosis genes.

Conclusions: The bmx mouse recapitulates BMD disease phenotypes with histological, molecular and functional deficits. Importantly, it can inform both BMD pathology and DMD dystrophin restoration therapies. This novel model will enable further characterization of BMD disease progression, identification of biomarkers, identification of therapeutic targets and new preclinical drug studies aimed at developing therapies for BMD patients.

Keywords: Becker muscular dystrophy; Duchenne muscular dystrophy; dystrophin; dystrophin-associated proteins; exon skipping; inflammation; microRNAs.


Conflict of interest statement

AJR is co‐founder and chief scientific officer of Edgewise Therapeutics. BNS is an employee of Edgewise Therapeutics. Edgewise Therapeutics did not fund the research and did not fund the generation or initial characterization of the bmx mouse model; AJR and BNS performed and analysed ex vivo muscle contraction experiments. CRH and AAF have filed a provisional intellectual property application related to the research in the manuscript.

Figures

Figure 1
Figure 1
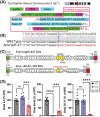
Generation of the bmx mouse model of BMD by deletion of dystrophin exons 45–47. (A) Schematic of the dystrophin gene showing CRISPR/Cas9‐targeted deletion of exons 45–47. (B) DNA sequencing showing genomic deletion of dystrophin exons 45–47. (C) Protein structure of dystrophin Δ45–47 shows disruption of the nNOS binding domain and a disruption of the rod domain that results in an out‐of‐phase spectrin‐type repeat (STR) pattern. (D) mRNA levels of dystrophin exons 2–3 and exons 76–77 are unchanged in Becker muscular dystrophy (bmx) mice, whereas dystrophin exons 45–46 are deleted in quadriceps muscle. NT = amino‐terminus, H = Hinge, R = STR, CR = cysteine‐rich, CT = carboxy‐terminus. ANOVA; n = 7–8; ***P < 0.001, ****P ≤ 0.0001.
Figure 2
Figure 2
The bmx mouse has reduced motor function, muscle force and heart function. (A) Grip strength of bmx mice was reduced in both the forelimb (P = 0.0465) and hindlimb (P = 0.0002) grip strength tests. n = 8. (B) Suspension time of bmx mice was reduced in the wire hang test (P = 0.0087) and in the box hang test (P = 0.0489). n = 8. (C) In vivo maximum isometric torque and torque‐frequency curve for anterior crural muscles of WT, bmx, and mdx52 mice. Maximum isometric torque was reduced in bmx mice (P = 0.0110). n = 6–7. (D) Left; ex vivo eccentric contraction‐induced lengthening force drop in EDL, bmx shows increased injury (force drop) versus WT. (P = 0.0249); right; force drop, expressed as a percent of initial eccentric contraction force, is shown across 10 eccentric contractions. (E) Echocardiography of aged (18‐month‐old) bmx mice shows a deficit in heart function through a decrease in fractional shortening (P = 0.0036) and ejection fraction (P = 0.0131). n = 5–7. (F) Representative M‐mode images of the parasternal short axis are provided. (G) Serum CKM levels in aged (1‐year‐old) mice assayed via ELISA. n = 6–7. ANOVA, *P ≤ 0.05, **P ≤ 0.01, ***P ≤ 0.001, ****P ≤ 0.0001.
Figure 3
Figure 3
bmx mice have increased muscle mass. Body and tissue weights of age‐matched WT, bmx and mdx52 mice were assayed at 5 months of age. (A) bmx mice show moderate increases in body mass at 5 months (P = 0.0633; n = 8). (B,C) The weight of the tibialis anterior (TA; P = 0.0096) and (C) quadriceps (P = 0.0456; n = 12) is significantly increased in bmx mice. (D) Heart weight in bmx mice is similar to that of WT mice (P = 0.4288; n = 8). (E) Spleen weight was elevated in bmx mice but was not significant (P = 0.1048; n = 6–8). ANOVA, *P ≤ 0.05, **P ≤ 0.01, ****P < 0.0001.
Figure 4
Figure 4
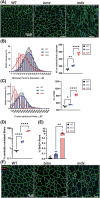
Muscles from bmx mice show centrally localized nuclei and increased variation in fibre size. (A) Laminin immunofluorescence of WT, bmx and mdx52 gastrocnemius muscle. DAPI was used as counterstain to visualize myonuclei. Bar = 100 μM. (B) Histogram of minimal Feret's diameter and the variance coefficient (VC) of minimal Feret's diameter. Bmx myofibres have increased variation of minimal Feret's diameter (P = 0.0017; n = 4). (C) Histogram of myofibre cross sectional area (CSA) and VC of myofibre CSA. bmx myofibres have increased variation of CSA (P = 0.0182; n = 4). (D) The percentage of centrally nucleated myofibres was increased in bmx mice (P < 0.0001; n = 4). (e) % of BrdU+ fibres in the tibialis anterior (P = 0.0058; n = 6). (F) BrdU immunofluorescence, Bar = 50 μM. ANOVA, *P ≤ 0.05, **P ≤ 0.01, ***P ≤ 0.001.
Figure 5
Figure 5
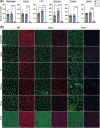
Dystrophin protein levels, but not RNA, are reduced in bmx mice. (A) qRT‐PCR showing levels of Dmd mRNA as measured by a probe specific to the exon 76–77 junction in the diaphragm, quadriceps, tibialis anterior, gastrocnemius, triceps and heart of WT, bmx and mdx52 mice. n = 7–8. (B) Dystrophin (red) and laminin (green) immunofluorescence staining shows reduction of dystrophin in skeletal and cardiac muscles in bmx mice. DAPI was used as a counterstain to visualize myonuclei. Bar = 50 μM. ANOVA, *P ≤ 0.05, ****P 0.0001.
Figure 6
Figure 6
Quantification of dystrophin protein in bmx mice using capillary Western assay and localization of dystrophin‐associated proteins. (A) Dystrophin protein levels were determined by capillary electrophoresis immunoassay. Depicted is a virtual Wes blot. (B) Wes quantification in the diaphragm (P < 0.0001), triceps (P < 0.0001) and heart (P < 0.0001) of bmx mice. ANOVA, n = 7–8. **P ≤ 0.01, ****P ≤ 0.0001. (C) nNOS immunofluorescence (red) was performed in the gastrocnemius muscles and shows an absence of staining for both bmx and mdx. (D) Immunofluorescence for the dystrophin‐associated protein α‐sarcoglycan (green) was performed in gastrocnemius muscles of WT, bmx and mdx52 muscles. Results show reduced staining and reduced colocalization in bmx and mdx52 at the sarcolemma. Laminin (red) was used to visualize all muscle fibres and DAPI was used as a counterstain to visualize myonuclei. Bar = 50 μM.
Figure 7
Figure 7
Muscle inflammation is present in bmx mice. (A) Heat map of inflammatory gene expression depicting fold change in bmx over WT in the diaphragm (Dia), quadriceps (Quad), gastrocnemius (Gas), triceps (Tri) and tibialis anterior (TA). (B) Ccl2 and Il1b are elevated in bmx gastrocnemius muscles n = 8. (C) Heat map of dystrophin‐targeting miRNA and inflammatory miRNA expression depicting fold change in bmx over WT. (D) Graphs show elevated levels of dystrophin‐targeting miRNAs miR‐146a and miR‐31 in bmx gastrocnemius muscles n = 8. (E) Graphs show elevated levels of chronic inflammatory miRNAs miR‐142‐3p and miR‐142‐5p in bmx gastrocnemius muscles. (F) Haematoxylin and eosin‐stained gastrocnemius of WT, bmx and mdx52 mice. Left: representative images, right: quantification of dystrophic foci in muscles showing bmx mice have an increase in inflammation and necrosis n = 5. ANOVA. #P < 0.10; *P < 0.05; **P ≤ 0.01, ****P ≤ 0.0001.
Figure 8
Figure 8
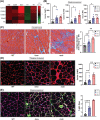
Markers of fibrosis and muscle damage in bmx mice. (A) Heat map showing relative levels of fibrosis‐associated genes in all bmx skeletal muscle analysed (vs. WT). (B) qRT‐PCR of gastrocnemius muscle from WT, bmx and mdx52 muscles showing elevated Col1a1 (P = 0.0288), Col3a1 (P = 0.0452) and Tnc (P = 0.0273) n = 8. (C) Trichrome staining of quadriceps muscle from WT, bmx and mdx52 mice. Bmx mice show a 41.7% increase in fibrotic staining area (P = 0.0217), ANOVA. (D) left: Col1a1 immunofluorescence was performed in the tibialis anterior (TA) muscles and shows thickening around myofibres in bmx and mdx52 mice; right: qPCR of Col1a1 in TA muscles showed elevated expression in bmx (P = 0.0085) n = 8. (E) WT, bmx and mdx52 quadriceps were immunostained with an antibody against IgM to assess muscle damage. The bmx gastrocnemius muscles showed a 309.2% increase in IgM‐positive myofibers (P = 0.0878; n = 3–4). ANOVA, *P ≤ 0.05, **P ≤ 0.01.

References

    1. Koenig M, Beggs AH, Moyer M, Scherpf S, Heindrich K, Bettecken T, et al. The molecular basis for Duchenne versus Becker muscular dystrophy: correlation of severity with type of deletion. Am J Hum Genet 1989;45:498–506. - PMC - PubMed
    1. Hoffman EP, Fischbeck KH, Brown RH, Johnson M, Medori R, Loike JD, et al. Characterization of dystrophin in muscle‐biopsy specimens from patients with Duchenne's or Becker's muscular dystrophy. N Engl J Med 1988;318:1363–1368. - PubMed
    1. Hoffman EP, Brown RH Jr, Kunkel LM. Dystrophin: the protein product of the Duchenne muscular dystrophy locus. Cell 1987;51:919–928. - PubMed
    1. Ringel SP, Carroll JE, Schold SC. The spectrum of mild X‐linked recessive muscular dystrophy. Arch Neurol 1977;34:408–416. - PubMed
    1. Comi GP, Prelle A, Bresolin N, Moggio M, Bardoni A, Gallanti A, et al. Clinical variability in Becker muscular dystrophy. Genetic, biochemical and immunohistochemical correlates. Brain 1994;117:1–14. - PubMed

Publication types