

Current and lagged climate affects phenology across diverse taxonomic groups
- PMID: 36629105
- PMCID: PMC9832555
- DOI: 10.1098/rspb.2022.2181
Current and lagged climate affects phenology across diverse taxonomic groups
Abstract
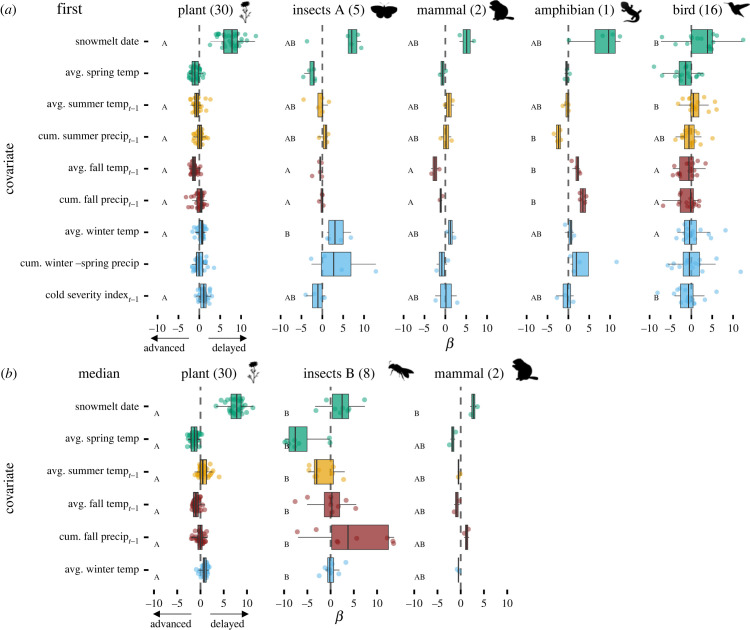
The timing of life events (phenology) can be influenced by climate. Studies from around the world tell us that climate cues and species' responses can vary greatly. If variation in climate effects on phenology is strong within a single ecosystem, climate change could lead to ecological disruption, but detailed data from diverse taxa within a single ecosystem are rare. We collated first sighting and median activity within a high-elevation environment for plants, insects, birds, mammals and an amphibian across 45 years (1975-2020). We related 10 812 phenological events to climate data to determine the relative importance of climate effects on species' phenologies. We demonstrate significant variation in climate-phenology linkage across taxa in a single ecosystem. Both current and prior climate predicted changes in phenology. Taxa responded to some cues similarly, such as snowmelt date and spring temperatures; other cues affected phenology differently. For example, prior summer precipitation had no effect on most plants, delayed first activity of some insects, but advanced activity of the amphibian, some mammals, and birds. Comparing phenological responses of taxa at a single location, we find that important cues often differ among taxa, suggesting that changes to climate may disrupt synchrony of timing among taxa.
Keywords: climate change; lags; long-term; montane; phenological mismatch; phenology.
Conflict of interest statement
We declare we have no competing interests.
Figures


Similar articles
-
Community-level phenological response to climate change.Proc Natl Acad Sci U S A. 2013 Aug 13;110(33):13434-9. doi: 10.1073/pnas.1305533110. Epub 2013 Jul 30. Proc Natl Acad Sci U S A. 2013. PMID: 23901098 Free PMC article.
-
Climate warming changes synchrony of plants and pollinators.Proc Biol Sci. 2022 Mar 30;289(1971):20212142. doi: 10.1098/rspb.2021.2142. Epub 2022 Mar 30. Proc Biol Sci. 2022. PMID: 35350857 Free PMC article.
-
Spring wildflower phenology and pollinator activity respond similarly to climatic variation in an eastern hardwood forest.Oecologia. 2020 Jun;193(2):475-488. doi: 10.1007/s00442-020-04670-4. Epub 2020 May 18. Oecologia. 2020. PMID: 32462408
-
Phenological and elevational shifts of plants, animals and fungi under climate change in the European Alps.Biol Rev Camb Philos Soc. 2021 Oct;96(5):1816-1835. doi: 10.1111/brv.12727. Epub 2021 Apr 27. Biol Rev Camb Philos Soc. 2021. PMID: 33908168 Review.
-
Shifts in phenology due to global climate change: the need for a yardstick.Proc Biol Sci. 2005 Dec 22;272(1581):2561-9. doi: 10.1098/rspb.2005.3356. Proc Biol Sci. 2005. PMID: 16321776 Free PMC article. Review.
Cited by
-
Untangling the Complexity of Climate Change Effects on Plant Reproductive Traits and Pollinators: A Systematic Global Synthesis.Glob Chang Biol. 2025 Feb;31(2):e70081. doi: 10.1111/gcb.70081. Glob Chang Biol. 2025. PMID: 39996366 Free PMC article.
-
Shifts in avian migration phenologies do not compensate for changes to conditions en route in spring and fall.Ecology. 2025 May;106(5):e70110. doi: 10.1002/ecy.70110. Ecology. 2025. PMID: 40383990 Free PMC article.
-
Global change aggravates drought, with consequences for plant reproduction.Ann Bot. 2025 Feb 8;135(1-2):89-104. doi: 10.1093/aob/mcae186. Ann Bot. 2025. PMID: 39692585 Review.
-
Understanding the effects of weather parameters on the population dynamics of an endangered geophyte supports monitoring efficiency.Sci Rep. 2024 Oct 29;14(1):25974. doi: 10.1038/s41598-024-76942-5. Sci Rep. 2024. PMID: 39472485 Free PMC article.
-
Growing Season Lengthens in a North American Deciduous Woody Community From 1993 to 2021.Ecol Evol. 2025 May 19;15(5):e71226. doi: 10.1002/ece3.71226. eCollection 2025 May. Ecol Evol. 2025. PMID: 40391119 Free PMC article.
