. 2023 Jan 25;51(2):982-996.
doi: 10.1093/nar/gkac1248.

Metabolically-targeted dCas9 expression in bacteria

Affiliations

Metabolically-targeted dCas9 expression in bacteria

Gregory M Pellegrino et al. Nucleic Acids Res. .

Abstract

The ability to restrict gene expression to a relevant bacterial species in a complex microbiome is an unsolved problem. In the context of the human microbiome, one desirable target metabolic activity are glucuronide-utilization enzymes (GUS) that are implicated in the toxic re-activation of glucuronidated compounds in the human gastrointestinal (GI) tract, including the chemotherapeutic drug irinotecan. Here, we take advantage of the variable distribution of GUS enzymes in bacteria as a means to distinguish between bacteria with GUS activity, and re-purpose the glucuronide-responsive GusR transcription factor as a biosensor to regulate dCas9 expression in response to glucuronide inducers. We fused the Escherichia coli gusA regulatory region to the dCas9 gene to create pGreg-dCas9, and showed that dCas9 expression is induced by glucuronides, but not other carbon sources. When conjugated from E. coli to Gammaproteobacteria derived from human stool, dCas9 expression from pGreg-dCas9 was restricted to GUS-positive bacteria. dCas9-sgRNAs targeted to gusA specifically down-regulated gus operon transcription in Gammaproteobacteria, with a resulting ∼100-fold decrease in GusA activity. Our data outline a general strategy to re-purpose bacterial transcription factors responsive to exogenous metabolites for precise ligand-dependent expression of genetic tools such as dCas9 in diverse bacterial species.


Figures

Figure 1.
Figure 1.
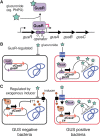
Strategy to regulate dCas9 with ligand-responsive transcription factors. (A) Schematic of the E. coli gusA operon (not to scale) and impact of glucuronide on GusR binding and gus expression. Small right-facing arrows indicate promoters and large right-facing arrows indicate individual genes. The GusR operator binding sites (O1 and O2) upstream of GusA are indicated by filled rectangles. (B) Strategy to regulate dCas9 expression using GusR regulation and glucuronide or (C) an exogenous inducer (polygon) and associated transcription factor (TF). Glucuronide (green star) can be imported to induce GusR-regulated dCas9 expression only in GUS+ bacteria (top right, red outlined bacteria), but not in GUS− negative bacteria (top left, black outlined bacteria). In contrast, dCas9 expression will be induced by an exogenous compound (such as l-arabinose) in both GUS+ or GUS− negative bacteria.
Figure 2.
Figure 2.
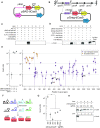
Repression of GusA activity in E. coli with dCas9. (A) Schematic of the arabinose-regulated pBAD-dCas9. Large right-facing arrows represent genes and small right-facing arrows represent promoters. CmR, chloramphenicol resistance gene; pTet, promoter from the tetracycline resistance gene; pBAD, arabinose-inducible promoter. (B) Schematic of pGreg-dCas9 with the E. coli gus operon (not to scale) depicted on top with dashed line indicating the gusA regulatory region cloned upstream of dCas9. O1 and O2, GusR operator binding sites; pGusA, promoter from the gusA regulatory region. (C) Expression of dCas9 from E. coli harbouring pBAD-dCas9 under the indicated conditions assessed by western blot with an anti-Cas9 antibody. (D) Expression of dCas9 under the indicated conditions with E. coli harbouring pBad-dCas9 or pGreg-dCas9 assessed by western blots with an anti-Cas9 antibody. The positive control is 5 ng of purified Streptococcus pyogenes Cas9. (E) Impact of tiling sgRNAs along the length of the gusA gene on GusA activity. Plot of GusA activity (left) in control strains expressing dCas9 without an sgRNA and in the absence or presence of 1 mM pNPG. Plot of GusA activity (right) in dCas9-sgRNA strains for 74 individual sgRNAs targeted to the upstream or coding region of GusA on either the template (orange circles) or non-template (purple diamonds) strand. sgRNAs 349, 373, 451 and 980 used in later experiments are indicated. (F) Schematic of sgRNA multi-array to express sgRNA349, sgRNA451, sgRNA373 and sgRNA980. Right-facing coloured arrows represent different promoters for each sgRNA. H, sgRNA handle sequence; T, sgRNA terminator sequence. Note that promoter, handle and terminator sequences are different for each sgRNA. (G) Knockdown of E. coli GusA activity with pGreg-dCas9 and four different sgRNAs, or an array consisting of the same four sgRNAs. (H) Western blot of dCas9 and GusA expression in pGreg-dCas9 strains without (NG) or with the indicated sgRNAs. Uncropped images for gel images in panels (C), (D) and (H) are in Supplementary Figures S3, S4 and S5, respectively. For panels (E) and (G) data points are mean values from three biological replicates with whiskers indicating the mean plus or minus the standard deviation. *P < 0.05 calculated by Welch’s t-test.
Figure 3.
Figure 3.
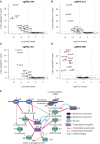
RNAseq analysis of global gene expression changes in E. coli strains expressing dCas9 and sgRNAs. (AD) Volcano plots of fold changes in gene expression for the indicated sgRNAs. Each point represents a different E. coli gene. Grey points have less than 4-fold gene expression change (vertical dashed lines) and are judged not significant (horizontal dashed line, FDR = 1 ×10⁻³). Red points have >4-fold change in expression and are significant. (E) Schematic of glucuronide metabolism in E. coli (adapted from (65)). The arithmetic mean fold-change in gene expression for all four sgRNAs is indicated beside each protein.
Figure 4.
Figure 4.
GusR-regulated dCas9 expression. (A) Top, schematic of regulatory regions of the pGreg-GusR-dCas9 constructs. pGreg-GusR-dCas9.0 represents the original construct. Highlighted are the sequences of the regulatory regions of each construct, including −35 and −10 promoter elements, ribosome-binding sites (RBS), and GusR start codons. At botton is a schematic of the plasmid (not to scale) with right-facing rectangles representing genes and right-facing arrows representing promoters. The rectangles represent GusR O1 and O2 sites upstream of the pGusA promoter that regulates dCas9 expression. (B) GusA activity assays with different pGreg-GusR-dCas9 constructs without an sgRNA (NG) or with one of four different sgRNAs (349, 373, 461, 980). (C) Western blots of E. coli cell extracts with indicated antibody on the left. The different lanes indicate plasmids coexpressing (+) or not coexpressing (−) sgRNA349. (D) Western blot of dCas9 and GusA expression in E. coli with the parental pGreg-GusR-dCas9.7 plasmid or the OpΔ plasmid grown in media supplemented with either glucose or pNPG. (E) Schematic for measuring SN-38G processing by E. coli cell extracts harbouring the indicated plasmids. (F) Plot of SN-38G utilization by E. coli cells extracts with the indicated plasmids. The plot is time (mins) versus fluorescence at 420 nm. (G) Rate of SN-38G hydrolysis for the indicated cell extracts calculated using the data shown in panel (E). Uncropped images for gel images in panels (C) and (D) are in Supplementary Figures S9 and S10, respectively. For panels (B), (F) and (G), data points are the mean of three biological replicates with the whiskers indicating the mean plus or minus the standard deviation. N.S. not significant, *P < 0.05, **P < 0.005 calculated by Welch’s t-test.
Figure 5.
Figure 5.
dCas9 expression with pGreg-GusR-dCas9.7 is limited to GUS-positive bacteria. (A) Strategy to examine dCas9 expression in GUS-positive or GUS-negative bacteria by conjugation of pGreg-GusR-dCas9. CmR, chloramphenicol resistance. The dap- donor strain has a knockout of the dapA gene that is used for counter selection during conjugation. (B) Western blots of dCas9 expression in exconjugants with pGreg-GusR-dCas9.7 in the indicated strains grown in liquid media supplemented with 0.2% d-glucose (Glu), 0.2% l-arabinose (Ara) or 1 mM MetGluc (MG). The Cas9+ lane is 5 ng of purified Cas9. (C) As for panel (B) but with exconjugants harbouring pBAD-dCas9. (D) GusA activity assays with the indicated strains harbouring either pBAD-dCas9 (pBAD) or pGreg-GusR-dCas9.7 (pGreg) without (NG) or with sgRNA349. Open and filled circles represent data for pBAD, and open and filled triangles represent data for pGreg. (E) SN-38G processing by E. coli OBEAV1 cell extracts harbouring pGreg-GusR-dCas9 with (orange circles) or without (black circles) sgRNA349. SN-38G hydrolysis in the E. coli ΔgusA strain is plotted for comparison. (F) Plot of SN-38G hydrolysis for the indicated cell extracts calculated using the data shown in panel (D). For panels (D), (E) and (F), data points are the mean of three biological replicates with the whiskers indicating the mean plus or minus the standard deviation. N.S. not significant, *P < 0.05, **P < 0.005 calculated by Welch’s t-test. Uncropped gel images in panels (B) and (C) are in Supplementary Figures S11 and S12, respectively, and uncropped gel images of the native microbiome species (to ensure no cross-reactivity occurred with the anti-Cas9 antibody) are in Supplementary Figure S13.
Figure 6.
Figure 6.
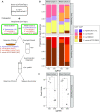
Repression of GusA in mixed cultures. (A) Strategy to examine repression of GusA in mixed cultures of bacteria by conjugation of pGreg-GusR-dCas9.7. CmR, chloramphenicol resistance; GmR, gentamycin resistance; KanR, kanamycin resistance; AmpR, ampicillin resistance; TetR, tetracycline resistance. (B) Mean proportions from three biological replicates of each species in the mixed cultures calculated from CFU/ml following conjugation of pGreg-GusR-dCas9.7 (pGreg) without (NG) or with sgRNA349. Aliquots of cultures post-conjugation (top panels) and after the induced outgrowth with pNPG (bottom panels) were spot-plated on the indicated resistance plates with and without chloramphenicol to count total recipients and exconjugants, respectively, of each species. Cultures were also plated with gentamycin and DAP to confirm donors had not survived. (C) GusA activity units from mixed cultures following conjugation of pGreg-GusR-dCas9.7 (pGreg) without (NG, open triangles) or with sgRNA349 (filled triangles). Data points from three biological replicates are shown. *P < 0.5 calculated by Welch's t-test.

References

    1. Vigouroux A., Bikard D.. CRISPR tools to control gene expression in bacteria. Microbiol. Mol. Biol. Rev. 2020; 84:e00077-19. - PMC - PubMed
    1. Adli M. The CRISPR tool kit for genome editing and beyond. Nat. Commun. 2018; 9:1911. - PMC - PubMed
    1. Knott G.J., Doudna J.A.. CRISPR-Cas guides the future of genetic engineering. Science. 2018; 361:866–869. - PMC - PubMed
    1. Hamilton T.A., Pellegrino G.M., Therrien J.A., Ham D.T., Bartlett P.C., Karas B.J., Gloor G.B., Edgell D.R.. Efficient inter-species conjugative transfer of a CRISPR nuclease for targeted bacterial killing. Nat. Commun. 2019; 10:4544. - PMC - PubMed
    1. Citorik R.J., Mimee M., Lu T.K.. Sequence-specific antimicrobials using efficiently delivered RNA-guided nucleases. Nat. Biotech. 2014; 32:1141–1145. - PMC - PubMed

Publication types

LinkOut - more resources