. 2023 Jan 11:12:e79363.
doi: 10.7554/eLife.79363.

Uncovering perturbations in human hematopoiesis associated with healthy aging and myeloid malignancies at single-cell resolution

Affiliations

Uncovering perturbations in human hematopoiesis associated with healthy aging and myeloid malignancies at single-cell resolution

Marina Ainciburu et al. Elife. .

Abstract

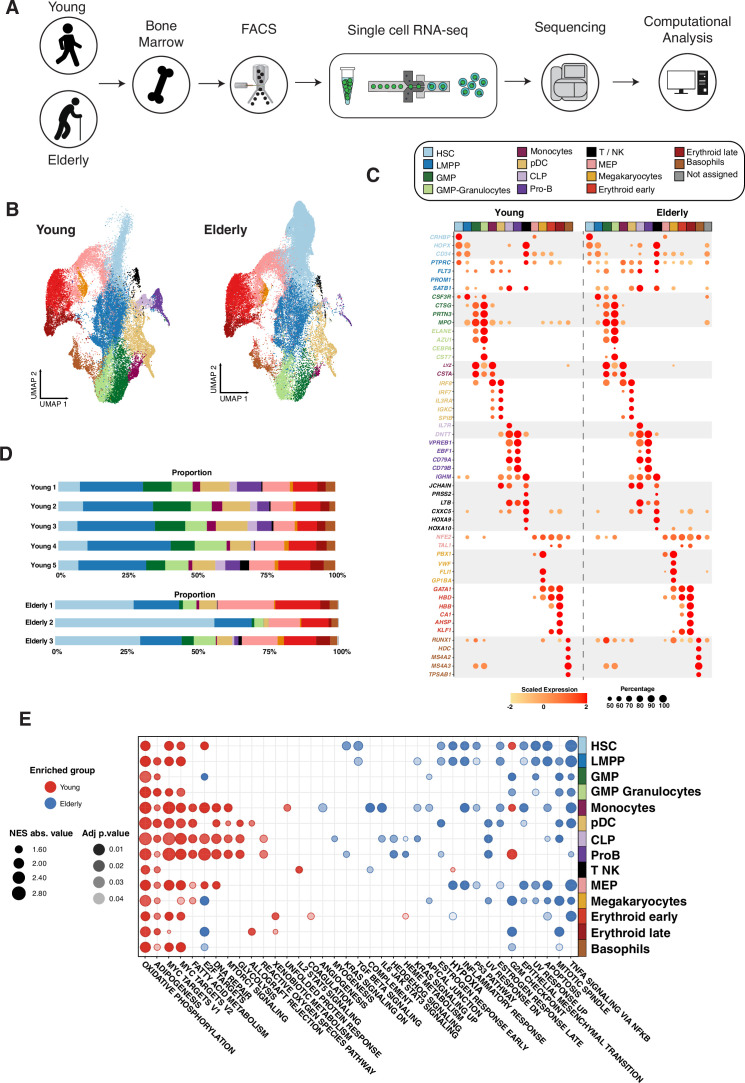
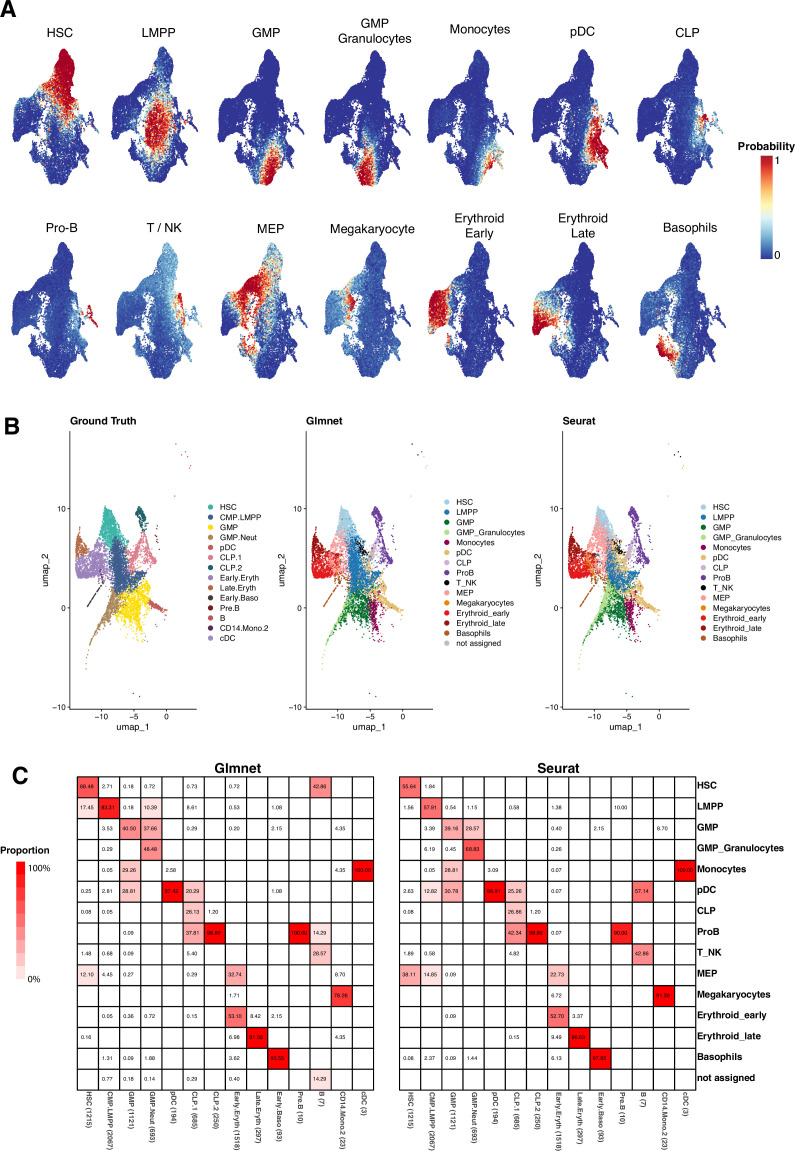
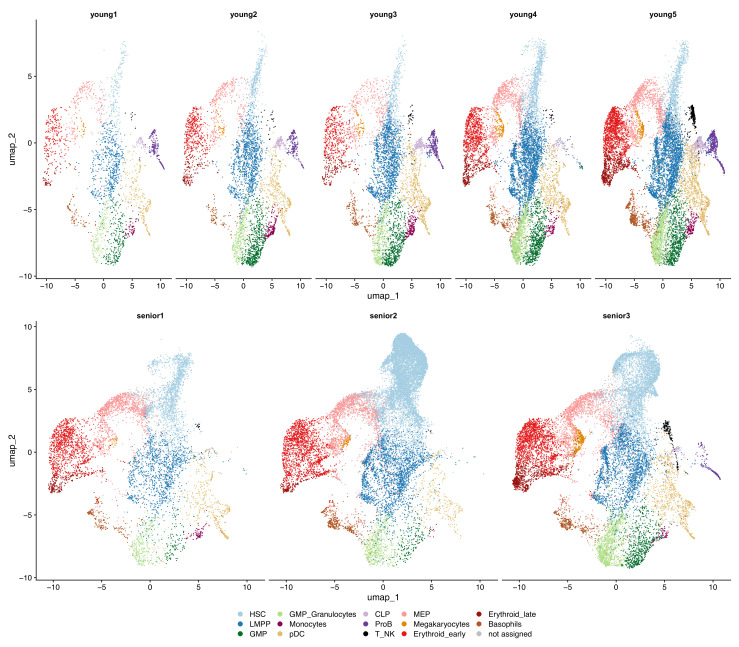
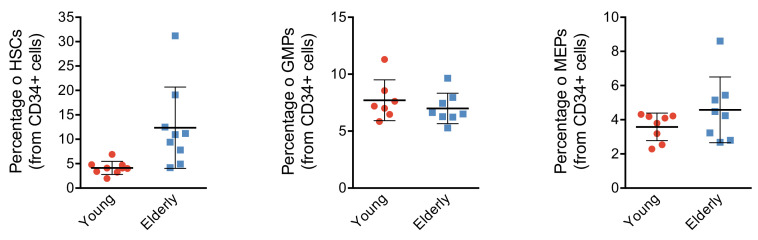
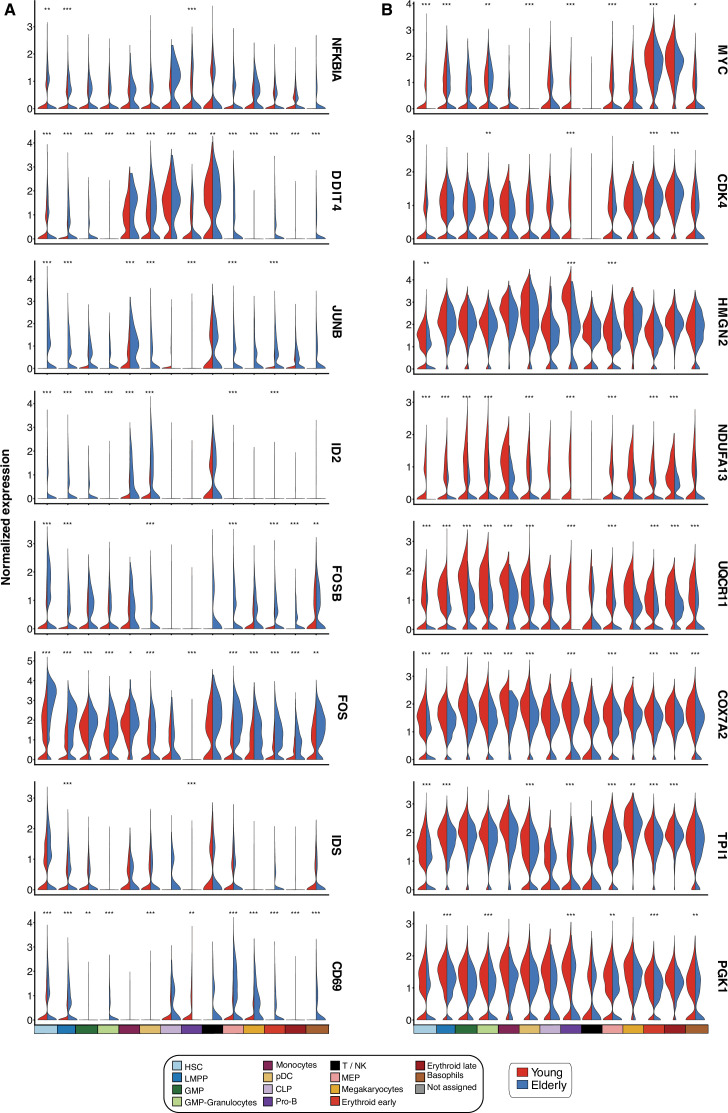
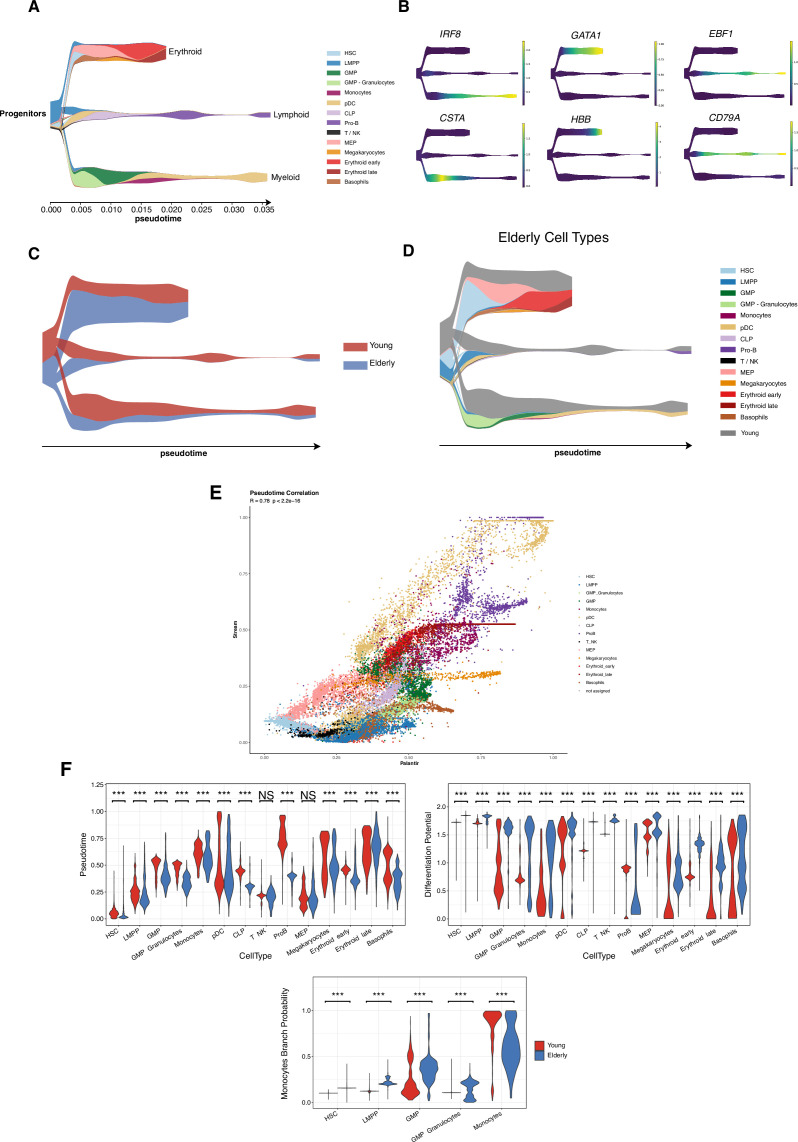
Early hematopoiesis is a continuous process in which hematopoietic stem and progenitor cells (HSPCs) gradually differentiate toward specific lineages. Aging and myeloid malignant transformation are characterized by changes in the composition and regulation of HSPCs. In this study, we used single-cell RNA sequencing (scRNA-seq) to characterize an enriched population of human HSPCs obtained from young and elderly healthy individuals.

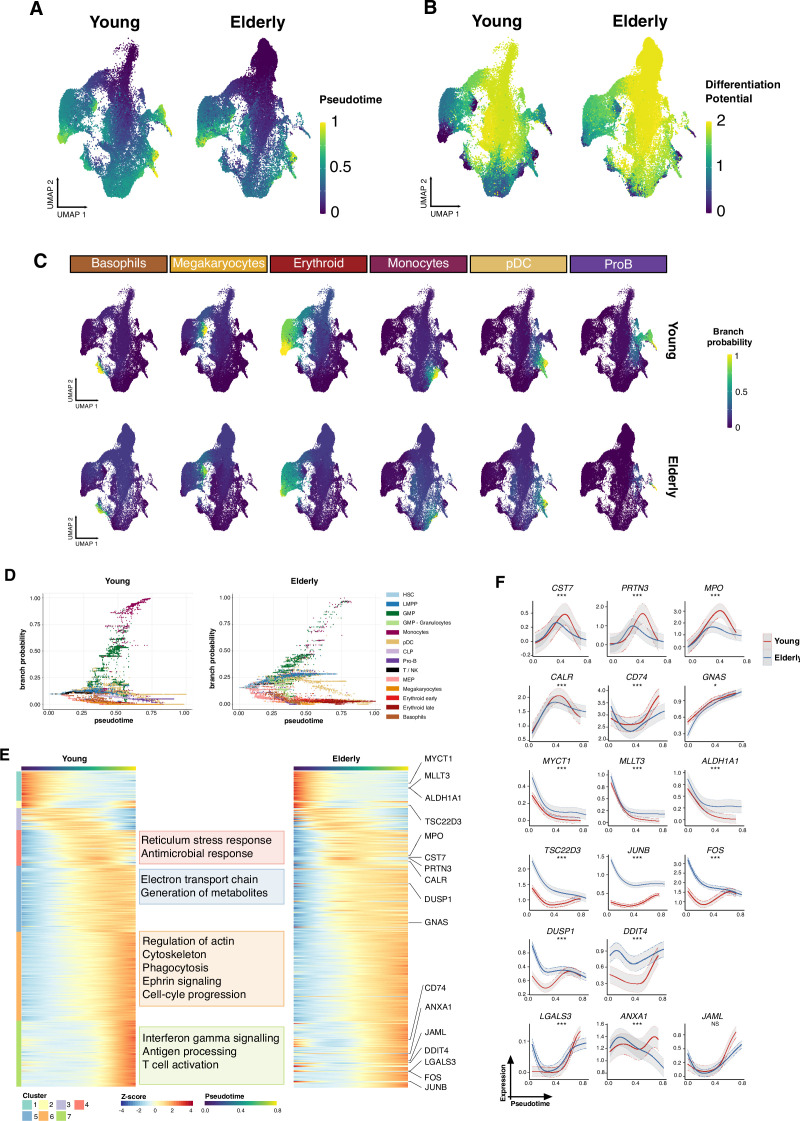
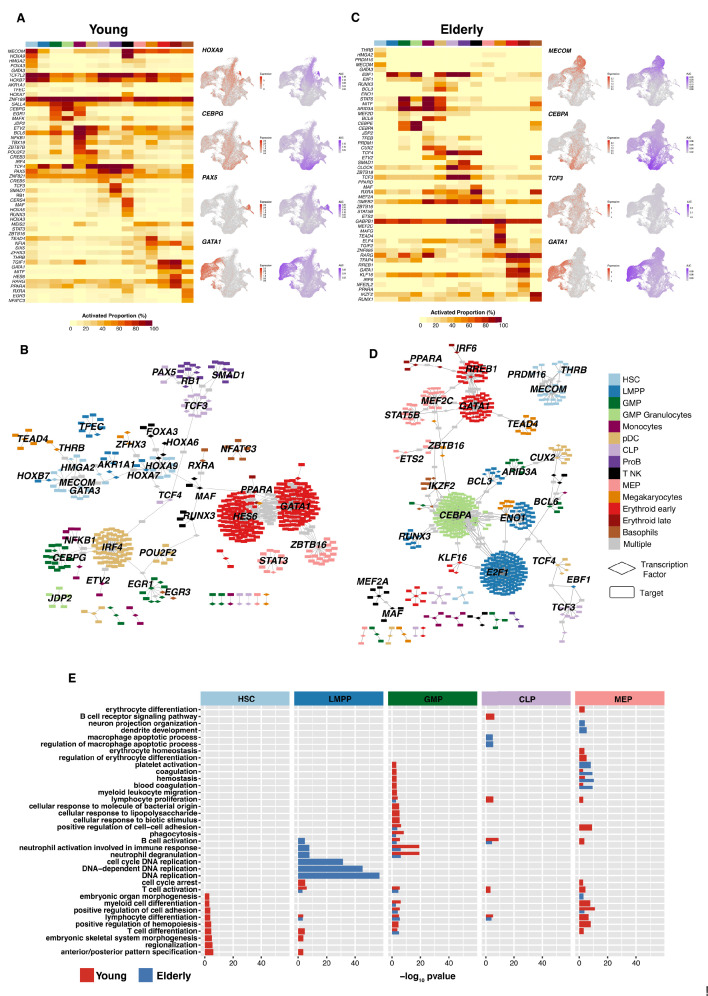
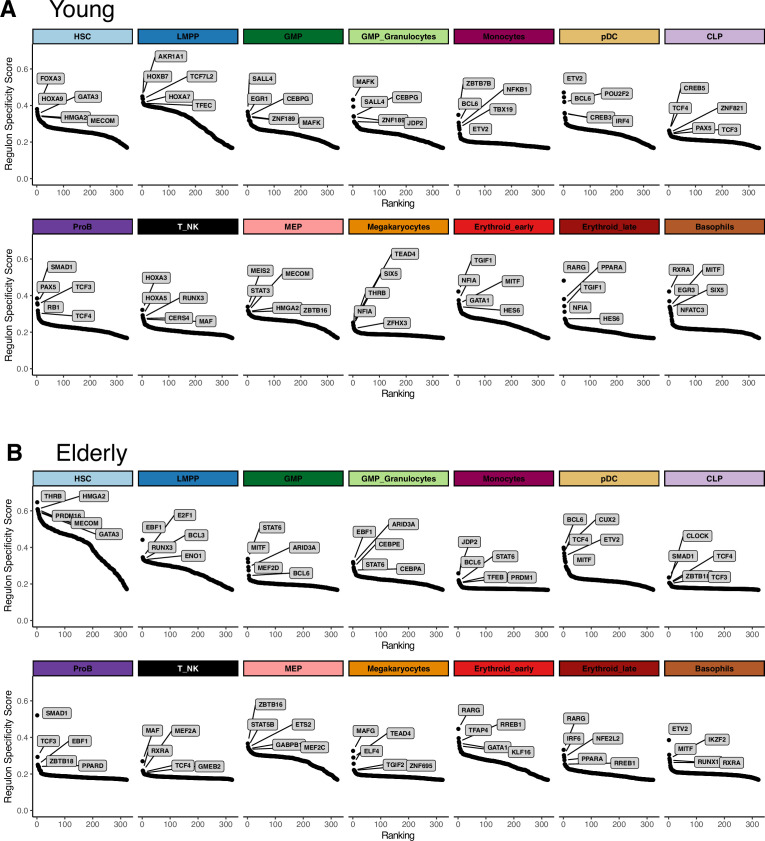
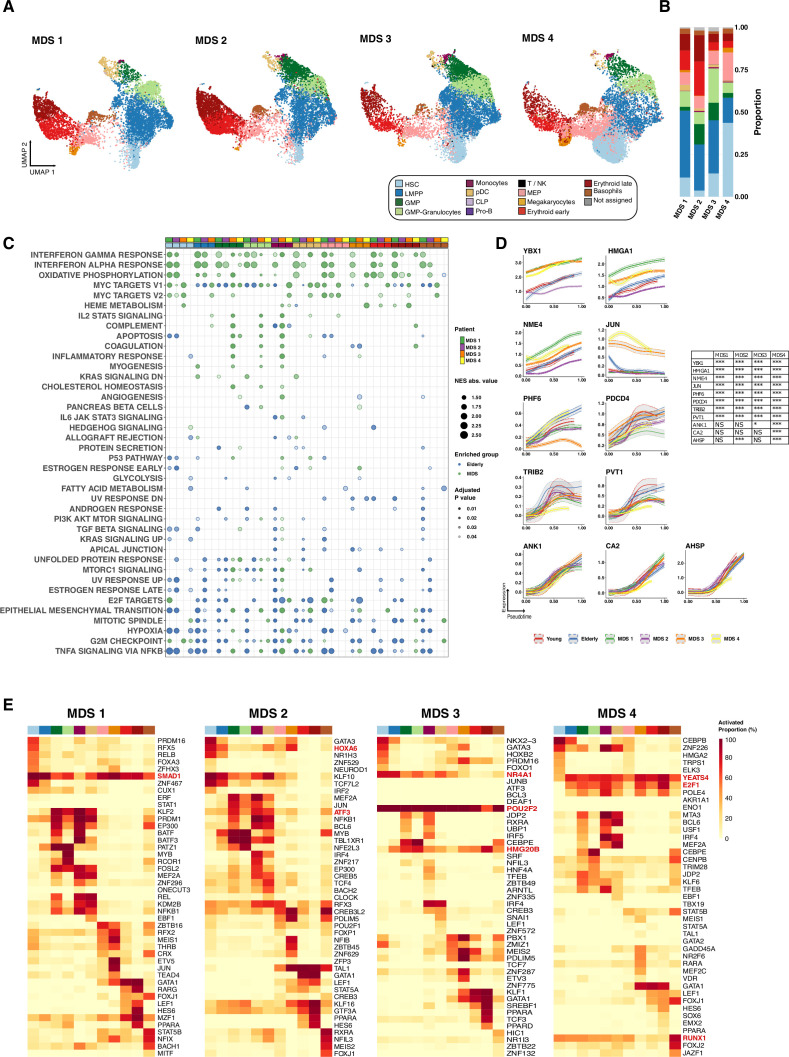
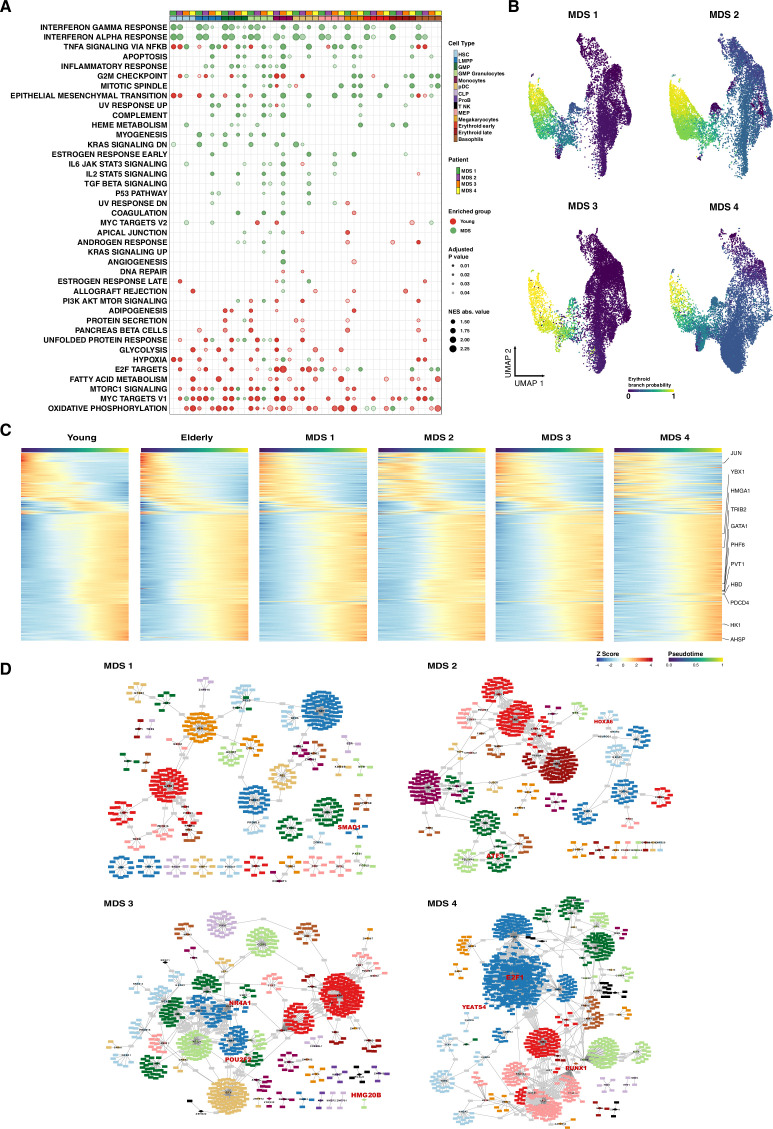
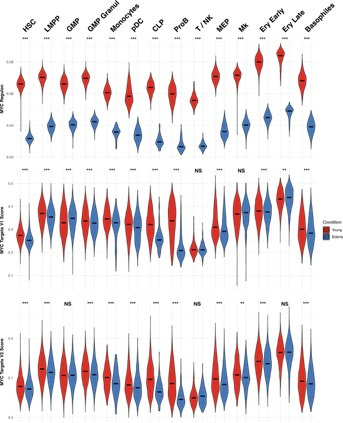
Based on their transcriptional profile, we identified changes in the proportions of progenitor compartments during aging, and differences in their functionality, as evidenced by gene set enrichment analysis. Trajectory inference revealed that altered gene expression dynamics accompanied cell differentiation, which could explain aging-associated changes in hematopoiesis. Next, we focused on key regulators of transcription by constructing gene regulatory networks (GRNs) and detected regulons that were specifically active in elderly individuals. Using previous findings in healthy cells as a reference, we analyzed scRNA-seq data obtained from patients with myelodysplastic syndrome (MDS) and detected specific alterations of the expression dynamics of genes involved in erythroid differentiation in all patients with MDS such as TRIB2. In addition, the comparison between transcriptional programs and GRNs regulating normal HSPCs and MDS HSPCs allowed identification of regulons that were specifically active in MDS cases such as SMAD1, HOXA6, POU2F2, and RUNX1 suggesting a role of these transcription factors (TFs) in the pathogenesis of the disease.

In summary, we demonstrate that the combination of single-cell technologies with computational analysis tools enable the study of a variety of cellular mechanisms involved in complex biological systems such as early hematopoiesis and can be used to dissect perturbed differentiation trajectories associated with perturbations such as aging and malignant transformation. Furthermore, the identification of abnormal regulatory mechanisms associated with myeloid malignancies could be exploited for personalized therapeutic approaches in individual patients.

Keywords: aging; computational biology; genetics; genomics; hematopoietic stem; human; myelodysplastic syndrome; progenitor cells; single-cell RNA sequencing; systems biology.

Plain language summary

Our blood contains many different types of cells; red blood cells carry oxygen through the body, platelets help to stop bleeding and a variety of white blood cells fight infections. All of these critical components come from a pool of immature cells in bone marrow, which can develop and specialise into any of these. However, as we get older, these immature cells can accumulate damage, including mutations in specific genes. This increases the risk of diseases such as myelodysplastic syndromes (MDS), a type of cancer in which the cells cannot develop and the patient does not have enough healthy mature blood cells. The changes in gene activity in the immature cells have previously been studied using samples from young and elderly people, as well as individuals with MDS. These studies examined large numbers of cells together, revealing differences between young and elderly people, and individuals with MDS. However, this does not describe how the different types alter their behaviour. To address this, Ainciburu, Ezponda et al. used a technique called single-cell RNA sequencing to study the gene activity in individual immature blood cells. This revealed changes associated with maturation that may account for the different combinations of cell populations in younger and older people. The results confirmed findings from previous studies and suggested new genes involved in ageing or MDS. Ainciburu, Ezponda et al. used these results to create an analytical system that highlights gene activity differences in individual MDS patients that are independent of age-related changes. These results provide new insights that could help further research into the development of MDS and the ageing process. In addition, scientists could study other diseases using this approach of analysing individual patients’ gene activity. In future, this could help to personalise clinical decisions on diagnosis and treatment.


Conflict of interest statement

MA, TE, NB, AA, AV, PS, DA, JL, MS, TJ, FL, SM, FS, AM, JM, GS, AD, ML, DG, MD, DV, MH, FP No competing interests declared, JR Employed by 10x Genomics since February 2021; this employment had no bearing on this work

Figures

Figure 1.
Figure 1.. Transcriptional profiling of CD34+ cells from young and elderly healthy donors.
(A) CD34+ cells were obtained from bone marrow aspirates of young (n=5) and elderly (n=3) donors and subjected to single-cell RNA sequencing. (B) UMAP plot with young cells colored according to unsupervised clustering results (left) and elderly cells labeled using an in-house cell classifier (right). (C) Dot plot of cluster markers (adjusted p-value <0.05) for the different cellular subpopulations identified. Dot size represents the percentage of cells that express each marker, and color represents scaled expression values. (D) Bar plots showing the proportion of cells assigned to each cellular subpopulation for each donor independently. (E) Dot plot of enriched terms after performing gene set enrichment analysis (GSEA) for each identified cluster. Dot color represents the enriched group, size indicates the NES absolute value, and transparency indicates the adjusted p-value.
Figure 1—figure supplement 1.
Figure 1—figure supplement 1.. Evaluation of GLMnet classification method.
(A) UMAP plots of the three elderly donors’ cells. They are colored by the probability of belonging to a specific identity, as computed on each of the binary classification models. (B) CD34+ cells from Granja et al. data. (Left) Cells are colored by the original classification. (Middle) Colored as the result of the GLMnet classification, using young donor data and identities as reference. (Right) Colored according to the predicted cellular identities using Seurat. (C) Heatmap showing the proportion of cells predicted within each of the ground truth groups. The sum per column equals to 100%.
Figure 1—figure supplement 2.
Figure 1—figure supplement 2.. Classification of CD34+ cells in individual young and elderly donors.
UMAP plots with cells colored by cellular subpopulation, separated by donor. (Top) Cells from young donors labeled by unsupervised clustering and manual labeling (bottom) cells from elderly donors classified with GLMnet.
Figure 1—figure supplement 3.
Figure 1—figure supplement 3.. CD34+ progenitor proportions by flow activated cell sorting (FACS).
Plot depicting the percentage of hematopoietic stem cells (HSCs), granulocyte-monocyte progenitors (GMPs), and megakaryocyte-erythroid progenitors (MEPs) from total CD34+ subpopulation detected in healthy young and elderly individuals. Each point represents an individual and the mean ± standard deviation (SD) is shown for each group. **p-Value from t test <0.01.
Figure 1—figure supplement 4.
Figure 1—figure supplement 4.. Differentially expressed genes upon aging.
Violin plots showing normalized expression of genes involved in differentially enriched pathways. Expression levels are divided by cell subpopulation and age (young cells colored in red and elderly cells in blue). (A) Genes upregulated in elderly subpopulations. (B) Genes upregulated in young subpopulations. *Adjusted p-value <0.05, **adjusted p-value <0.01, ***adjusted p-value <0.001.
Figure 2.
Figure 2.. Trajectory inference of the hematopoietic lineages at single-cell resolution.
(A) UMAP plots showing the results from applying Palantir algorithm to young and elderly cells. For both datasets, a hematopoietic stem cell (HSC) was established as initial state, based on UMAP coordinates. Final states were only indicated for the elderly dataset, as the UMAP nearest neighbors to the six young final points. Cells are colored by pseudotime and (B) differentiation potential. (C) Branch probabilities for each of the six differentiation paths retrieved. (D) Scatter plot of pseudotime vs. branch probabilities for the monocytic trajectory obtained using Palantir for young and elderly donors. Color represents the cellular subpopulation. (E) Heatmap of gene expression trends for dynamic genes along the monocytic trajectory in young and elderly donors. The columns are arranged according to pseudotime values, and the rows are grouped according to gene clustering results. A summary of enriched terms for the gene clusters in young donors is shown. (F) Expression trends in the comparison of young and elderly cells regarding the different genes involved in the monocytic trajectory (NS = not significant, *adjusted p-value <0.05, **adjusted p-value <0.01, ***adjusted p-value <0.001).
Figure 2—figure supplement 1.
Figure 2—figure supplement 1.. Trajectory inference with STREAM reveals the main hematopoietic differentiation branches.
(A) STREAM plot obtained using cells from young healthy donors. Color denotes cellular subpopulations. The x-axis displays inferred pseudotime values. (B) Expression of known cell-type markers for the different hematopoietic lineages projected in the STREAM plot. Color represents normalized expression values. (C) STREAM plot of elderly differentiation trajectories projected in the young reference. Color indicates the proportion of cells belonging to each condition under study. (D) STREAM plot of elderly differentiation trajectories projected in the young reference. Color represents the cell-type identity (gray color represents the proportion of young cells). (E) Scatter plot of recovered pseudotime values with Palantir (x-axis) and Stream (y-axis) points are colored by cell type. (F) Violin plots colored by condition and representing the pseudotime and differentiation potential per cell type. (Bottom) Branch probability for the differentiation route from hematopoietic stem cells (HSCs) to monocytes. Wilcoxon two-sample test, *adjusted p-value <0.05, **adjusted p-value <0.01, ***adjusted p-value <0.001, NS = non-significant.
Figure 3.
Figure 3.. Gene regulatory network reconstruction of hematopoietic cellular populations.
(A) (Left) Heatmap showing the proportion of cells per cluster that have an activated state for different regulons in young cells. (Right) UMAP plots with normalized expression and AUC values for specific transcription factors. (B) Gene regulatory network of the identified regulons for the hematopoietic system in young donors. Regulons were trimmed to include only targets with an importance score higher than the third quartile in each regulon. Node shape denotes gene-type identity, and color denotes cell population. Any target that can be assigned to multiple transcription factors is colored in gray. (C) (Left) Heatmap showing the proportion of cells per cluster that have an activated state for different regulons in elderly cells. (Right) UMAP plots with normalized expression and AUC values for specific transcription factors. (D) Gene regulatory network of the identified regulons for the hematopoietic system in elderly donors. Regulons were trimmed to include only the targets with an importance score higher than the third quantile in each regulon. Node shape denotes gene-type identity, and color denotes cell population. Any target that can be assigned to multiple transcription factors is colored in gray. (E) Bar plot with enriched gene ontology categories after over-representation analysis. Categories are grouped per cell type, and color denotes the enriched group. Bar length represents statistical significance of the enrichment, as -log10 p-value.
Figure 3—figure supplement 1.
Figure 3—figure supplement 1.. Extraction of cell subpopulation-specific regulons from gene regulatory networks.
Regulons ranked by their specificity score (RSS), computed with pyscenic for each subpopulation. Names for the top five regulons with the most specific activity per subpopulation are shown. (A) Young regulons. (B) Elderly regulons.
Figure 4.
Figure 4.. Computational analysis of pathological conditions, including myelodysplastic syndromes (MDS) and acute myeloid leukemia.
(A) UMAP plot of CD34+ cells from MDS (n=4). Cells are colored according to identity, as assessed using a previously described cell-type classification method. (B) Bar plots showing the proportion of cells assigned to each cellular subpopulation for each donor independently. Color denotes the cellular subpopulation. (C) Gene set enrichment analysis (GSEA) results after performing differential expression between MDS and elderly donors. Dot color represents enrichment direction, transparency the statistical significance, and size NES absolute value. (D) Expression trends in the comparison of healthy and pathological cells regarding the different genes involved in the erythroid trajectory (NS = not significant, *adjusted p-value <0.05, **adjusted p-value <0.01, ***adjusted p-value <0.001). (E) Heatmap showing the proportion of cells per cluster that had an activated state for different regulons in the four samples of patients with MDS among AML cells.
Figure 4—figure supplement 1.
Figure 4—figure supplement 1.. Computational analysis of pathological samples.
(A) Gene set enrichment analysis (GSEA) results after performing differential expression between MDS and young donors. Dot color represents enrichment direction, transparency the statistical significance, and size NES absolute value. (B) UMAP with cells colored by Palantir probabilities for the erythroid trajectory. (C) Heatmap of gene expression trends for dynamic genes along the erythroid trajectory in young, elderly, and MDS donors. (D) Gene regulatory network of the identified regulons for MDS donors. Regulons were trimmed to include only the targets with an importance score higher than the third quantile in each regulon. Node shape denotes gene-type identity, and color denotes cell population. Any target that can be assigned to multiple transcription factors is colored in gray. Important genes are labeled in red.
Author response image 1.
Author response image 1.. MYC activity in HSPC from young and elderly donors.
Violin plots showing the activity of MYC regulon obtained with SCENIC (top), and the expression of MYC target gene sets V1 (middle) and V2 (botton), summarized in a score calculated with AUCell.
Author response image 2.
Author response image 2.. Seurat classification scores.
Box-plot describing the distribution of seurat scores of cells classified as MEPs by Seurat and HSCs by GLMnet.
Author response image 3.
Author response image 3.. Expression of marker genes in the HSC compartment.
Dot plot depicting the normalized scaled expression of canonical marker genes by HSC of the 5 young and 3 elderly healthy donors. Marker genes are colored by the cell population they characterize. Dot color represents expression levels, and dot size represents the percentage of cells that express a gene.
Author response image 4.
Author response image 4.. HSC sub clustering.
(A) UMAP visualization of HSC from young (left) and elderly (right) donors subjected to re-integration and unsupervised clustering. Cells are colored by clusters. (B) Bar plot showing the proportion of cells from each donor assigned to the different clusters. (C) UMAP plots for young (left) and elderly (right) HSC colored by the normalized expression of CDK6 (top left) and by the summarized expression of multiple gene signatures, quantified as scores calculated using the software AUCell.
Author response image 5.
Author response image 5.. Activity of HSC-specific regulons.
Violin plots showing activity scores for the top 5 HSC-specific regulons generated by SCENIC in HSC from both young (left) and elderly (right) donors, separated by sub-clusters. Color indicates sub-cluster.

References

    1. Abdelaal T, Michielsen L, Cats D, Hoogduin D, Mei H, Reinders MJT, Mahfouz A. A comparison of automatic cell identification methods for single-cell RNA sequencing data. Genome Biology. 2019;20:194. doi: 10.1186/s13059-019-1795-z. - DOI - PMC - PubMed
    1. Aibar S, González-Blas CB, Moerman T, Huynh-Thu VA, Imrichova H, Hulselmans G, Rambow F, Marine J-C, Geurts P, Aerts J, van den Oord J, Atak ZK, Wouters J, Aerts S. Scenic: single-cell regulatory network inference and clustering. Nature Methods. 2017;14:1083–1086. doi: 10.1038/nmeth.4463. - DOI - PMC - PubMed
    1. Ashton TM, McKenna WG, Kunz-Schughart LA, Higgins GS. Oxidative phosphorylation as an emerging target in cancer therapy. Clinical Cancer Research. 2018;24:2482–2490. doi: 10.1158/1078-0432.CCR-17-3070. - DOI - PubMed
    1. Beerman I, Seita J, Inlay MA, Weissman IL, Rossi DJ. Quiescent hematopoietic stem cells accumulate DNA damage during aging that is repaired upon entry into cell cycle. Cell Stem Cell. 2014;15:37–50. doi: 10.1016/j.stem.2014.04.016. - DOI - PMC - PubMed
    1. Bhullar J, Sollars VE. Ybx1 expression and function in early hematopoiesis and leukemic cells. Immunogenetics. 2011;63:337–350. doi: 10.1007/s00251-011-0517-9. - DOI - PubMed

Publication types

Substances

Associated data