. 2023 Feb 6;18(1):nsac063.
doi: 10.1093/scan/nsac063.

Fear in the mind's eye: the neural correlates of differential fear acquisition to imagined conditioned stimuli

Affiliations

Fear in the mind's eye: the neural correlates of differential fear acquisition to imagined conditioned stimuli

Lauryn Burleigh et al. Soc Cogn Affect Neurosci. .

Abstract

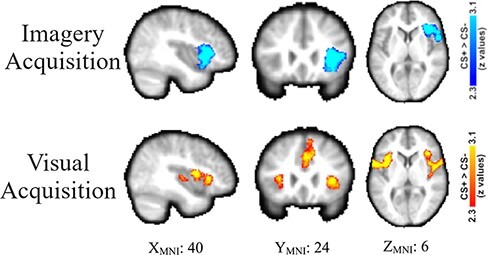
Mental imagery is involved in both the expression and treatment of fear-related disorders such as anxiety and post-traumatic stress disorder. However, the neural correlates associated with the acquisition and generalization of differential fear conditioning to imagined conditioned stimuli are relatively unknown. In this study, healthy human participants (n = 27) acquired differential fear conditioning to imagined conditioned stimuli paired with a physical unconditioned stimulus (i.e. mild shock), as measured via self-reported fear, the skin conductance response and significant right anterior insula (aIn) activation. Multivoxel pattern analysis cross-classification also demonstrated that the pattern of activity in the right aIn during imagery acquisition was quantifiably similar to the pattern produced by standard visual acquisition. Additionally, mental imagery was associated with significant differential fear generalization. Fear conditioning acquired to imagined stimuli generalized to viewing those same stimuli as measured with self-reported fear and right aIn activity, and likewise fear conditioning to visual stimuli was associated with significant generalized differential self-reported fear and right aIn activity when imagining those stimuli. Together, the study provides a novel understanding of the neural mechanisms associated with the acquisition of differential fear conditioning to imagined stimuli and that of the relationship between imagery and emotion more generally.

Keywords: emotion; fear; fear conditioning; learning; mental imagery.


Conflict of interest statement

The authors declared that they had no conflict of interest with respect to their authorship or the publication of this article.

Figures

Fig. 1.
Fig. 1.
Trial structure. Participants imagined and viewed the patches associated with each of the visual acquisition and imagery acquisition phases, respectively. Top left: a CS+ view trial during visual acquisition with 2 ms mild electrical stimulation that co-terminates with the Gabor patch. Bottom left: a CS− view trial during visual acquisition. Top right: a CS+ imagine trial during imagery acquisition with 2 ms mild electrical stimulation that co-terminates with the 4 s imagery epoch. Bottom right: a CS− imagine trial during imagery acquisition.
Fig. 2.
Fig. 2.
Self-reported fear results. Self-reported fear was collected using a seven-point Likert-style questionnaire (1, not at all; 7, very much so) for the viewing and imagining conditions during the imagery acquisition phase (left) and the visual acquisition phase (right). The size of each dot indicates how many participants chose each value. Error bars represent 95% confidence intervals. The shock symbol indicates which condition participants were fear-conditioned to in each acquisition phase. Asterisks indicate significant P-values resulting from the t-test results for each key comparison relating to the study’s primary predictions. ANOVA results and additional analyses can be found in the written results. * = P < 0.05, ** = P < 0.01, and *** = P < 0.001.
Fig. 3.
Fig. 3.
SCR results. SCR is reported on the y-axis. Each dot on the graphs represents a participant’s mean SCR for a given condition during the imagery acquisition phase (left) and the visual acquisition phase (right). Error bars represent 95% confidence interval. The shock symbol indicates which condition participants were fear-conditioned to in each acquisition phase. Asterisks indicate significant P-values resulting from the t-test results for each key comparison relating to the study’s primary predictions. ANOVA results and additional analyses can be found in the written results. * = P < 0.05, ** = P < 0.01, and *** = P < 0.001.
Fig. 4.
Fig. 4.
Functional MRI results during differential fear acquisition using small-volume correction in the right aIn ROI from Greeninget al. (2022). Top row: results from imagining the CS+ > imagining the CS− during the imagery acquisition phase reveal significant differential acquisition in the right aIn. Bottom row: Results from viewing the CS+ > viewing the CS− during the visual acquisition phase reveal significant differential acquisition in the right aIn. The significant clusters are viewed within the right aIn ROI, and the ROI voxels that were not activate above threshold are included in the figure (i.e., the green voxels).
Fig. 5.
Fig. 5.
Functional MRI results during differential fear acquisition. Top row: whole-brain results from the imagery acquisition phase when fear conditioning to an imagined stimulus CS+ > CS−. Bottom row: whole-brain results from the visual acquisition phase when fear conditioning to a visually stimulus CS+ > CS−.
Fig. 6.
Fig. 6.
Greeninget al. (2022). Top row: results from viewing the CS+ > viewing the CS− during the imagery acquisition phase reveal significant differential generalization in the right aIn. Bottom row: results from imagining the CS+ > imagining the CS− during the visual acquisition phase reveal significant differential generalization in the right aIn. The significant clusters are viewed within the right aIn ROI, and the ROI voxels that were not activate above threshold are included in the figure (i.e., the green voxels).
Fig. 7.
Fig. 7.
MVPA cross-classification results from the right aIn ROI (top row) and the bilateral anatomical amygdala mask (bottom row). The red horizontal line represents chance classification accuracy (50%), and the black dots represent the number of participants with a given classification accuracy (smaller dots n = 2; larger dots n = 4).
Fig. 8.
Fig. 8.
Top - Visual cortex ROI produced from the conjunction analysis of imagery trials from the habituation/practice runs of both the imagery acquisition phase and the visual acquisition phase. Bottom - plots of the univariate BOLD response (percent signal change) during the acquisition phase of both imagery acquisition (bottom-left) and the visual acquisition phases (bottom-right). Each dot indicates an individual participant’s BOLD response. Error bars represent 95% confidence intervals.

References

    1. Agren T., Björkstrand J., Fredrikson M. (2017). Disruption of human fear reconsolidation using imaginal and in vivo extinction. Behavioural Brain Research, 319, 9–15. - PubMed
    1. Arntz, A.,, Tiesema, M.,, Kindt, M. (2007). Treatment of PTSD: a comparison of imaginal exposure with and without imagery rescripting. Journal of Behavior Therapy and Experimental Psychiatry, 38(4), 345–70. - PubMed
    1. Bach D.R., Weiskopf N., Dolan R.J. (2011). A Stable Sparse Fear Memory Trace in Human Amygdala. Journal of Neuroscience, 31, 9383–89. - PMC - PubMed
    1. Beckmann C.F., Jenkinson M., Smith S.M. (2003). General multilevel linear modeling for group analysis in FMRI. NeuroImage, 20, 1052–63. - PubMed
    1. Burleigh L., Jiang X., Greening S.G. (2022). Fear in the theater of the mind: Differential fear conditioning with imagined stimuli. Psychological Science, 33(9), 1423–39. - PubMed

Publication types