. 2023 Feb 6;222(2):e202206095.
doi: 10.1083/jcb.202206095. Epub 2023 Jan 11.

TIMP-1 is a novel ligand of Amyloid Precursor Protein and triggers a proinflammatory phenotype in human monocytes

Affiliations

TIMP-1 is a novel ligand of Amyloid Precursor Protein and triggers a proinflammatory phenotype in human monocytes

Celina Eckfeld et al. J Cell Biol. .

Abstract

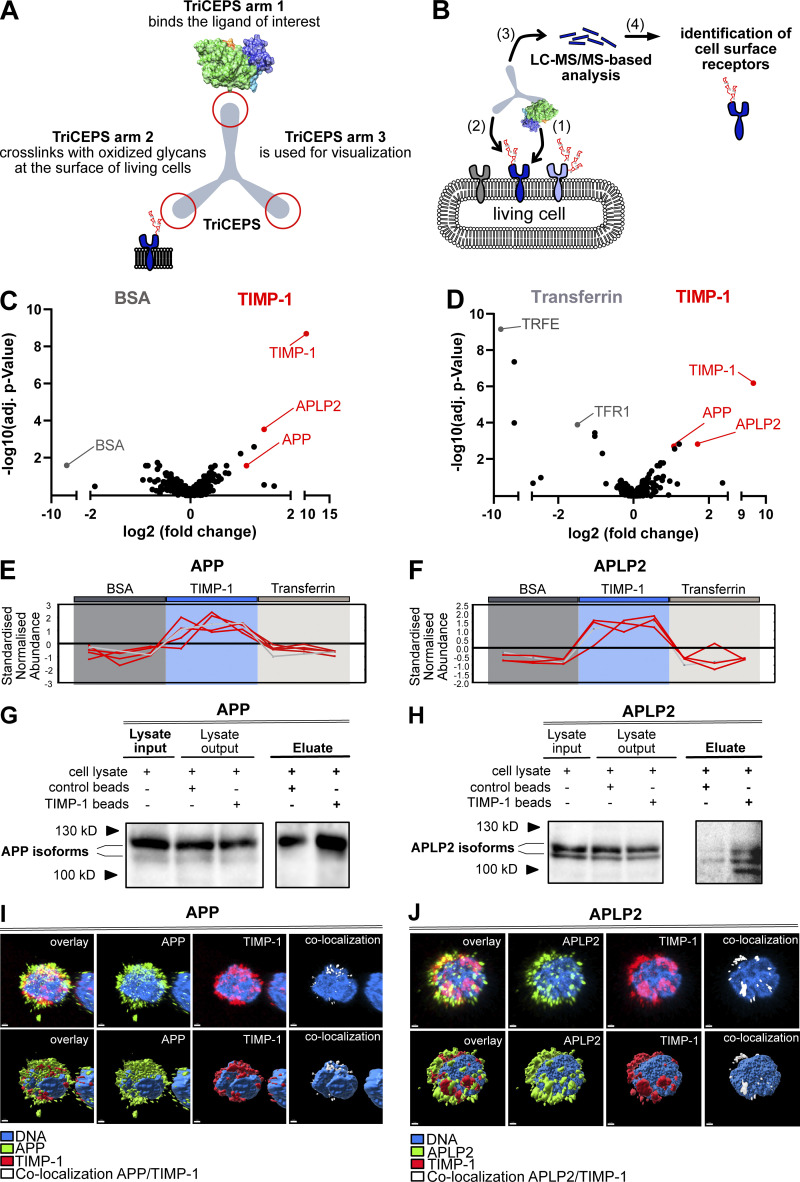
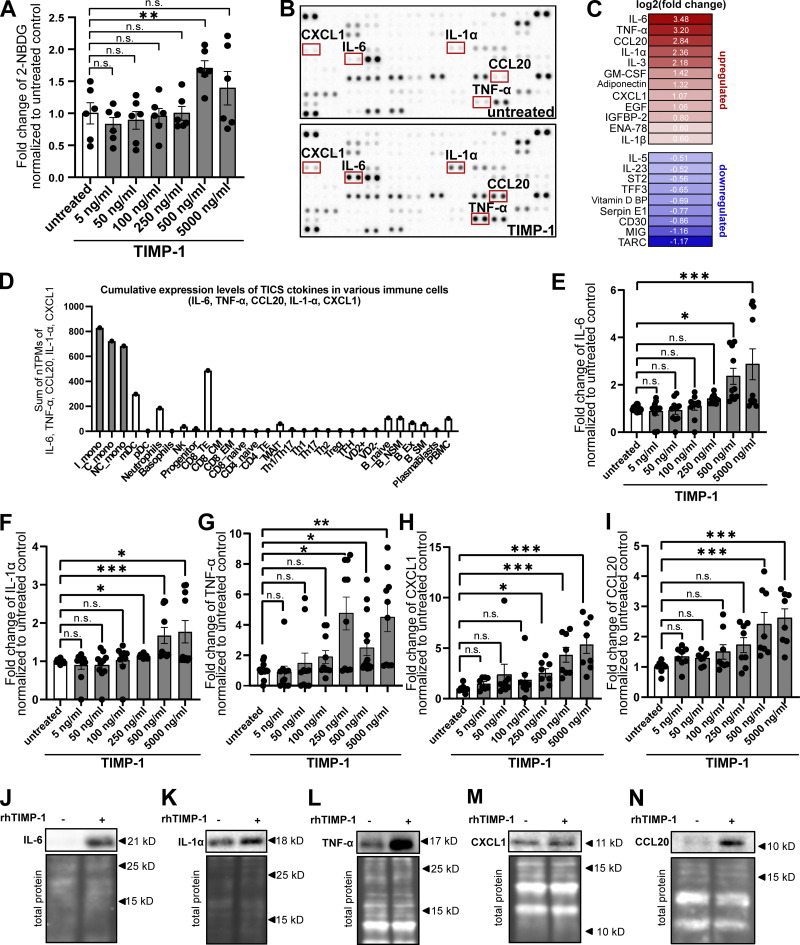
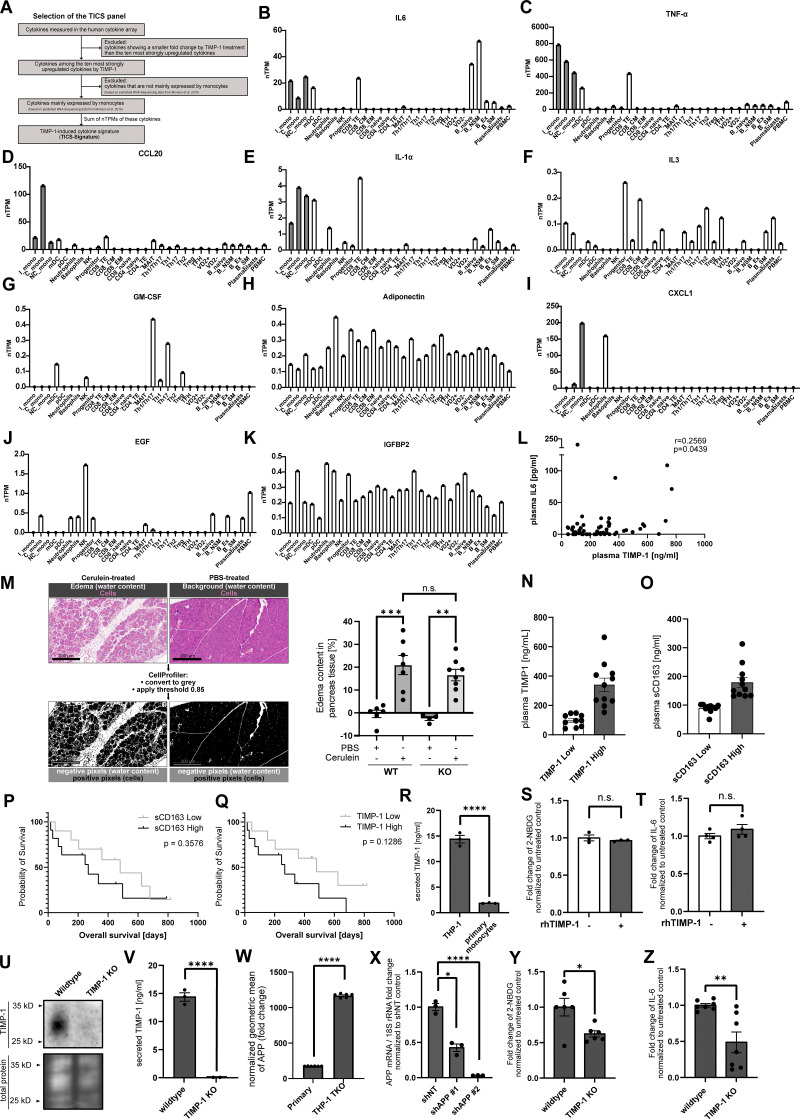
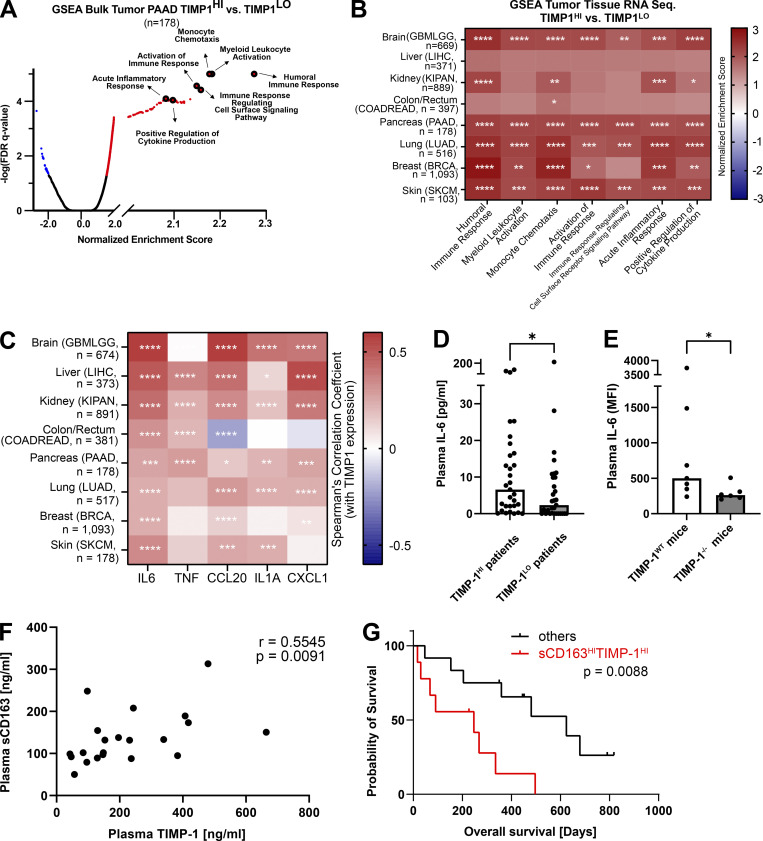
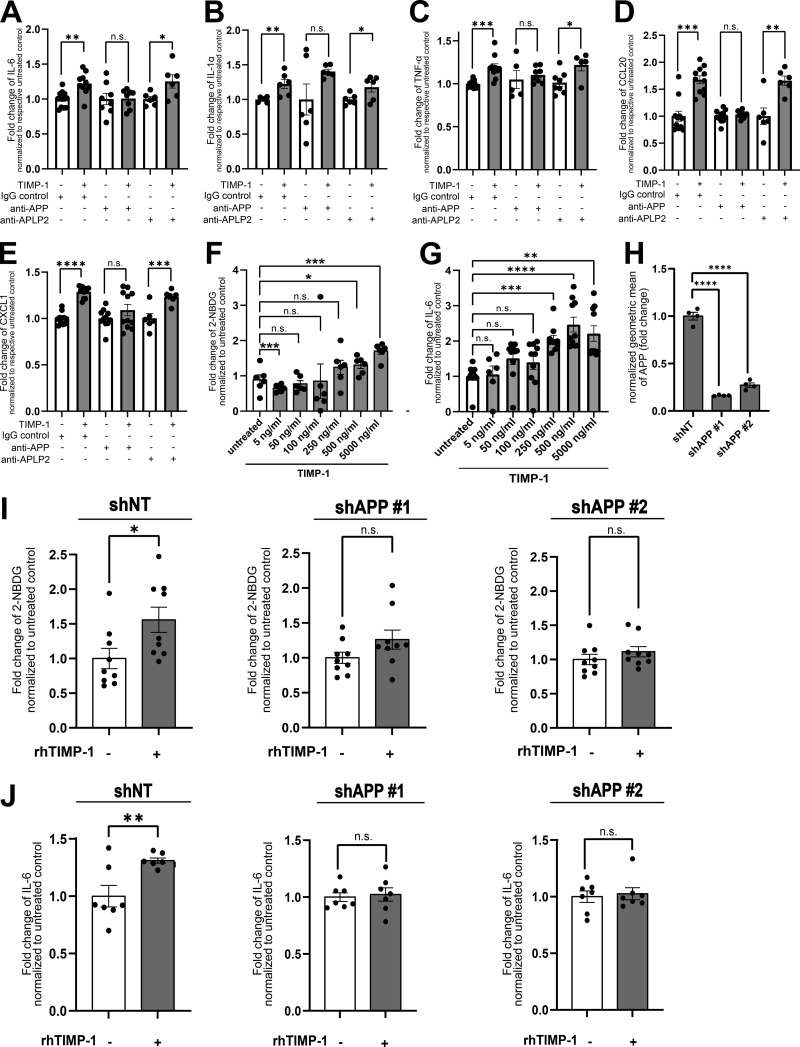
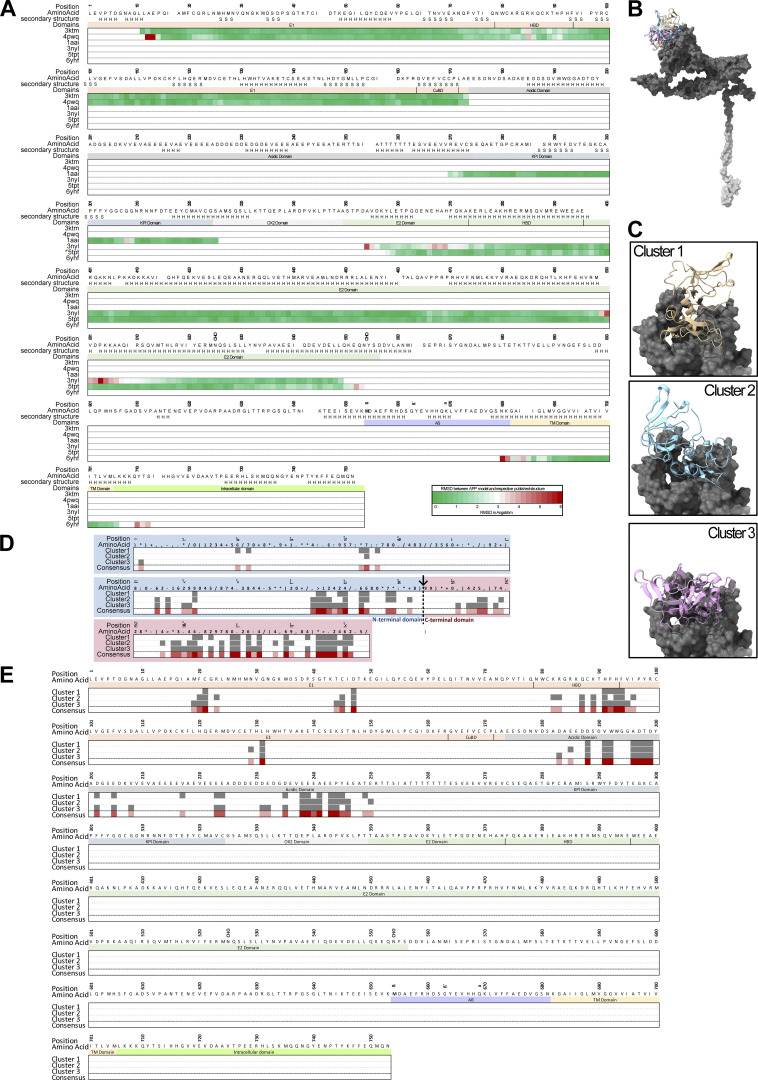
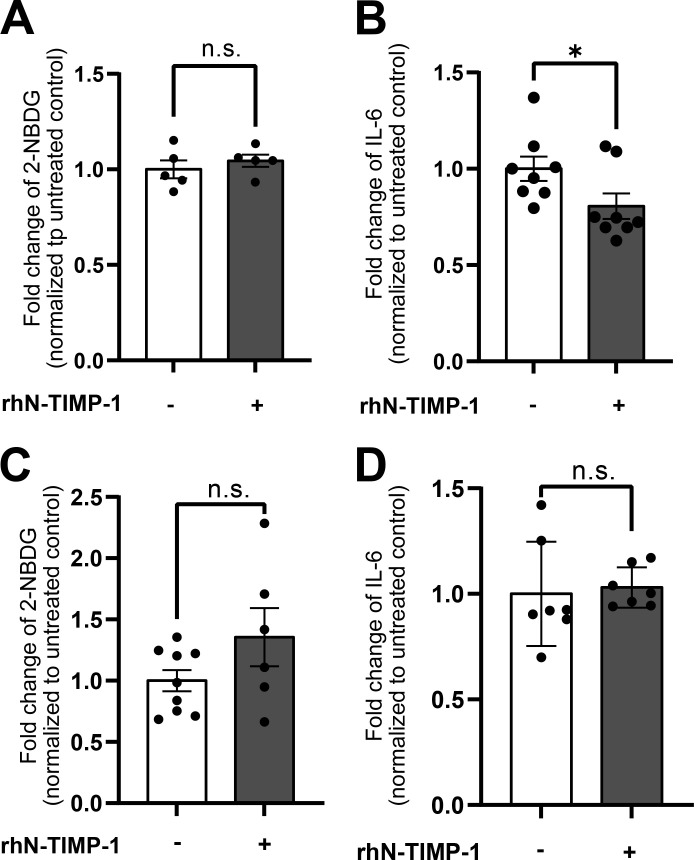
The emerging cytokine tissue inhibitor of metalloproteinases-1 (TIMP-1) correlates with the progression of inflammatory diseases, including cancer. However, the effects of TIMP-1 on immune cell activation and underlying molecular mechanisms are largely unknown. Unbiased ligand-receptor-capture-screening revealed TIMP-1-interaction with Amyloid Precursor Protein (APP) family members, namely APP and Amyloid Precursor-like Protein-2 (APLP2), which was confirmed by pull-down assays and confocal microscopy. We found that TIMP-1 triggered glucose uptake and proinflammatory cytokine expression in human monocytes. In cancer patients, TIMP-1 expression positively correlated with proinflammatory cytokine expression and processes associated with monocyte activation. In pancreatic cancer, TIMP-1 plasma levels correlated with the monocyte activation marker sCD163, and the combined use of both clinically accessible plasma proteins served as a powerful prognostic indicator. Mechanistically, TIMP-1 triggered monocyte activation by its C-terminal domain and via APP as demonstrated by in vitro interference, in silico docking, and the employment of recombinant TIMP-1 variants. Identification of TIMP-1 as a trigger of monocyte activation opens new therapeutic perspectives for inflammatory diseases.


Conflict of interest statement

Disclosures: The authors declare no competing interests exist.

Figures

Figure 1.
Figure 1.
TIMP-1 is a novel ligand of APPs. (A) Functional arms of the TriCEPS molecule. Arm 1 is conjugated to the ligand of interest by an NHS-ester bond. Arms 2 and 3 are designed to bind to oxidized glycans of ligand-bound cell-surface receptors and to capture the TriCEPs-ligand-receptor complexes, respectively. (B) Experimental procedure of an LRC-TriCEPS approach. The ligand-bound TriCEPs molecule is added to living cells (1), which were oxidized prior to treatment to facilitate binding of the TriCEPs arm 2 (2). Arm 3 is used to catch the whole TriCEPs molecule for LC-MS/MS-based analysis of interaction molecules bound by arm 2 (3). (C and D) LRC TriCEPs volcano plots depicting enriched proteins from control samples and ligand of interest (TIMP-1) samples. BSA (C) and Transferrin (D) served as two controls to ensure the technical success of the experiment and to evaluate TIMP-1 candidate receptors. As compared to positive and negative controls, TIMP-1 samples led to statistically significant enrichment of APP and APLP2. The mean ratio fold change (log2 scale, x-axis) is plotted against the P value of the ratio fold change (−log10 scale, y-axis). This experiment was performed in triplicates. (E and F) Peptide profile plots depicting the relative abundance of detected peptides of APP (E) and APLP2 (F) in BSA control samples (dark gray box), TIMP-1 samples (blue box), and transferrin samples (light gray box). The abundance of detected APP and APLP2 peptides is compared with the BSA and Transferrin controls. Every red line corresponds to one detected peptide, every edge corresponds to a replicate. (G and H) Representative pull-downs of APP (G) and APLP2 (H) employing TIMP-1-coupled magnetic beads. TIMP-1-conjugated and unconjugated control beads were incubated with non-denatured cell lysates, and protein abundance in lysate inputs, lysate outputs, and eluate fractions was analyzed via Western blot. Different isoforms or differentially posttranslationally modified variants (Slunt et al., 1994; Hogl et al., 2011) of APP and APLP2 were detected. (I and J) Representative confocal images of primary human monocytes stimulated with exogenous, fluorescently labeled recombinant human TIMP-1 (Alexa555-TIMP-1) and stained for APP (I) or APLP2 (J). The nucleus is shown in blue, Alexa555-TIMP-1 is shown in red, APP (I) and APLP2 (J) are shown in green. Regions of TIMP-1/APP and TIMP-1/APLP2 colocalization are shown in white. The top panel shows confocal images; the bottom panel shows a surface depiction of the confocal images. The scale bars represent 1 μm. Source data are available for this figure: SourceData F1.
Figure 2.
Figure 2.
TIMP-1 induces proinflammatory features in monocytes. (A) Quantification of glucose uptake analyzed by flow cytometry. Primary human monocytes were stimulated with different concentrations human TIMP-1 (n = 10 biological replicates) or left untreated (n = 10 biological replicates), and the uptake fluorescent glucose (2-NBDG) was evaluated by calculation of geometric means of 2-NBDG in the whole monocyte population. Background of non-2-NBDG-treated cells was subtracted, and fold changes of geometric means of 2-NBDG were calculated by normalization to untreated controls. (B) Cytokine profiles of cell lysates derived from TIMP-1-stimulated and unstimulated primary human monocytes were analyzed using a Human XL Cytokine Array Kit (R&D Systems). Respective dots of the TICS cytokines (IL-6, TNF-α, IL-1α, CXCL1, and CCL20) are framed in red. (C) Quantification of fold changes of dot intensities comparing TIMP-1-treated with untreated cells. Fold changes are represented as log2 values. Upregulated cytokines are colored in different shades of red, downregulated cytokines are colored in different shades of blue. (D) Definition of the TICS panel. Sum of normalized Transcripts Per Million (nTPM) of IL-6, TNF-α, CCL20, IL-1α, and CXCL1 in different peripheral blood cells using published RNA-seq data (Monaco et al., 2019). (EI) Quantification of fold changes of geometric means of intracellular IL-6 (E), TNF-α (F), IL-1α (G), CXCL1 (H), and CCL20 (I) in TIMP-1-treated (different concentrations, n = 10 biological replicates) and untreated (n = 10 biological replicates) primary human monocytes. For geometric mean calculation, background signals of an FMO control were subtracted and fold changes were calculated by normalization to untreated controls. (J–N) Western blots of IL-6 (J), IL-1α (K), TNF-α (L), CXCL1 (M), and CCL20 (N) in cell lysates derived from untreated or TIMP-1-treated primary human monocytes. (N and M) Total protein stains show different regions from the same blot. Data represent means ± SEM. Statistical differences between groups were analyzed employing a two-sided paired t test in the case of normal distribution or nonparametric Mann–Whitney test in the absence of normal distribution. Normality was tested using the Shapiro–Wilk normality test. Statistical differences between groups were assessed with one-way ANOVA Dunnett test for multiple comparisons between each group and a control. *, P ≤ 0.05; **, P ≤ 0.01; ***, P ≤0.001; ****, P ≤ 0.0001; n.s., not significant. Source data are available for this figure: SourceData F2.
Figure S1.
Figure S1.
Pro-inflammatory features of TIMP-1. (A) Employed workflow used for selection of the TICS. (B–K) Normalized transcripts per million (nTPM) of different cytokines in different peripheral blood cells using published RNA-seq data (Monaco et al., 2019). (B) IL-6, (C) TNF-α, (D) CCL20, (E) IL-1α, (F) IL-3, (G) GM-CSF, (H) Adiponectin, (I) CXCL1, (J) EGF, and (K) IGFBP2. (L) Correlation of plasma TIMP-1 levels with plasma IL-6 levels in pancreatic cancer patients (n = 62). For statistical analyses, a Spearman rank correlation due to the absence of normal distribution was employed. Spearman rank correlation coefficient (R) and the P value are indicated. (M) Workflow (left panel) and quantification (right panel) of edema formation in pancreatic tissue derived from TIMP-1-competent (WT) as well as TIMP-1-deficient (KO) mice treated with either PBS (control) or cerulein (acute pancreatitis). (N) Plasma TIMP-1 levels (pg/ml) of pancreatic cancer patients with either high (n = 11) or low (n = 10) levels of TIMP-1 (separated by median TIMP-1 levels). The scale bars represent 200 µm. (O) Plasma sCD163 levels (pg/ml) of pancreatic cancer patients with either high (n = 11) or low (n = 10) levels of sCD163 (separated by median TIMP-1 levels). (P and Q) Overall survival of pancreatic cancer patients (n = 21) with low or high levels of sCD163 (P) or TIMP-1 (Q) in blood plasma. (R) Levels of secreted human TIMP-1 in conditioned medium from THP-1 (n = 3 biological replicates) cells and primary human monocytes (n = 3 biological replicates). (S and T) Quantification of geometric means of intracellular 2-NBDG (S; n = 4 biological replicates) or intracellular IL-6 (T; n = 3 biological replicates) levels in THP-1 cells stimulated with human recombinant TIMP-1 (500 ng/ml). (U) Representative Western blot detecting human TIMP-1 in cell lysates of wildtype and TIMP-1 Knockout THP-1 cells. Levels of secreted human TIMP-1 in conditioned medium from THP-1 wildtype (n = 3) cells and THP-1TKO (n = 3) cells. (V) Levels of secreted human TIMP-1 in conditioned medium from THP-1WT and THP-1TKO cells (n = 3). (W) Normalized geometric mean of APP in primary monocytes and THP-1TKO cells (n = 6 technical replicates). (X) Representative qRT-PCR analysis of APP mRNA expression in THP-1TKO control (shNT) and shAPP THP-1 cell lines (n = 3 technical replicates). 18S rRNA served as internal normalization control, and the expression of APP in shAPP cells was normalized to shNT control cells. (Y and Z) Quantification of geometric means of incorporated 2-NBDG (Y; n = 6 biological replicates) or intracellular IL-6 levels (Z; n = 7 biological replicates) in wildtype and TIMP-1 knockout THP-1 cells. Data are represented as mean ± SEM. Statistical differences between groups were analyzed employing a two-sided paired t test in the case of normal distribution, or nonparametric Mann–Whitney test in the absence of normal distribution was employed. Normality was tested using the Shapiro-Wilk normality test. *, P ≤ 0.05; **, P ≤0.01; ***, P ≤ 0.001; ****, P ≤ 0.0001; n.s., not significant.
Figure 3.
Figure 3.
In vivo relevance of TIMP-1-associated inflammatory processes related to monocyte activation. (A) GSEA of bulk tumor RNA-seq from a PAAD data set. TIMP-1 is clearly associated with pathways related to monocyte activation (e.g., “myeloid leukocyte activation,” “humoral immune response,” “monocyte chemotaxis,” “immune response-regulating cell surface signaling pathways,” “acute inflammatory response,” and “positive regulation of cytokine production”). (B) GSEA of various RNA-seq data sets from different cancer entities. Biological processes showing a strong correlation with TIMP-1 are indicated. (C) Correlation of expression of TICS cytokines with TIMP-1 mRNA expression determined in a published transcriptome data set of patient-derived tumors of several cancer entities. Spearman’s correlation was employed for statistics. (D) Median plasma IL-6 levels in pancreatic cancer patients exhibiting high (n = 31, TIMP-1HI patients, plasma TIMP-1 levels above 240.67 ng/ml) or low (n = 31, TIMP-1LO patients, plasma TIMP-1 levels below 240.67 ng/ml) TIMP-1. Distribution in TIMP-1LO and TIMP-1HI patient groups was performed according to the median TIMP-1 level (240.67 ng/ml) in the whole patient cohort. (E) Median plasma IL-6 levels in acute pancreatitis-bearing TIMP-1WT (n = 7) and TIMP-1−/− (n = 6) mice. Plasma IL-6 levels are depicted as MFI-values measured in flow cytometry. Statistical differences between groups were analyzed employing a nonparametric Mann–Whitney test due to the absence of normal distribution. (F) Correlation of plasma TIMP-1 levels with plasma sCD163 levels in pancreatic cancer patients (n = 21). For statistical analyses, a Spearman rank correlation due to the absence of normal distribution was employed. Spearman rank correlation coefficient (R) and the P value are indicated. Normality was tested using the Shapiro–Wilk normality test. (G) Prognostic Overall survival of pancreatic cancer patients with high levels of sCD163 and in TIMP-1 in blood plasma (sCD163HITIMP-1HI) or of all other pancreatic cancer patients. Kaplan–Meier curve of sCD163HITIMP-1HI as compared with other patients. *, P ≤ 0.05; **, P ≤ 0.01; ***, P ≤ 0.001; ****, P ≤ 0.0001; n.s., not significant.
Figure 4.
Figure 4.
TIMP-1-triggered monocyte activation is dependent on APP. (A–E) Fold changes of normalized geometric means of IL-6 (A; n ranging from 6 to 12 biological replicates), IL-1α (B; n = 6 biological replicates), TNF-α (C; n ranging from 6 to 12 biological replicates), CCL20 (D; n ranging from 6 to 11 biological replicates), and CXCL1 (E; n ranging from 6 to 12 biological replicates) in TIMP-1-treated as well as untreated primary human monocytes, which were pretreated with either IgG control antibodies, anti-APP, or anti-APLP2 antibodies. Fold change differences were normalized to respective non-TIMP-1-treated cells. (F and G) Quantification of geometric means of intracellular 2-NBDG (F; n = 10 biological replicates) or intracellular IL-6 levels (G, n ranging from 6 to 10 biological replicates) in THP-1TKO cells stimulated with different concentrations of human recombinant TIMP-1. (H) Normalized geometric means of cell surface APP levels in THP-1TKO control (shNT) and two different shAPP knockdown cell lines (shAPP #1, shAPP #2; n = 4 technical replicates). (I and J) Geometric means of intracellular 2-NBDG (I; n = 9 biological replicates) and intracellular IL-6 (J; n = 7 biological replicates) in different THP-1 cell lines. For the calculation of geometric means, background signals of an FMO control were subtracted and fold changes were calculated by normalization to shNT control cells. Data are represented as mean ± SEM. Statistical differences between groups were analyzed employing a two-sided paired t test in the case of normal distribution or a nonparametric Mann–Whitney test in the absence of normal distribution. Normality was tested using the Shapiro–Wilk normality test. Statistical differences between groups were assessed with one-way ANOVA Dunnett test for multiple comparisons between each group and a control. *, P ≤ 0.05; **, P ≤ 0.01; ***, P ≤ 0.001; ****, P ≤ 0.0001; n.s., not significant.
Figure S2.
Figure S2.
In silico docking of TIMP-1 and APP. (A) Justification of the in silico predicted APP structure model using published three-dimensional structures from the Protein Data Bank. Structural similarity of the predicted APP structure with published three-dimensional structures from the protein data bank was assessed using chimera X matchmaker function (best-aligning pair of chains). Calculated root-mean square deviations (RMSDs) between predicted APP structure (reference structure) as well as published structures (match structure) were depicted as a heatmap of the APP sequence. (B) Depiction of the three energetically most favorable TIMP-1/APP complexes. The three TIMP-1 molecules are depicted in beige, blue, and pink, respectively, the extracellular part of APP is shown in dark gray, and the transmembrane part is shown in light gray. (C) Detailed view of the three TIMP-1 interaction sites on the APP structure. TIMP-1 molecules are shown in ribbon depiction and the extracellular structure of APP is shown in surface depiction. (D) Interaction residues of TIMP-1 that interact with APP molecule. Interaction residues are highlighted in gray boxes. (E) Interaction residues of APP that interact with the TIMP-1 molecule. Interaction residues are highlighted in gray boxes.
Figure 5.
Figure 5.
TIMP-1 binds to APP via its C-terminal domain. (A and B) Quantification of fold changes of geometric means of intracellular 2-NBDG (A; n = 5 biological replicates) and intracellular IL-6 (B; n = 8 biological replicates) in rhN-TIMP-1-treated (equimolar to 500 ng/ml full-length TIMP-1) and untreated primary human monocytes. (C and D) Quantification of geometric means of intracellular 2-NBDG (C; n ranging from 6 to 9 biological replicates) and intracellular IL-6 levels (D; n = 7 biological replicates) in THP-1T1KO cells treated with rhN-TIMP-1 (equimolar to 500 ng/ml full-length TIMP-1). For the calculation of geometric means, background signals of an FMO control were subtracted and the fold changes were calculated by normalization to untreated cells. Data are represented as mean ± SEM. Statistical differences between groups were analyzed employing a two-sided paired t test in the case of normal distribution, or a nonparametric Mann–Whitney test in the absence of normal distribution was employed. Normality was tested using the Shapiro–Wilk normality test. *, P ≤ 0.05; **, P ≤ 0.01; ***, P ≤ 0.001; ****, P ≤ 0.0001; n.s., not significant.

Similar articles

Cited by

References

    1. Augier, S., Ciucci T., Luci C., Carle G.F., Blin-Wakkach C., and Wakkach A.. 2010. Inflammatory blood monocytes contribute to tumor development and represent a privileged target to improve host immunosurveillance. J. Immunol. 185:7165–7173. 10.4049/jimmunol.0902583 - DOI - PubMed
    1. Baek, M., DiMaio F., Anishchenko I., Dauparas J., Ovchinnikov S., Lee G.R., Wang J., Cong Q., Kinch L.N., Schaeffer R.D., et al. . 2021. Accurate prediction of protein structures and interactions using a three-track neural network. Science. 373:871–876. 10.1126/science.abj8754 - DOI - PMC - PubMed
    1. Bohannon, J.K., Hernandez A., Enkhbaatar P., Adams W.L., and Sherwood E.R.. 2013. The immunobiology of toll-like receptor 4 agonists: From endotoxin tolerance to immunoadjuvants. Shock. 40:451–462. 10.1097/SHK.0000000000000042 - DOI - PMC - PubMed
    1. Bruchez, A., Sha K., Johnson J., Chen L., Stefani C., McConnell H., Gaucherand L., Prins R., Matreyek K.A., Hume A.J., et al. . 2020. MHC class II transactivator CIITA induces cell resistance to Ebola virus and SARS-like coronaviruses. Science. 370:241–247. 10.1126/science.abb3753 - DOI - PMC - PubMed
    1. Carpenter, A., Jones T., Lamprecht M., Clarke C., Kang I., Friman O., Guertin D., Chang J., Lindquist R., Moffat J., et al. . 2006. CellProfiler: image analysis software for identifying and quantifying cell phenotypes. Genome Biology. 7:R100. 10.1186/gb-2006-7-10-r100 - DOI - PMC - PubMed

Publication types