. 2023 Jan 17;120(3):e2216537120.
doi: 10.1073/pnas.2216537120. Epub 2023 Jan 11.

Neuronal membrane proteasomes regulate neuronal circuit activity in vivo and are required for learning-induced behavioral plasticity

Affiliations

Neuronal membrane proteasomes regulate neuronal circuit activity in vivo and are required for learning-induced behavioral plasticity

Hai-Yan He et al. Proc Natl Acad Sci U S A. .

Abstract

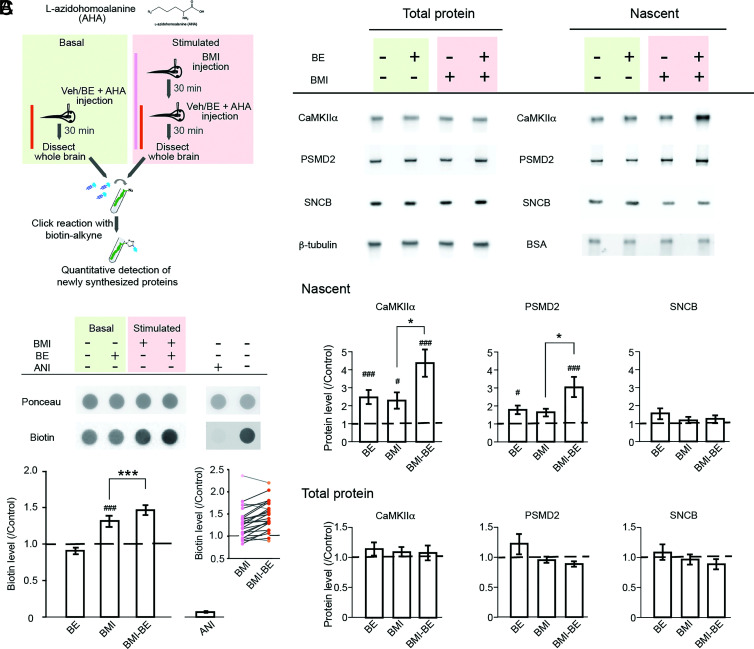
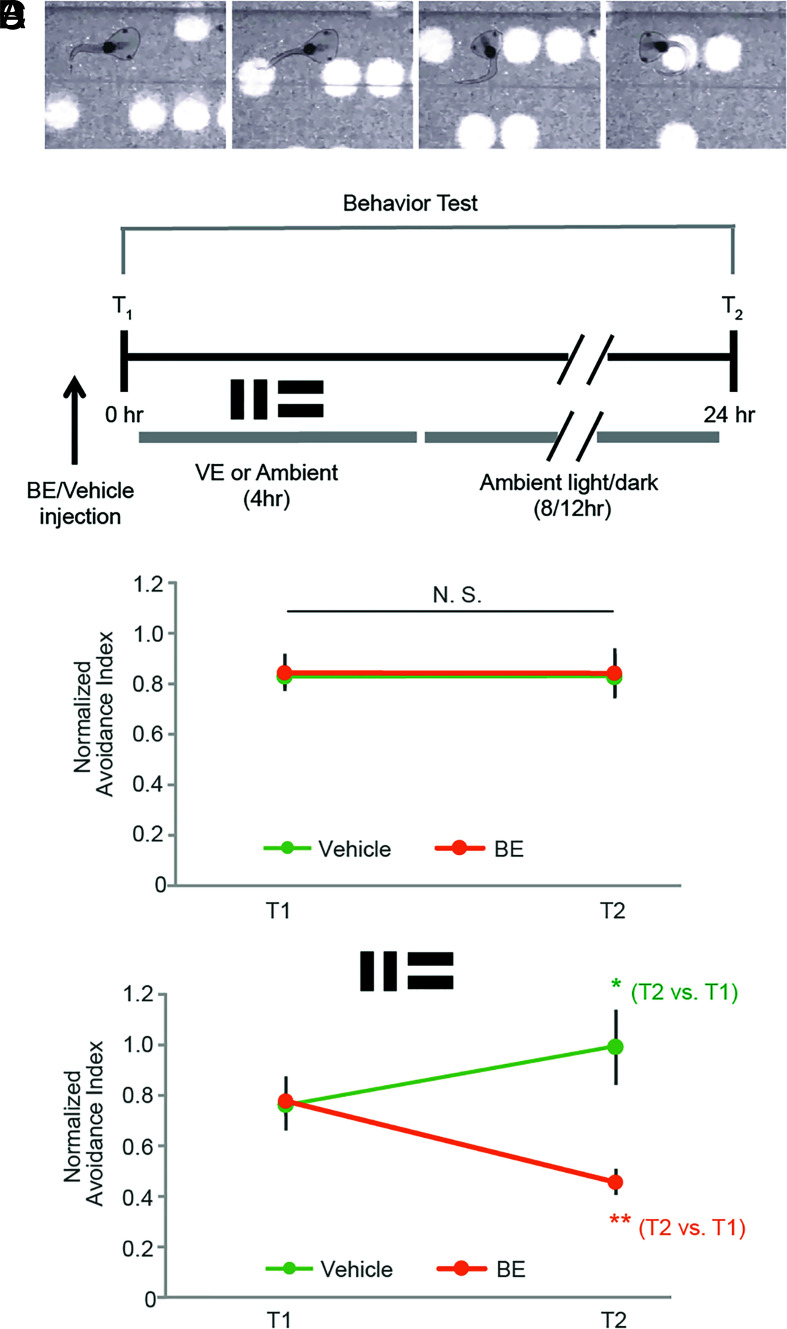
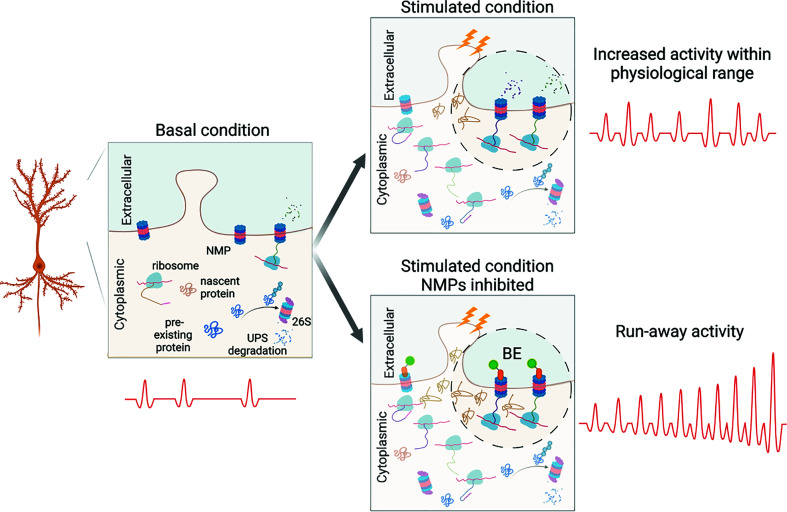
Protein degradation is critical for brain function through processes that remain incompletely understood. Here, we investigated the in vivo function of the 20S neuronal membrane proteasome (NMP) in the brain of Xenopus laevis tadpoles. With biochemistry, immunohistochemistry, and electron microscopy, we demonstrated that NMPs are conserved in the tadpole brain and preferentially degrade neuronal activity-induced newly synthesized proteins in vivo. Using in vivo calcium imaging in the optic tectum, we showed that acute NMP inhibition rapidly increased spontaneous neuronal activity, resulting in hypersynchronization across tectal neurons. At the circuit level, inhibiting NMPs abolished learning-dependent improvement in visuomotor behavior in live animals and caused a significant deterioration in basal behavioral performance following visual training with enhanced visual experience. Our data provide in vivo characterization of NMP functions in the vertebrate nervous system and suggest that NMP-mediated degradation of activity-induced nascent proteins may serve as a homeostatic modulatory mechanism in neurons that is critical for regulating neuronal activity and experience-dependent circuit plasticity.

Keywords: BONCAT; activity-induced nascent proteins; neuron; proteasome; spontaneous activity.


Conflict of interest statement

The authors declare no competing interest.

Figures

Fig. 1.
Fig. 1.
NMPs are present in tadpole neurons. (A) Biochemical evidence for NMPs in the tadpole brain. Tadpole brain tissue was collected at 30 m or 6 h after either BE or Epox injection, and an equivalent amount of protein from the membrane and cytosolic fractions were labeled with indicated antibodies on western blots. The 20S core proteasome subunits (α1–7) are abundantly expressed in the tadpole brain and are enriched in the membrane fraction. Importantly, the biotin signal was recovered at the molecular weight corresponding to the 20S catalytic subunits (run around 20 to 25 kD) bound to the injected BE in (and only in) the membrane preparation both at 30 min and 6 h after the injection. Actin, a cytosolic protein, and GluA1, which is enriched in the neuronal membrane, serve as positive controls for the cell fractionation preparation. (B) Preinjection of Epox occluded BE binding to NMPs. Brain lysates from uninjected, BE-injected, and Epox preinjected (Epox-BE-inj) samples were purified by neutravidin pulldown to coprecipitate BE-bound proteins and blotted with biotin and 20S β5 antibody. (C) Anatomical illustration of cellular organization of the optic tectum (OT) and the ventricle (V). CBL: neuronal cell body layer. NPL: neural progenitor cell layer. N: neuropil. (D) Immunohistological localization of NMPs bound to BE. Vibratome sections of the OT immunostained with Anti-Biotin antibody show punctate biotin signal in neuronal cell body layers and the neuropil in the BE-injected tectum but not uninjected, or Epox-preinjected, or biotin-injected controls. All samples processed in parallel under the same conditions. Gold: biotin; blue: DAPI. (Scale bar, 20 µm.) (EJ) Ultrastructural distribution of the 20S proteasome shown by preembedding immunogold labeling with anti-α1-7 20S proteasome subunit antibody and FluoroNanogold secondary antibody (1.4-nm-diameter gold particles). Plasma membranes are highlighted in light blue. (E and F) Ultramicrographs from the tectal cell body layer showing anti-α1-7 20S immunogold labeling (E) and no primary controls (F). Boxed regions are shown at higher magnification in E’ and F’. Immunogold particles identifying 20S α subunits are associated with the plasma and nuclear membranes and found in the cytoplasm. Asterisks mark nuclei. (Scale bar, 1 µm.) (GJ) Ultramicrographs from the tectal neuropil labeled with anti-α1-7 20S antibodies (G and I) or no primary control (H and J). Numerous immunogold particles identifying 20S α subunits are localized at or near the plasma membrane in G and I. The 20S α subunits are also visible at synaptic sites, which are marked by arrows. (Scale bar, 500 nm.)
Fig. 2.
Fig. 2.
NMPs degrade nascent proteins in the tadpole brain. (A) Experimental design and timeline. Animals under basal or stimulated (treated with BMI) conditions were injected in the brain ventricle with either vehicle (Veh) or BE together with AHA to label nascent proteins using the BONCAT. For each batch of animals, 25 to 30 brains were collected for each experimental group and processed in parallel. (B, Top): representative Ponceau staining (Top) and biotin-immunolabeled dot blots (Bottom) under basal and BMI-stimulated conditions. (B, Bottom): summary data of AHA–biotin-labeled total nascent protein level detected by biotin signal in dot blots. Data from different experimental groups were normalized to the corresponding control group (marked by the dashed line) from the same batch of animals run on the same blot. Data shown as mean ± SEM, n = 24 batches. RM one-way ANOVA with Bonferroni’s multiple comparison test. ###P < 0.001, compared with the control group. ***P < 0.001, comparison as marked. Inset shows data from individual batches for the BMI and BMI–BE groups. Data points of the same batch were line-connected for visualization of within-batch comparisons (Cohen’s D = 0.43). Anisomycin (ANI) was coinjected with AHA under control condition in a subset (n = 3 batches) of experiments to confirm that the detected biotin signal was from biotinylated AHA-labeled nascent proteins. (C) Nascent CaMKIIα and PSMD2, but not SNCB are degraded by NMPs in the tadpole brain. Top: experimental conditions for each group are shown with representative western blots for each candidate and loading controls (β-tubulin for total protein and biotinylated BSA for purified nascent proteins). Middle: quantification of nascent proteins (Middle) and total protein (Bottom). All data were normalized to the corresponding control group (dashed line) from the same batch that was run on the same blot. NMP inhibition increased nascent CaMKIIα and PSMD2 under basal and stimulated conditions. Total protein was not affected by NMP inhibition. The Friedman test with Dunn’s multiple comparison test. #P < 0.05, ###P < 0.001, compared with the control group. *P < 0.05, comparison as marked. n = 16 batches.
Fig. 3.
Fig. 3.
Inhibiting NMPs induced a rapid increase in spontaneous neuronal activity and network synchrony in the tadpole brain. (A) Representative time-lapse images of GCaMP fluorescence collected in the OT of a live tadpole throughout an experiment. The animal was recorded for 5 min before and after intraventricular injection of BMI and for 5 min after BE injection. (Scale bar, 50 µM.) (B) Traces of Ca++ activity extracted from the GCaMP fluorescence signal in the same individual tectal neuronal soma (ROIs) during the 5-min recording period following the indicated treatments. (C) Raster plots (Top) of Ca++ events derived from the data in B. (DK) Summary data of average Ca++ event counts (DG) and integrated Ca++ responses (HK) at different time points in animals under different conditions. (LM) Scatterplots of Ca++ event counts for individual neurons in BMI-treated animals before and after treatment with either vehicle (L) or BE (M). (NP) The synchrony index calculated from Ca++ activity of all neurons recorded in each animal in animals treated with BE (N), BMI-veh (O), or BMI–BE (P). Data points from the same animal were connected by straight lines. (Q) Magnitude of change in Ca++ event counts following different treatments. *P < 0.05, **P < 0.01, and ***P < 0.001. The Friedman test with Dunn’s multiple comparison post hoc test. Veh: n = 54 neurons and N = 3 animals; BE: n = 214 neurons and N = 6 animals (data pooled from 50 µM and 250 µM BE). BMI-Veh: n = 119 neurons and N = 6 animals; BMI–BE: n = 194 neurons and N = 8 animals.
Fig. 4.
Fig. 4.
NMP activity is required for learning-induced behavioral improvement and the maintenance of normal visual avoidance behavior following enhanced visual training in tadpoles. (A) Illustration of the visual avoidance behavior in tadpoles. Animals make a sharp turn in their swimming trajectory when they encounter an approaching visual stimulus. The percentage of avoidance events out of the first 10 encounters is quantified as the avoidance index (AI) to evaluate the behavioral performance of the animals. (B) Experimental timeline for visual training and behavioral test schedule. Animals first received a ventricular injection of either BE or vehicle (Veh) and were tested 30 min later for baseline visual avoidance behavior performance (T1). Then, animals were subjected to 4 h of either visual training (VE) or ambient light and returned to their normal rearing conditions. Animals were tested again for avoidance behavior the next day (T2). (C) In the absence of VE, baseline behavioral performance was not affected by BE, n = 9 animal batches. (D) Following VE, vehicle-injected control animals improved their visual avoidance response. Inhibiting NMPs with BE not only completely blocked learning-induced behavioral improvement following VE but also caused a significant deterioration of the behavioral performance comparing with the pretraining baseline level. *P < 0.05 and **P < 0.01. Paired two-tailed Student’s t test, n = 6 animal batches.
Fig. 5.
Fig. 5.
Schematic of the proposed function of NMP contribution to the maintenance of homeostasis of neuronal activity in response to elevated neuronal activity. A portion of the neuronal dendrite including a spine is exemplified under three different conditions (boxes): the basal condition (Left), the stimulated condition (Upper Right), and the stimulated condition in the presence of BE, which blocks NMP activity (Lower Right). NMPs are shown in the plasma membrane, ribosomes, nascent proteins (tan), preexisting proteins (blue), and the 26S proteasome, which carries out UPS-mediated protein degradation, are shown in the cytoplasm. Under basal conditions (Left), there is a low level of NMP-mediated degradation of nascent proteins, which are produced by either constitutive protein synthesis or from ongoing neural activity. Upon enhanced stimulation (Upper Right), protein synthesis increases, and the resultant nascent proteins contribute to activity-dependent synaptic plasticity mechanisms that strengthen synaptic connections and increase synaptic transmission. A significant proportion of these activity-induced plasticity-related nascent proteins is degraded by NMPs, which help to maintain neuronal activity within a normal range. Under the stimulated condition, when NMPs are inhibited by BE (Lower Right, BE: green and orange shape bound to NMPs), excess nascent proteins that were not degraded induce aberrant neuronal activity.

References

    1. Turker F., Cook E. K., Margolis S. S., The proteasome and its role in the nervous system. Cell Chem. Biol. 28, 903–917 (2021), 10.1016/j.chembiol.2021.04.003. - DOI - PMC - PubMed
    1. Whitaker M., Patel R., Calcium and cell cycle control. Development 108, 525–542 (1990), 10.1242/dev.108.4.525. - DOI - PubMed
    1. DiAntonio A., et al. , Ubiquitination-dependent mechanisms regulate synaptic growth and function. Nature 412, 449–452 (2001), 10.1038/35086595. - DOI - PubMed
    1. Dorrbaum R., Kochen L., Langer J. D., Schuman E. M., Local and global influences on protein turnover in neurons and glia. Elife 7, e34202 (2018), 10.7554/eLife.34202. - DOI - PMC - PubMed
    1. Fonseca R., Vabulas R. M., Hartl F. U., Bonhoeffer T., Nagerl U. V. A., A balance of protein synthesis and proteasome-dependent degradation determines the maintenance of LTP. Neuron 52, 239–245 (2006), 10.1016/j.neuron.2006.08.015. - DOI - PubMed

Publication types

MeSH terms

Substances

LinkOut - more resources