. 2023 Jan 11;18(1):e0280332.
doi: 10.1371/journal.pone.0280332. eCollection 2023.

A portable feedback-controlled pump for monitoring eye outflow facility in conscious rats

Affiliations

A portable feedback-controlled pump for monitoring eye outflow facility in conscious rats

Youssef Mohamed et al. PLoS One. .

Abstract

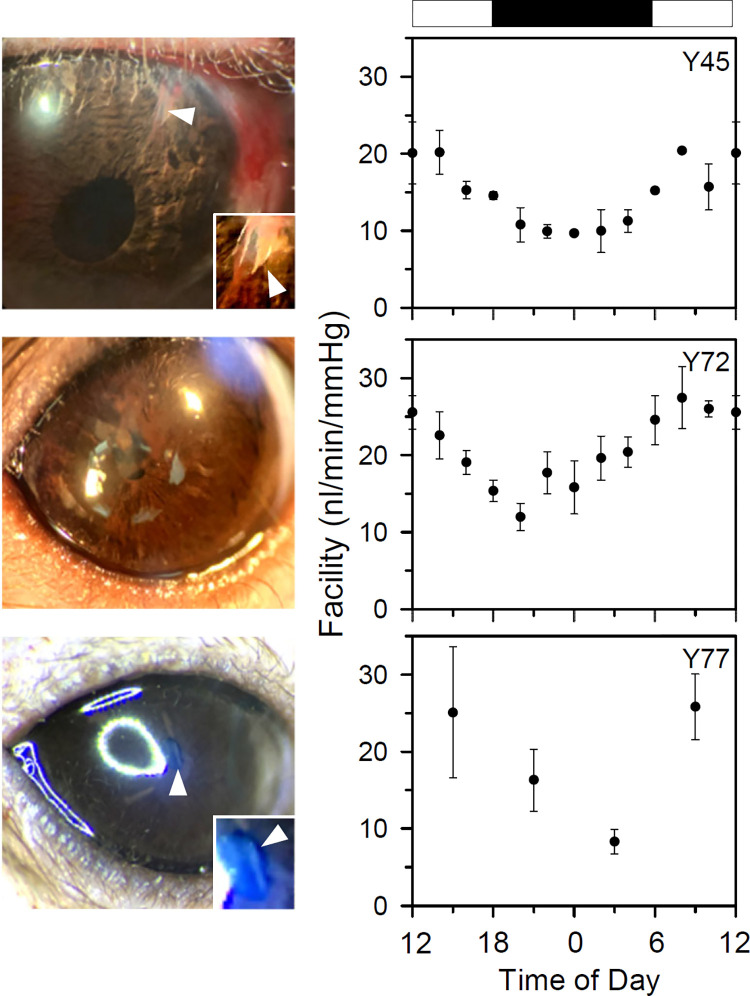
Intraocular pressure (IOP) is heavily influenced by the resistance of trabecular outflow pathways through which most of the aqueous humor produced by the eye continuously drains. The standard method of quantifying outflow resistance and other aspects of ocular fluid dynamics is eye cannulation, which allows for direct measurement and manipulation of IOP and flow in animal models. Since the method is invasive, indirect techniques that are slower and less accurate must be used for chronological studies. A novel technology is introduced that can autonomously measure outflow facility in conscious rats multiple times a day. A smart portable micropump infuses fluid into the eye through a permanently-implanted cannula and dynamically adjusts flow rate using a unique proportional feedback algorithm that sets IOP to a target level, even though IOP fluctuates erratically in awake free-moving animals. Pressure-flow data collected by the system from anesthetized rats were validated against intraocular recordings with commercial pressure and flow sensors. System and sensor estimates of outflow facility were indistinguishable, averaging 23 ± 3 nl·min-1·mmHg-1 across animals (n = 11). Pressure-flow data were then collected round-the-clock for several days from conscious rats, while outflow facility was measured every few hours. A significant diurnal facility rhythm was observed in every animal (n = 4), with mean daytime level of 22 ± 10 nl·min-1·mmHg-1 and mean nighttime level of 15 ± 7 nl·min-1·mmHg-1. The rhythm correlated with diurnal changes in IOP and likely contributed prominently to those changes based on the day-night swing in facility magnitude. Hence, the portable smart pump offers a unique tool for repeated long-term monitoring of outflow facility and other possible parameters of ocular health. It could also be useful in animal glaucoma studies for reversibly inducing acute or chronic ocular hypertension without explicitly damaging trabecular outflow pathways.


Conflict of interest statement

I have read the journal’s policy and the authors of this manuscript have the following competing interests: U.S. patents 9022968, 9314375, and 10758408. This does not alter our adherence to PLOS ONE policies on sharing data and materials.

Figures

Fig 1
Fig 1. Portable eye perfusion system.
(A) Image of the device connected to an external fluid reservoir. Scale bar: 5 mm. (B) Image of experimental setup in action on a conscious rat. The device (asterisk) infuses fluid and senses pressure in the eye via a detachable tether that connects to a pin-port (arrowhead) mounted atop the head. (C) Schematic of system components. The device consists of a micropump, microcontroller, flow restrictor, pressure transducer, and connector tubing. The device is powered by and communicates with a laptop computer via a USB connector. Fluid is drawn from the saline reservoir and infused into the anterior chamber of the eye though a cannula.
Fig 2
Fig 2. System design and calibration.
(A) Equivalent circuit model of the eye and eye perfusion system components. Gray elements represent pressure and flow sensors used for device calibration and testing only and are not part of the fabricated device. PP: pump pressure head, FP: pump infusion rate, RS: flow restrictor resistance, CS: connector tubing compliance, PS: sensor pressure, FC: flow through cannula, RC: cannula resistance, PE: intraocular pressure, FA: aqueous production rate, FU: uveoscleral outflow, RT: trabecular outflow resistance, PV: episcleral venous pressure, CG: globe wall compliance.
Fig 3
Fig 3. Bench testing.
(A) Flow restrictor resistance measured over several weeks of continuous saline effusion by a fabricated system. Dashed line is a linear fit of the data (RS = 159 + 0.010·days). (B) Pump input-output curve measured on different days over a several week period. (C) Measured flow rate (FC) for 5 fabricated systems across a range of pump rate settings (FP). Dashed line is a linear fit of the data (FC = -0.01 + 0.99·FP).
Fig 4
Fig 4. System performance in anesthetized animals.
(A) Left, pressure (top) and flow (bottom) records from a ketamine-anesthetized rat in response to a single pump-driven step increase in flow (CF). Right, pressure and flow records from another rat in response to a single pump-driven step increase in pressure (CP). Black and red traces correspond to eye pressure and flow reported by the system (PE and FP) and independently measured by pressure and flow sensors (IOP and FC), respectively. (B) Comparison of system and sensor pressure readings across a series of CF (left) and CP (right) steps. Solid lines are linear regression fits (slope: 1.002 and 1.001) (C) Comparison of system and sensor flow readings across a series of CF (left) and CP (right) steps. A box-and-whisker plot is used for the former since flow is fixed for each step. Solid lines are linear regression fits (slope: 1.006 and 0.993).
Fig 5
Fig 5. Outflow facility measurements in anesthetized animals.
(A) Records of pressure (top) and flow (bottom) from a ketamine-anesthetized rat in response to a series of flow steps (CF, left) and from another rat to series of pressure steps (CP, right). Black traces correspond to eye pressure and flow reported by the system (PE and FP) and red traces to flow measured independently by a flow meter (FC). (B) Steady-state pressure-flow data for the CF (left) and CP (right) experiment. Black and red lines are linear fits of the data (CF intercept: -0.41 and -0.44 μl·min-1, CF facility: 19 and 21 nl·min-1·mmHg-1, CP intercept: -0.45 and -0.42 μl·min-1, CP facility: 22 and 21 nl·min-1·mmHg-1). Error bars give standard deviation. (C) Pressure-flow data from 11 anesthetized animals (colored symbols) with the system (left) and flow meter (right) (D) Box-and-whisker plot of facility estimates with the system (S) and flow meter (M) for the same animals (colored symbols). Y-intercepts respectively averaged -0.36 ± 0.12 and -0.41 ± 0.14 μl·min-1 (p = 0.44).
Fig 6
Fig 6. System performance in conscious animals.
(A) Records of pressure (top) and flow (bottom) from an awake free-moving rat over a several hour period. Outflow facility measurements were made at 8A, 10A, and 12P with the system in CP mode. (B) Pressure and flow records for the facility measurement at 8A. Black and red traces respectively plot the raw data and the data after real-time processing with a recursive regression algorithm which is designed to ignore transient IOP fluctuations that can interfere with steady-state estimation. Boxes indicate the 2-min window in which the processed signal met steady-state criteria, triggering the system to initiate the next pressure step or end the series. (C) Steady-state pressure-flow data from processed records of the 3 facility measurements. Dashed lines are linear fits of 8A, 10A, and 12P data (intercepts: -0.29, -0.34, and -0.42 μl·min-1, facility: 23, 27, and 28 nl·min-1·mmHg-1). Error bars give standard deviation.
Fig 7
Fig 7. Outflow facility measurements in conscious animals.
(A) Records of pressure (top) and flow (bottom) from an awake free-moving rat over a 24-hr period. Outflow facility measurements were made at 3P, 9P, 3A, and 9A with the system in CP mode. (B) Steady-state pressure-flow data from processed records of the 4 facility measurements. Dashed lines are linear fits of 3A, 9P, 3A, and 9A data (intercepts: -0.58, -0.32, -0.33, and -0.54 μl·min-1, facility: 23, 32, 36, and 22 nl·min-1·mmHg-1). Error bars give standard deviation. (C) Comparison of IOP and facility estimates throughout the day. White and black boxes in A and C indicate the light and dark phases of the ambient lighting cycle.
Fig 8
Fig 8. Diurnal rhythms in outflow facility.
Summary of round-the-clock facility estimates across multiple days in three additional conscious rats (Y45: 2 days, Y72: 7 days, Y77: 4 days). Error bars give standard error. White and black boxes indicate the light and dark phases of the ambient lighting cycle. Images show eyes on final day of experiment. Arrow in Y45 and Y77 points to cannula, and insets in lower right are a close-up of the cannula tip. Inset contrast was adjusted to enhance tip visibility. Cannula tip was beneath the iris and cannot be seen in Y72.

References

    1. Quigley HA, Enger C, Katz J, Sommer A, Scott R, Gilbert D. Risk factors for the development of glaucomatous visual field loss in ocular hypertension. Arch Ophthalmol. 1994; 112:644–9. doi: 10.1001/archopht.1994.01090170088028 - DOI - PubMed
    1. Casson RJ, Chidlow G, Wood JP, Crowston JG, Goldberg I. Definition of glaucoma: clinical and experimental concepts. Clin Exp Ophthalmol. 2012; 40:341–9. doi: 10.1111/j.1442-9071.2012.02773.x - DOI - PubMed
    1. Wang Q, Thau A, Levin AV, Lee D. Ocular hypotony: A comprehensive review. Surv Ophthalmol. 2019; 64:619–38. doi: 10.1016/j.survophthal.2019.04.006 - DOI - PubMed
    1. Downs JC. IOP telemetry in the nonhuman primate. Exp Eye Res. 2015; 141:91–8. doi: 10.1016/j.exer.2015.07.015 - DOI - PMC - PubMed
    1. Turner DC, Samuels BC, Huisingh C, Girkin CA, Downs JC. The magnitude and time course of IOP change in response to body position change in nonhuman primates measured using continuous IOP telemetry. Invest Ophthalmol Vis Sci. 2017; 58:6232–40. doi: 10.1167/iovs.17-22858 - DOI - PMC - PubMed

Publication types