. 2023 Mar;237(6):2180-2195.
doi: 10.1111/nph.18704. Epub 2023 Jan 11.

The influences of stomatal size and density on rice abiotic stress resilience

Affiliations

The influences of stomatal size and density on rice abiotic stress resilience

Robert S Caine et al. New Phytol. 2023 Mar.

Abstract

A warming climate coupled with reductions in water availability and rising salinity are increasingly affecting rice (Oryza sativa) yields. Elevated temperatures combined with vapour pressure deficit (VPD) rises are causing stomatal closure, further reducing plant productivity and cooling. It is unclear what stomatal size (SS) and stomatal density (SD) will best suit all these environmental extremes. To understand how stomatal differences contribute to rice abiotic stress resilience, we screened the stomatal characteristics of 72 traditionally bred varieties. We found significant variation in SS, SD and calculated anatomical maximal stomatal conductance (gsmax ) but did not identify any varieties with SD and gsmax as low as transgenic OsEPF1oe plants. Traditionally bred varieties with high SD and small SS (resulting in higher gsmax ) typically had lower biomasses, and these plants were more resilient to drought than low SD and large SS plants, which were physically larger. None of the varieties assessed were as resilient to drought or salinity as low SD OsEPF1oe transgenic plants. High SD and small SS rice displayed faster stomatal closure during increasing temperature and VPD, but photosynthesis and plant cooling were reduced. Compromises will be required when choosing rice SS and SD to tackle multiple future environmental stresses.

Keywords: climate change; drought; plant water-use; rice; salinity; stomata; temperature; vapour pressure deficit (VPD).


Conflict of interest statement

None declared.

Figures
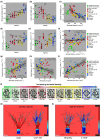
Fig. 1
Fig. 1
Stomatal size (SS), stomatal density (SD) and pore aperture contributions to rice (Oryza sativa) gaseous exchange on plants grown in high light conditions (1500 μmol m−2 s−1 PAR). (a) Abaxial SD and (b) SS (guard cell length) of nine selected rice varieties and two transgenic OsEPF1oe plants on the abaxial leaf surface. (c) Regression analysis between SS and SD. (d) Calculated maximum anatomical stomatal conductance (g smax), and (e) corresponding operating stomatal conductance (g sw). Regression analysis of (f) abaxial g smax and abaxial operating g sw, (g) abaxial operating g sw and SD, (h) abaxial operating g sw and SS and (i) abaxial operating g sw and stomatal pore area. (j) Examples of stomatal openness (Bar, 10 μm). (k) Thermal images for plants with low SD and large SS and (l) high SD and small SS. Different letters on graphs indicate a significant difference between the means (one‐way ANOVA, Tukey HSD test, P < 0.05). Black diamonds represent means. OsEPF1oe plants are excluded from regression analyses. (a–i) n = 7 plants.
Fig. 2
Fig. 2
The relationships between rice (Oryza sativa) aboveground biomass and stomatal size (SS), stomatal density (SD) and leaf gas exchange parameters during vegetative tillering. (a) Dry plant biomass. (b–f) Regression analysis conducted between aboveground biomass and (b) SD, (c) SS (guard cell length), (d) stomatal pore area, (e) leaf stomatal conductance (g sw) and (f) calculated anatomical maximum stomatal conductance (g smax). Different letters indicate a significant difference between the means (one‐way ANOVA, Tukey HSD test, P < 0.05). Black diamonds represent means. OsEPF1oe plants are excluded from regression analyses. n = 7 plants.
Fig. 3
Fig. 3
Natural rice varieties (Oryza sativa) with medium to high stomatal density (SD) and smaller stomatal size (SS) respond better to drought than lower SD large SS varieties. (a) Drought responses assessed at the tiller base using Φ PSII to measure plant health. (b) Number of new regenerative leaves 1 wk after re‐watering. (c–f) Examples of varieties with (c) very low SD (OsEPF1oeS), (d) low SD and large SS (Sathi), (e) medium SD and small SS (IR‐64), and (f) high SD and small SS (C‐7306) recovering from drought at 42 d, 1 wk after re‐watering. In (a), different letters indicate significant differences between the means of well‐watered samples (one‐way ANOVA, Tukey HSD test, P < 0.05). To assess drought responsiveness in (b), a generalised linear mixed model (GLMM) was used to compare the grouped SDs of transgenic (OsEPF1oeS and OsEPF1oeW), low SD (Nang Thom Bis, Sathi, UCP‐188 and OM‐479) and medium to high SD (IR‐64, HATRI‐61, Bharathy and C‐7306) varieties. Newly emerging leaves differed significantly between grouped varieties (GLMM, LRT; χ2 = 26.62, P < 0.00001). Black diamonds and triangles represent means for well‐watered and droughted varieties, respectively. SD category means are included in white boxes above the grouped varieties. n = 10–11 plants.
Fig. 4
Fig. 4
OsEPF1oe plants with reduced stomatal density (SD) display increased salinity tolerance during seedling and tillering stages. Abaxial leaf 5 (a) SD and (b) stomatal size (guard cell length) of fresh water and salt grown IR‐64 and OsEPF1oe plants at 19–21 d post germination (DPG). Fresh water and salt grown rice (Oryza sativa) plant gas exchange measurements of (c) carbon assimilation (A), (d) stomatal conductance (g sw) and (e) intrinsic water‐use efficiency (iWUE). (f) Φ PSII leaf measurements of apical leaves at 28 DPG with (g) representative leaf images from fresh water and salinity treated IR‐64 (IR), OsEPF1oeW (W) and OsEPF1oeS (S) plants (Bar, 2 cm). (h) Sodium (Na) and (i) Potassium (K) concentrations in auxiliary leaves of 35 DPG tillering plants. Whiskers indicate the ranges of the minimum and maximum values and different letters indicate a significant difference between the means (two‐way ANOVA, Tukey HSD test, P < 0.05). For (f) and (h), two separate Kruskal–Wallis one‐way ANOVAs were performed due to unequal variances (P < 0.05). Black diamonds represent means and black dots are outliers. n = 6–7 plants.
Fig. 5
Fig. 5
OsEPF1oe rice (Oryza sativa) maintains higher leaf ΦPSII values for equal or longer than all traditionally bred rice varieties. (a) Apical leaf ΦPSII measurements of the nine natural varieties and two OsEPF1oe lines grown in 50 mM NaCl solution for 67 d. Vertical lines show one SE (b) ΦPSII values before salt treatment at day 16 (ns, not significant). (c) ΦPSII values on the apical leaf at 41 d post germination, 25 d after the commencement of the salt treatment. For (b, c), whiskers indicate the minimum and maximum values and stars indicate a significant difference from salt tolerant OsEPF1oeW (one‐way ANOVA, Tukey HSD test, P < 0.05). Black diamonds represent means. n = 7–9 plants.
Fig. 6
Fig. 6
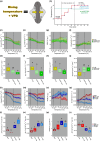
Dynamic stomatal responses to rising temperature lead to large alterations in rice (Oryza sativa) photosynthesis and water‐use efficiency. (a) Increasing temperature coupled with increasing leaf vapour pressure deficit (VPD) often causes stomatal closure. (b) Program used in Li‐Cor 6800 gas analysers used to study stomatal responses to temperature and leaf VPD. At c. 39.5°C and more, it was not possible to maintain relative humidity (RH) at 55% owing to additive RH being unable to reach the set point for a number of the different varieties surveyed (see also Supporting Information Fig. S4). Purple stars indicate recorded data points. Parallel vertical dotted lines indicate period used to calculate rate changes. (c–j) Comparison of IR‐64 control plants and OsEPF1oeW/OsEPF1oeS transgenics investigating leaf 5 responses to raising temperature and VPD. (c, d) Carbon assimilation (A) responses over 1‐h duration and (d) rate of change per minute during the 24‐min incline period. (e, f) Equivalent stomatal conductance (g sw) responses and rates of change over 24‐min period. (g, h) Corresponding intrinsic water‐use efficiency (iWUE) responses and rates of change and (i, j) transpiration (E) responses and rates of change. (k–r) Comparisons between low SD, large SS varieties Sathi and UCP‐188 and high SD, small SS varieties Bharathy and C‐7306. (k) A responses over 1‐h assay and (l) rate of change per minute during the 24‐min incline period. (m, n) Equivalent g sw responses and rates of change. (o, p) Corresponding iWUE responses and rates of change and (q, r) E responses and rates of change. Ribbons highlight SE of the mean. Boxplot whiskers indicate the minimum and maximum values and different letters indicate a significant difference between the means (one‐way ANOVA, Tukey HSD test, P < 0.05). Grey diamonds represent means. n = 7–8 plants.

References

    1. Bates D, Machler M, Bolker B, Walker S. 2015. Fitting linear mixed‐effects models using lme4. Journal of Statistical Software 67: 1–48.
    1. Bertolino LT, Caine RS, Gray JE. 2019. Impact of stomatal density and morphology on water‐use efficiency in a changing world. Frontiers in Plant Science 10: 225. - PMC - PubMed
    1. Bouman B. 2009. How much water does rice use? Rice today. Manilla, Philippines: IRRI, 29.
    1. Caine RS, Yin X, Sloan J, Harrison EL, Mohammed U, Fulton T, Biswal AK, Dionora J, Chater CC, Coe RA et al. 2019. Rice with reduced stomatal density conserves water and has improved drought tolerance under future climate conditions. New Phytologist 221: 371–384. - PMC - PubMed
    1. Chen H, Zhao X, Zhai L, Shao K, Jiang K, Shen C, Chen K, Wang S, Wang Y, Xu J. 2020. Genetic bases of the stomata‐related traits revealed by a genome‐wide association analysis in rice (Oryza sativa L.). Frontiers in Genetics 11: 611. - PMC - PubMed

Publication types