. 2023 Jan 10;56(1):43-57.e10.
doi: 10.1016/j.immuni.2022.12.009.

GATA4 controls regionalization of tissue immunity and commensal-driven immunopathology

Affiliations

GATA4 controls regionalization of tissue immunity and commensal-driven immunopathology

Zachary M Earley et al. Immunity. .

Abstract

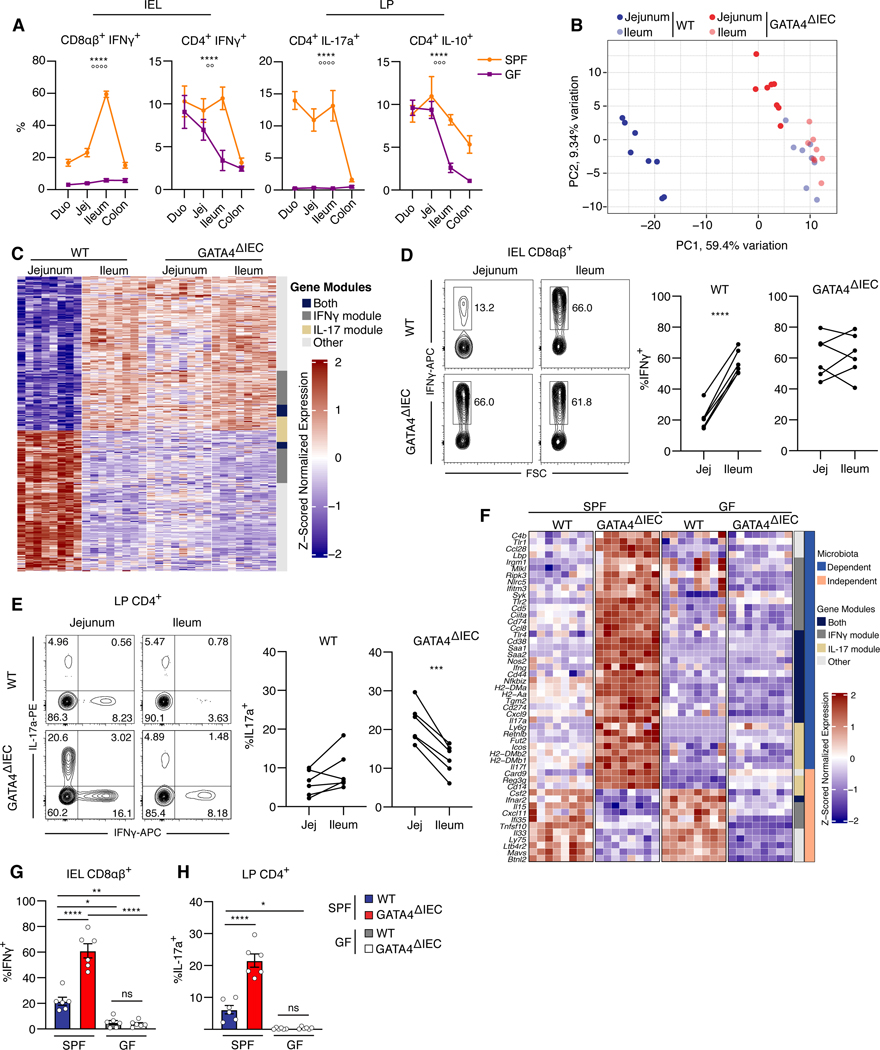
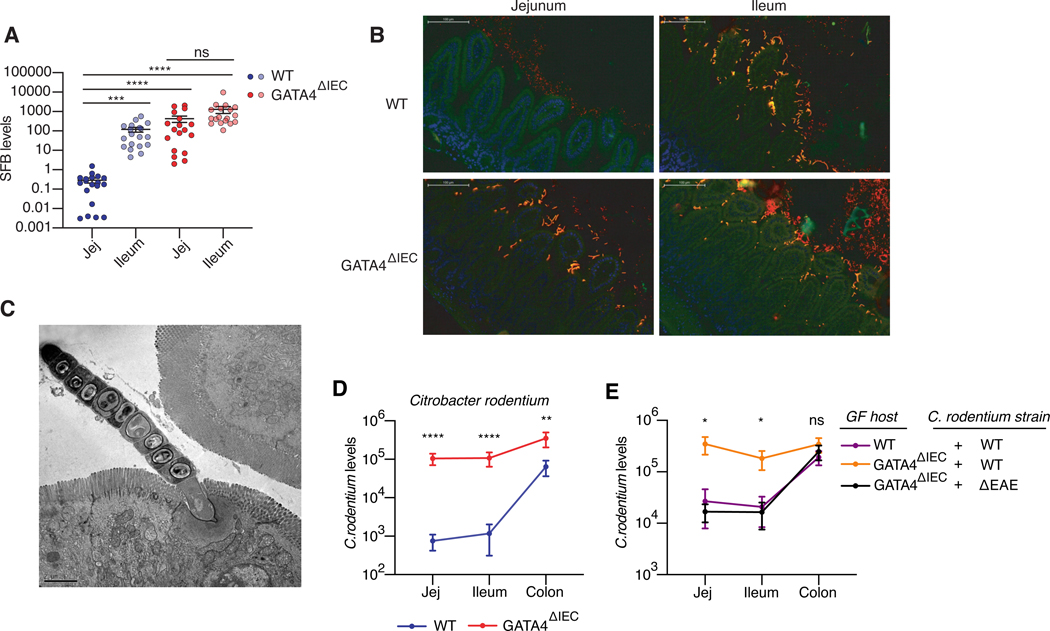
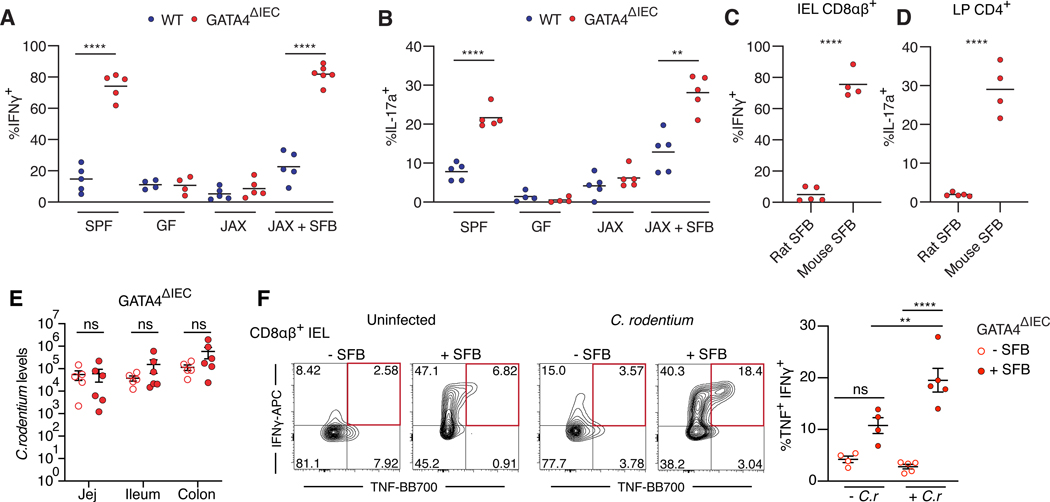
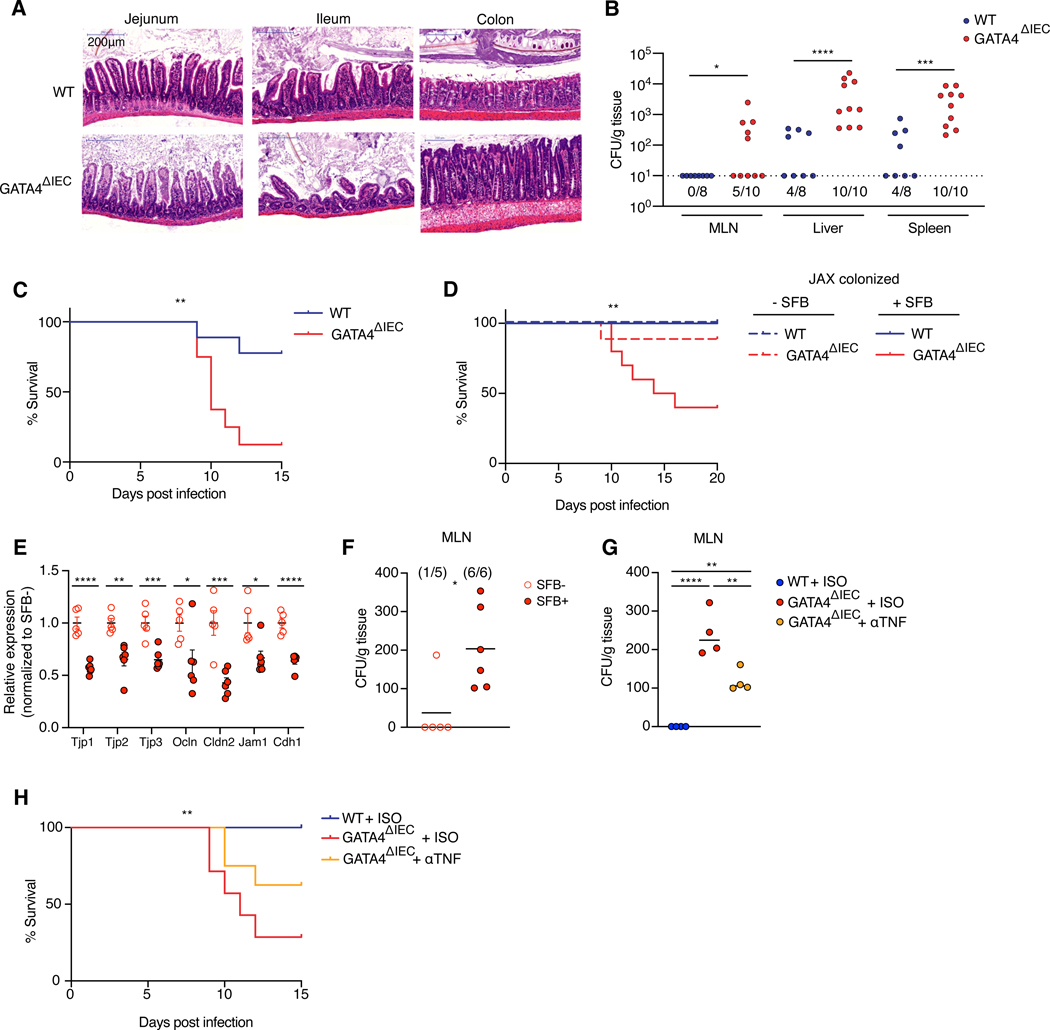
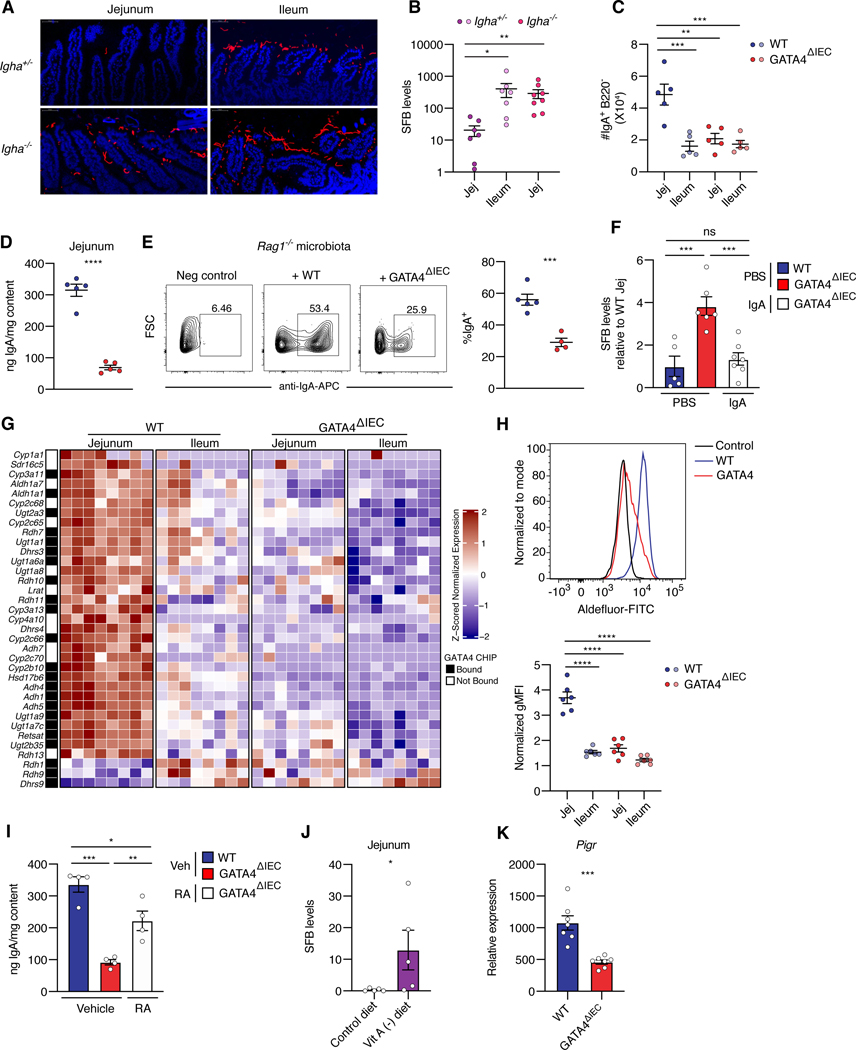
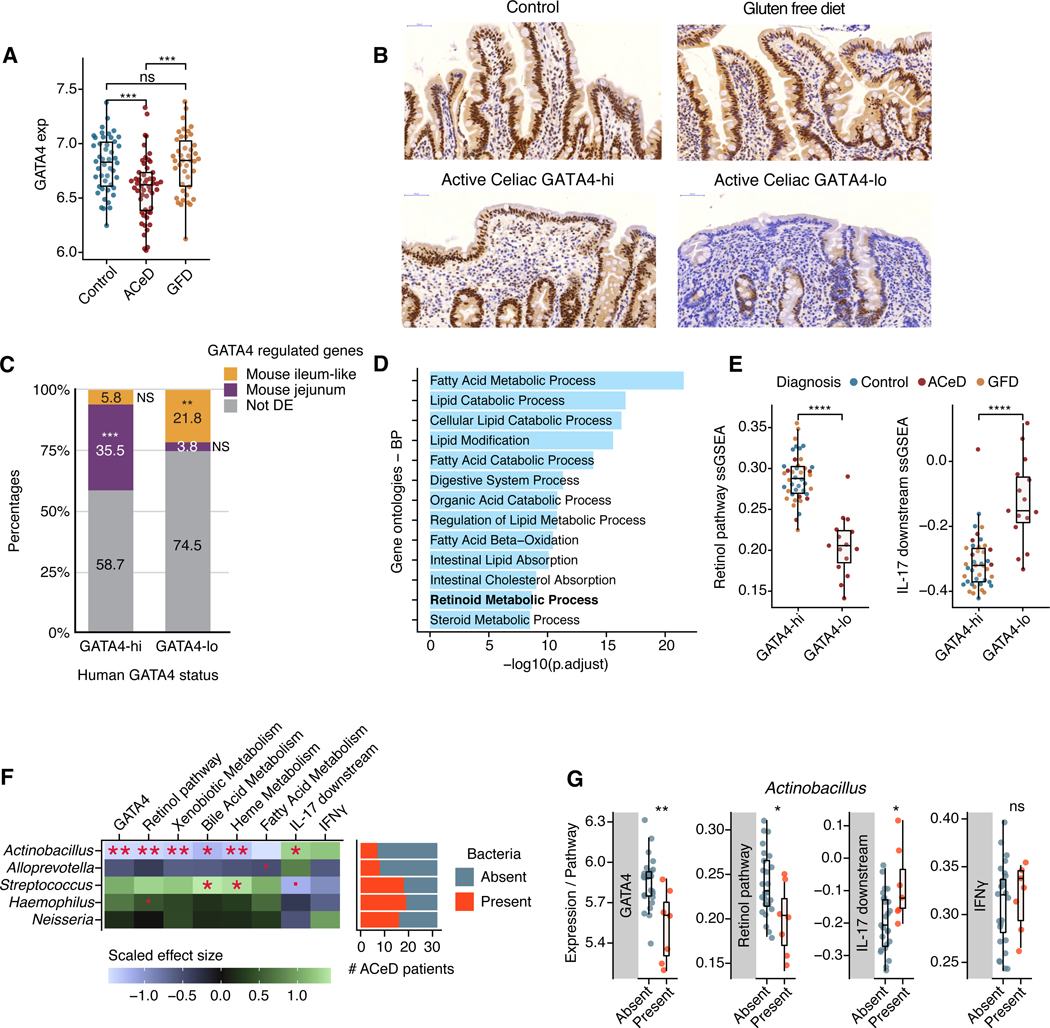
There is growing recognition that regionalization of bacterial colonization and immunity along the intestinal tract has an important role in health and disease. Yet, the mechanisms underlying intestinal regionalization and its dysregulation in disease are not well understood. This study found that regional epithelial expression of the transcription factor GATA4 controls bacterial colonization and inflammatory tissue immunity in the proximal small intestine by regulating retinol metabolism and luminal IgA. Furthermore, in mice without jejunal GATA4 expression, the commensal segmented filamentous bacteria promoted pathogenic inflammatory immune responses that disrupted barrier function and increased mortality upon Citrobacter rodentium infection. In celiac disease patients, low GATA4 expression was associated with metabolic alterations, mucosal Actinobacillus, and increased IL-17 immunity. Taken together, these results reveal broad impacts of GATA4-regulated intestinal regionalization on bacterial colonization and tissue immunity, highlighting an elaborate interdependence of intestinal metabolism, immunity, and microbiota in homeostasis and disease.

Keywords: GATA4; IgA; bacterial colonization; celiac disease; immunopathology; infection; intestinal epithelial cells; intestinal regionalization; retinoic acid; segmented filamentous bacteria.


Conflict of interest statement

Declaration of interests The authors declare no competing interests.

Figures

Figure 1.
Figure 1.. Epithelial GATA4 controls regionalization of tissue immunity in the proximal small intestine
(A) Percentage of IFNγ+, IL-17a+, or IL-10+ cells among CD4+ or CD8αβ+ T cells from intraepithelial lymphocytes (IEL) or the lamina propria (LP) of each intestinal segment in specific-pathogen-free (SPF) or germ-free (GF) mice. ****, P<0.0001, effect due to region; oooo P<0.0001, ooo P<0.001, oo P< 0.01, effect due to microbiota; two-way ANOVA of microbiota and region impact on cytokine levels. N= 5–7 mice/group. (B) Tissue samples plotted by the top two principal components (PCs) of the expression of the 500 most variable immune genes as measured by RNA-seq. N= 8 mice/group. (C) Heatmap of the z-scored expression of region-specific, GATA4-regulated immune genes (rows) in jejunum and ileum tissue samples (columns) of wild-type (WT) and GATA4ΔIEC mice. Of 625 genes, 145 are uniquely in the IFNγ module, 54 are uniquely in the IL-17 module, 39 are in both modules, and 387 are in neither (annotation column). N= 8 mice/group. (D) Representative (left) and summary (right) plots of the frequencies of IFN-γ+ cells among CD8αβ+ T cells in the IELs. N= 6 mice/group. (E) Representative (left) and summary (right) plots of the frequencies of IL-17a+ cells among CD4+ T cells in the LP. N= 6 mice/group. (F) Heatmap of the z-scored expression of 50 selected microbiota-dependent and -independent (right annotation column), region-specific, GATA4-regulated immune genes in jejunum tissue samples from SPF and GF WT and GATA4ΔIEC mice. Gene modules (left annotation column) as in C. (G, H) Frequency (y axis) of IFNγ+ cells among CD8αβ+ T cells from the IEL (G) or of IL-17a+ cells among CD4+ T cells from the LP (H) in the jejunum of SPF and GF WT and GATA4ΔIEC mice. N= 6 mice/group. All data in this figure are pooled from at least two independent experiments. **** P<0.0001 , *** P<0.001, ** P<0.01, * P<0.05, paired t-test (D and E), ANOVA with Tukey multiple comparison test (G and H).
Figure 2.
Figure 2.. GATA4 prevents commensal and pathogenic bacteria from colonizing the jejunum.
(A) SFB load, as measured by qPCR, relative to the amount of host DNA in mucosal scrapings of jejunum and ileum from WT and GATA4ΔIEC mice. N= 18–19 mice/group. (B) FISH staining using universal 16s rRNA probes (Alexa 546, red-orange), SFB 16s probe (Alexa 488), and counterstained with DAPI (blue). The overlay of the 16s probes (yellow-orange) represents SFB. Figure is a representative image from 4 independent WT and GATA4ΔIEC mice. (C) Transmission electron microscopy of SFB adhering to jejunal IECs of GATA4ΔIEC mice. Figure is a representative image from 3 separate mice and a minimum of 5 different areas of view. (D) C. rodentium load, measured by qPCR relative to host DNA, in distinct intestinal in WT and GATA4ΔIEC mice. N= 13 mice/group. (E) Bacterial loads of wild-type C. rodentium and the ΔEAE mutant, measured by qPCR relative to host DNA, in distinct intestinal segments of GF WT or GATA4ΔIEC mice. N= 7–9 mice/group. All data in this figure are pooled from at least two-independent experiments and represented as mean ± SEM. **** P<0.0001, *** P<0.001, ** P<0.01, * P<0.05, Kruskal-Wallis with Dunn multiple comparison test (A, E), Mann-Whitney test (D).
Figure 3.
Figure 3.. SFB colonization of the proximal small intestine drives excessive inflammatory T cell responses to C. rodentium infection
(A, B) Frequency of IFNγ+ cells among CD8αβ+ T cells (A) or IL-17a+ cells among CD4+ T cells (B) in the jejunum from SPF, GF, Jackson (JAX) microbiota transfer, and Jackson microbiota + SFB transfer into GF WT and GATA4ΔIEC mice. N= 4–6 mice/group. (C, D) Frequency of IFNγ+ cells among CD8αβ+ T cells (I) and of IL-17+ cells among CD4+ T cells (J) in jejunum of GATA4ΔIEC mice monocolonized with rat or mouse SFB. N= 5 mice/group. (E) C. rodentium load, measured by qPCR, in distinct intestinal segments in SFB free (open circles) or SFB colonized (filled circles) GATA4ΔIEC mice. N= 5–6 mice/group. (F) Representative (left) plots and summarized (right) of IFNγ+ and TNF+ CD8αβ+ IEL T cells from the jejunum of GATA4ΔIEC mice that are colonized with JAX (open circle) or JAX + SFB (solid circle) and either uninfected (− C.r) or infected (+ C.r) with C. rodentium. Red box indicates double IFNγ+ TNF+ CD8αβ+ T cells which are summarized (right). Mice were analyzed 5 days after infection. N= 4–5 mice/group. All data in this figure are pooled from at least two-independent experiments and represented as mean or mean± SEM. **** P<0.0001, *** P<0.001, ** P<0.01, * P<0.05, ns P> 0.05, t-test (A-D), Mann-Whitney test (E), ANOVA with Tukey multiple comparison test (F).
Figure 4.
Figure 4.. Dysregulated SFB colonization of the proximal intestine promotes loss of barrier function and TNF induced immunopathology upon C. rodentium infection
(A) Representative H&E staining of each intestinal region 10 days after C. rodentium infection. (B) CFUs of C. rodentium translocation to MLN, liver, and spleen. N= 8–10 mice/group. (C) Percent survival of WT and GATA4ΔIEC mice 0–15 days post C. rodentium infection. N= 8–9 mice/ group. (D) Percent survival of JAX colonized WT (blue) and GATA4ΔIEC (red) in SFB associated (solid lines) or SFB free mice (dashed lines) 0–20 days post C. rodentium infection. N= 6 WT mice/group, N= 9 GATA4ΔIEC – SFB mice/group, N= 10 GATA4ΔIEC + SFB mice/group. (E) Relative expression as measured by qPCR of tight junction proteins to GAPDH in the jejunum of SFB free (open circles) or SFB colonized (filled circles) GATA4ΔIEC mice 5 days after infection. N= 5–6 mice/group. (F) CFUs of C. rodentium translocation to MLN of SFB free or SFB colonized GATA4ΔIEC mice 5 days after infection. N= 5–6 mice/group. (G) CFUs of C. rodentium translocation to MLN of SFB positive WT isotype, GATA4ΔIEC isotype, or GATA4ΔIEC αTNF treated mice 5 days after infection. N= 4 mice/group. (H) Percent survival of WT isotype treated, and GATA4ΔIEC isotype treated, or αTNFα treated mice 0–15 days post C. rodentium infection. N= 7–9 mice/ group. All data in this figure are pooled from at least two-independent experiments and represented as mean or mean± SEM. **** P<0.0001 , *** P<0.001, ** P<0.01, * P<0.05, Mann-Whitney test (B), Mantel-Cox test (C, D, H), t-test (E), Mann-Whitney test (F), ANOVA with Tukey multiple comparison test (G).
Figure 5.
Figure 5.. GATA4 regulates regionalization of retinol metabolism and IgA to limit SFB colonization in the proximal intestine.
(A) FISH staining of SFB (Cy5) in monocolonized IgA deficient (Igha−/−) and littermate control (Igha+/−) mice and counterstained with DAPI. (B) SFB load, as measured by qPCR, in mucosal scrapings from the jejunum and ileum of control (Igha+/−) mice and the jejunum of IgA deficient (Igha−/−) mice. N= 7–8 mice/group. (C) Number of IgA+ B220 plasma cells, in the jejunum and ileum tissue of WT and GATA4ΔIEC mice. N= 5 mice/group. (D) Amount of sIgA, as determined by enzyme-linked immunoassay (ELISA), in contents of the jejunum. (E) Frequency of IgA coated bacteria after staining of Rag1−/− feces with supernatant from WT and GATA4ΔIEC jejunal contents. N= 4–5 mice/group. (F) SFB loads, in jejunal mucosal scrapings of PBS-treated WT or GATA4ΔIEC mice, and IgAsupplemented GATA4ΔIEC mice. N= 5–7 mice/group. (G) Heatmap of z-scored expression of region-specific GATA4-regulated genes in the KEGG retinol metabolism pathway, from RNA-seq on epithelial cells. Compared to other genes in the pathway expressed in epithelial samples, these genes are significantly enriched in GATA4-bound promoters, as determined by ChIP-seq (black squares in the annotation column) (Table S1; odds ratio 2.6, P < 0.005; Fisher’s exact test). (H) Top, representative histogram of ALDH activity by ALDEFLUOR staining in jejunal epithelial cells. WT epithelial cells treated with ALDH inhibitor are shown as negative control for background fluorescence. Bottom, summary plots show the normalized geometric mean fluorescence intensity (gMFI) of ALDEFLUOR staining in epithelial cells from the jejunum and ileum of WT and GATA4ΔIEC mice. N= 6 mice/group. (I) Total IgA in the jejunal contents of WT, GATA4ΔIEC vehicle-treated, and GATA4ΔIEC RA-treated mice after 14 days. N= 4 mice/group. (J) SFB loads, in jejunal mucosal scrapings of GF WT mice fed a control or vitamin A deficient diet and subsequently colonized with SFB. N= 5 mice/group. (K) Pigr expression as measured by qPCR relative to Gapdh, in the jejunum of WT and GATA4ΔIEC mice. N= 7 mice/group. All data in this figure are pooled from at least two-independent experiments and represented as mean± SEM. **** P<0.0001 , *** P<0.001, ** P<0.01, * P<0.05, Kruskal-Wallis with Dunn multiple comparison test (B), ANOVA with Tukey multiple comparison test (C, F, H, I), t-test (D, E, K), Mann Whitney test (J).
Figure 6.
Figure 6.. Loss of GATA4 expression is associated with lipid metabolic dysfunction and increased IL-17 signaling in celiac disease.
(A) Normalized GATA4 expression in duodenal biopsies from healthy controls, active celiac disease patients (ACeD), and gluten free diet celiac patients (GFD). (B) Representative IHC staining for GATA4 in healthy control, GATA4-hi and GATA4-lo active celiac disease patients, and gluten free diet celiac patients. (C) Bar plot shows the percentages of human-mouse homologous genes specific to GATA4-hi or GATA4-lo individuals, which are also either GATA4-regulated and specific to the jejunum (purple) or to the ileum-like tissues (yellow), or not (gray). *** P <10−51, ** P <10−6, NS not significant. (D) Bar plot shows the most significantly enriched gene ontologies and their significance (x axis, negative log FDR-adjusted P-values) in the intersection of genes specific to GATA-hi individuals and WT mouse jejunum. (E) Single-sample gene set enrichment analysis (ssGSEA) scores for the retinol metabolism (left) and IL-17 downstream signaling (right) pathways in GATA4-hi and GATA4-lo individuals from all patient groups. (F) Left, heatmap displays the scaled effect size of the absence or presence of five relevant bacteria (Fig. S4I) on GATA4 expression and on the ssGSEA scores of metabolic and immune pathways. Right, bar plot shows the numbers of detectable bacteria in ACeD samples. (G) Box plots show GATA4 expression and ssGSEA scores for the retinol metabolism, IL17 downstream signaling, and IFNγ pathways in ACeD patients, grouped by the absence or presence of Actinobacillus. **** P<0.0001 , *** P<0.001, ** P<0.01, * P<0.05, · P <0.1, Wilcoxon rank test (A, E, G), Fisher’s exact test (C), t-test (F).

Comment in

References

    1. Mowat AM, and Agace WW (2014). Regional specialization within the intestinal immune system. Nature reviews. Immunology 14, 667–685. 10.1038/nri3738. - DOI - PubMed
    1. Donaldson GP, Lee SM, and Mazmanian SK (2016). Gut biogeography of the bacterial microbiota. Nature reviews. Microbiology 14, 20–32. 10.1038/nrmicro3552. - DOI - PMC - PubMed
    1. Esterházy D, Canesso MCC, Mesin L, Muller PA, de Castro TBR, Lockhart A, ElJalby M, Faria AMC, and Mucida D. (2019). Compartmentalized gut lymph node drainage dictates adaptive immune responses. Nature 569, 126–130. 10.1038/s41586-019-1125-3. - DOI - PMC - PubMed
    1. Bosse T, Piaseckyj CM, Burghard E, Fialkovich JJ, Rajagopal S, Pu WT, and Krasinski SD (2006). Gata4 is essential for the maintenance of jejunal-ileal identities in the adult mouse small intestine. Mol Cell Biol 26, 9060–9070. 10.1128/mcb.00124-06. - DOI - PMC - PubMed
    1. Battle MA, Bondow BJ, Iverson MA, Adams SJ, Jandacek RJ, Tso P, and Duncan SA (2008). GATA4 is essential for jejunal function in mice. Gastroenterology 135, 1676–1686.e1671. 10.1053/j.gastro.2008.07.074. - DOI - PMC - PubMed

Publication types