. 2023 Jan 17;4(1):100896.
doi: 10.1016/j.xcrm.2022.100896. Epub 2023 Jan 10.

Conserved angio-immune subtypes of the tumor microenvironment predict response to immune checkpoint blockade therapy

Affiliations

Conserved angio-immune subtypes of the tumor microenvironment predict response to immune checkpoint blockade therapy

Madhav Subramanian et al. Cell Rep Med. .

Abstract

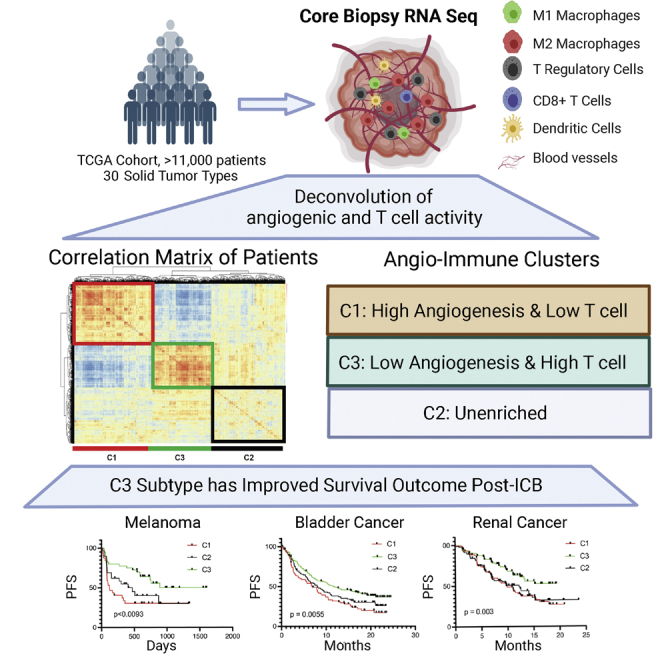
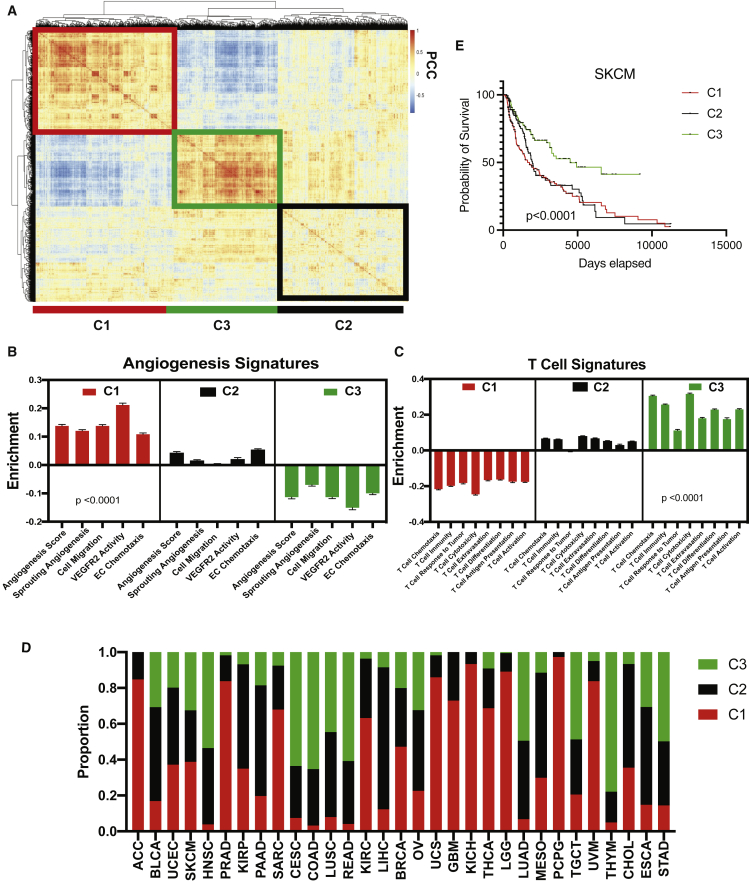
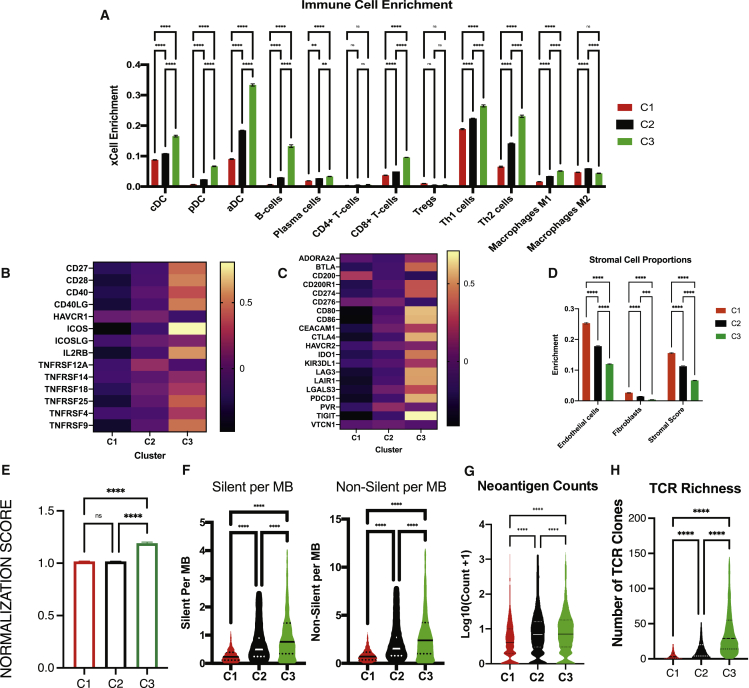
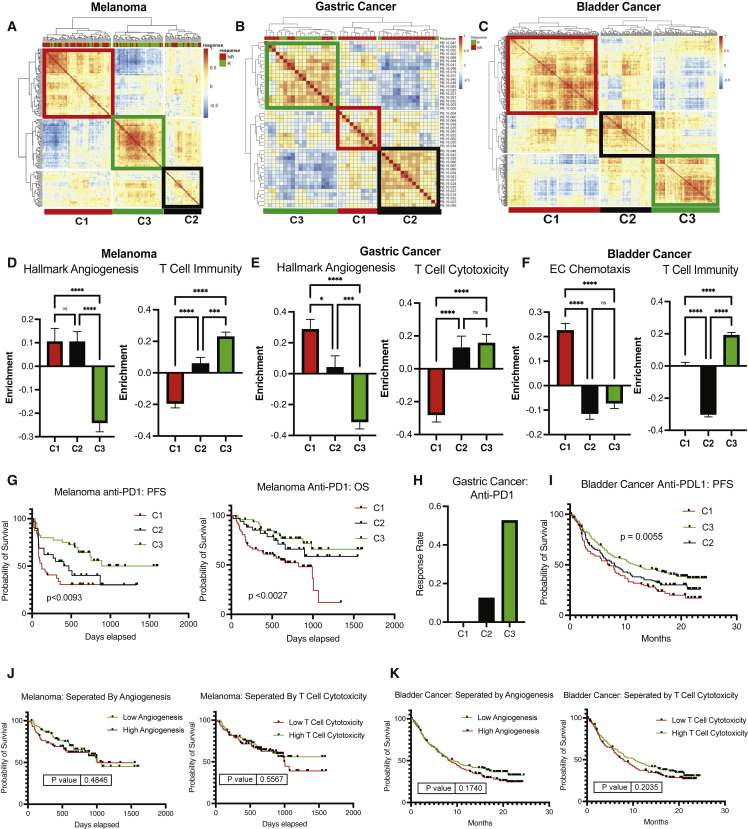
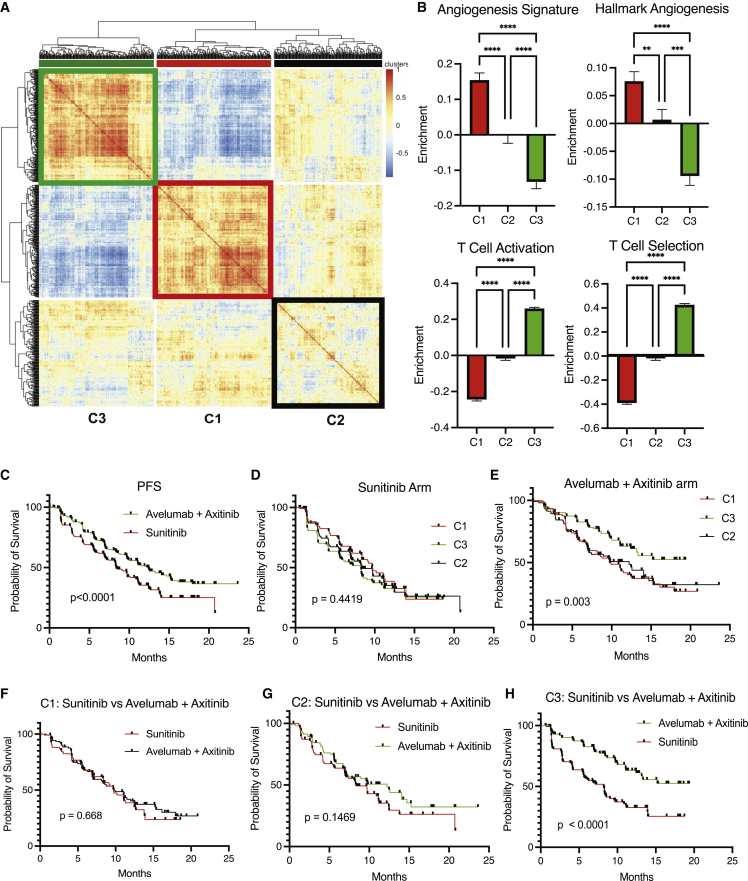
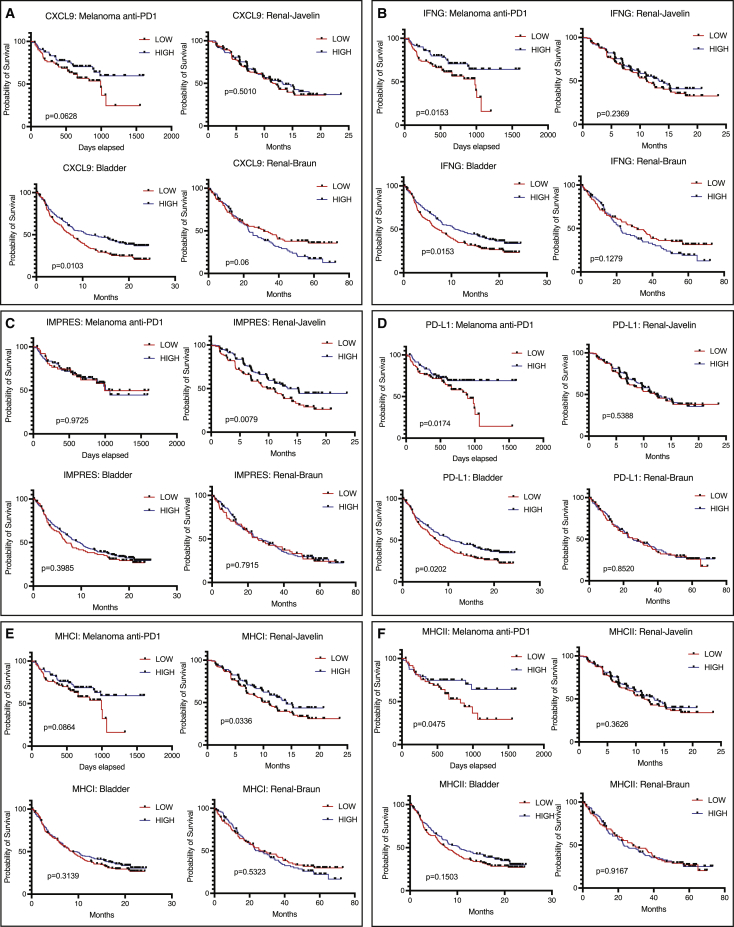
Immune checkpoint blockade (ICB) therapy has revolutionized cancer treatment. However, only a fraction of patients respond to ICB therapy. Accurate prediction of patients to likely respond to ICB would maximize the efficacy of ICB therapy. The tumor microenvironment (TME) dictates tumor progression and therapy outcome. Here, we classify the TME by analyzing the transcriptome from 11,069 cancer patients based on angiogenesis and T cell activity. We find three distinct angio-immune TME subtypes conserved across 30 non-hematological cancers. There is a clear inverse relationship between angiogenesis and anti-tumor immunity in TME. Remarkably, patients displaying TME with low angiogenesis with strong anti-tumor immunity show the most significant responses to ICB therapy in four cancer types. Re-evaluation of the renal cell carcinoma clinical trials provides compelling evidence that the baseline angio-immune state is robustly predictive of ICB responses. This study offers a rationale for incorporating baseline angio-immune scores for future ICB treatment strategies.

Keywords: immune checkpoint blockade; tumor angiogenesis; tumor immunity.


Conflict of interest statement

Declaration of interests The authors declare no competing interests.

Figures

None
Graphical abstract
Figure 1
Figure 1
Three pan-cancer angio-immune subtype identification (A) Heatmap of Pearson correlation of patients with non-hematological tumor types across 91 gene sets corresponding T cell and angiogenesis activity. Distance based clustering revealed three distinct clusters across patients. The clusters were labeled C1 (red outline), C2 (black outline), and C3 (green outline). (B) Bar graphs depicting the average enrichment of angiogenesis signatures in the three angio-immune subtypes. Enrichment of pathways was conducted using gene set variation analysis (GSVA). The enrichment of representative gene sets is plotted. One-way ANOVA was used to determine statistical significance. (C) Bar graphs depicting the average enrichment of T cell signatures in the three angio-immune subtypes. Enrichment of pathways was conducted using GSVA. The enrichment of representative gene sets is plotted. One-way ANOVA was used to determine statistical significance. (D) Stacked barplots depicting relative proportion of each angio-immune subtype in all cancers queried. The proportion of all tumors of a particular cancer type belonging to individual angio-immune subtypes was calculated. (E) Overall survival of patients belonging to three angio-immune subtypes among skin cutaneous melanoma (SKCM) patients. Survival data were derived from publicly available clinical records of TCGA patients. Log ranked test was used for survival analysis.
Figure 2
Figure 2
Immune characteristics of angio-immune subtypes (A) Bar plots showing xCell enrichment results for major tumor hematopoietic cells across angio-immune subtypes. The enrichment of classical dendritic cells (cDC), plasmacytoid dendritic cells (pDC), activated dendritic cells (aDC), B cells, plasma cells, CD4+ and CD8+ T cells, Tregs, Th1 cells, Th2 cells, and M1 and M2 macrophages as derived from xCell were compared across angio-immune subtypes. One-way ANOVA was used to determine statistical significance. (B) Heatmap of the Z-scored expression co-stimulatory molecules across angio-immune subtypes. (C) Heatmap of the Z-scored expression T cell inhibitory molecules across angio-immune subtypes. (D) Bar plots showing xCell enrichment results for endothelial cells, fibroblasts, and pericytes across angio-immune subtypes. One-way ANOVA was used to determine statistical significance. (E) Vessel normalization scores across angio-immune subtypes. xCell enrichment for pericytes and endothelial cells was normalized, and the ratio of pericytes to endothelial cells was evaluated and termed the vessel normalization score and is plotted in a bar graph. One-way ANOVA was used to determine statistical significance. (F) Violin plots depicting silent and non-silent mutational burden across three angio-immune clusters. Data were obtained from the GDC pan-cancer atlas. One-way ANOVA was used to determine statistical significance. (G) Violin plot of neoantigen counts across three angio-immune clusters. Neoantigen counts were log transformed for visualization purposes. One-way ANOVA was used to determine statistical significance. (H) Violin plot of TCR richness across three angio-immune clusters. TCR richness data were obtained from the GDC pan-cancer atlas. One-way ANOVA was used to determine statistical significance. ∗ = p < 0.05, ∗∗ = p < 0.01, ∗∗∗ = p < 0.001, ∗∗∗∗ = p < 0.0001.
Figure 3
Figure 3
Angio-immune subtypes are prognostic of response to anti-PD1/PDL1 (A) Heatmap of Pearson Correlation of 145 patients with melanoma across 91 gene sets corresponding T cell and angiogenesis activity. Angio-immune subtypes are preserved in the melanoma cohort. Response status is depicted for each patient on top of the heatmap. Green depicts responders to treatment and red depicts non-responders. (B) Heatmap of Pearson correlation of 45 patients with gastric cancer across 91 gene sets corresponding T cell and angiogenesis activity. Response status is depicted for each patient on the top of the heatmap. Angio-immune subtypes are preserved in the gastric cancer cohort. Response status is depicted for each patient on top of the heatmap. Green depicts responders to treatment and red depicts non-responders. (C) Heatmap of Pearson correlation of 348 patients with bladder cancer across 91 gene sets corresponding T cell and angiogenesis activity. Angio-immune subtypes are preserved in the gastric cancer cohort. (D) Bar graphs depicting the average enrichment of angiogenesis signature and T cell signature in the three angio-immune subtypes in the melanoma cohort. Enrichment of pathways was conducted using gene set variation analysis (GSVA). The enrichment of representative gene sets is plotted. One-way ANOVA was used to determine statistical significance. (E) Bar graphs depicting the average enrichment of angiogenesis signature and T cell signature in the three angio-immune subtypes in the gastric cancer cohort. Enrichment of pathways was conducted using GSVA. The enrichment of representative gene sets is plotted. One-way ANOVA was used to determine statistical significance. (F) Bar graphs depicting the average enrichment of angiogenesis signature and T cell signature in the three angio-immune subtypes in the bladder cancer cohort. Enrichment of pathways was conducted using GSVA. The enrichment of representative gene sets is plotted. One-way ANOVA was used to determine statistical significance. (G) Overall survival and progression-free survival for patients in different angio-immune clusters upon treatment with anti-PD1 in melanoma patients. (H) Response rate for patients in different angio-immune clusters upon treatment with anti-PD1 in gastric cancer patients. (I) Progression-free survival for patients in different angio-immune clusters upon treatment with anti-PDL1 in bladder cancer patients. (J) Progression-free survival of patients with melanoma treated with anti-PD1 split by high (>50th percentile) and low (<50th percentile) angiogenesis and T cell cytotoxicity. (K) Progression-free survival of patients with bladder cancer treated with anti-PDL1 split by high (>50th percentile) and low (<50th percentile) angiogenesis and T cell cytotoxicity. Log-ranked tests were used for survival analysis. ∗ = p < 0.05, ∗∗ = p < 0.01, ∗∗∗ = p < 0.001, ∗∗∗∗ = p < 0.0001.
Figure 4
Figure 4
Re-evaluation of Javelin 101 reveals differing propensity for response by angio-immune subtypes (A) Heatmap of Pearson correlation of 726 patients with renal cell carcinoma across 91 gene sets corresponding T cell and angiogenesis activity. Angio-immune subtypes are preserved in the renal cancer cohort. (B) Bar graphs depicting the average enrichment of angiogenesis signatures and T cell signatures in the three angio-immune subtypes in renal cell carcinoma cohort. Enrichment of pathways was conducted using gene set variation analysis (GSVA). The enrichment of representative gene sets is plotted. One-way ANOVA was used to determine statistical significance. (C) Progression-free survival of patients treated with sunitinib versus the combination of axitinib + avelumab. (D) Progression-free survival of patients treated with sunitinib belonging to different angio-immune clusters. (E) Progression-free survival of patients treated with combination of axitinib + avelumab belonging to different angio-immune clusters. (F) Progression-free survival of patients belonging in C1 treated with sunitinib versus the combination of axitinib + avelumab. (G) Progression-free survival of patients belonging in C2 treated with sunitinib versus the combination of axitinib + avelumab. (H) Progression-free survival of patients belonging in C3 treated with sunitinib versus the combination of axitinib + avelumab. ∗ = p < 0.05, ∗∗ = p < 0.01, ∗∗∗ = p < 0.001, ∗∗∗∗ = p < 0.0001.
Figure 5
Figure 5
Ability of previous techniques to predict ICB response (A) Overall survival (OS) tracked for anti-PD1-treated melanoma, anti-PDL1-treated bladder cancer, and anti-PD1-treated renal cancer (Braun) and progression-free survival (PFS) tracked for anti-PDL1-treated renal cancer (Javelin) based on CXCL9 expression. Median expression was used to separate “High” and “Low” expressers. (B) OS tracked for anti-PD1-treated melanoma, anti-PDL1-treated bladder cancer, and anti-PD1-treated renal cancer (Braun) and PFS tracked for anti-PDL1-treated renal cancer (Javelin) based on IFNG signature enrichment. Median enrichment was used to separate “High” and “Low” expressers. (C) OS tracked for anti-PD1-treated melanoma, anti-PDL1-treated bladder cancer, and anti-PD1-treated renal cancer (Braun) and PFS tracked for anti-PDL1-treated renal cancer (Javelin) based on IMPRES scores. Median scores were used to separate “High” and “Low” scores. (D) OS tracked for anti-PD1-treated melanoma, anti-PDL1-treated bladder cancer, and anti-PD1-treated renal cancer (Braun) and PFS tracked for anti-PDL1-treated renal cancer (Javelin) based on PD-L1 expression. Median expression was used to separate “High” and “Low” expressers. (E) OS tracked for anti-PD1-treated melanoma, anti-PDL1-treated bladder cancer, and anti-PD1-treated renal cancer (Braun) and PFS tracked for anti-PDL1-treated renal cancer (Javelin) based on MHCI expression. Median expression was used to separate “High” and “Low” expressers. (F) OS tracked for anti-PD1-treated melanoma, anti-PDL1-treated bladder cancer, and anti-PD1-treated renal cancer (Braun) and PFS tracked for anti-PDL1-treated renal cancer (Javelin) based on MHCII expression. Median expression was used to separate “High” and “Low” expressers.

References

    1. Dagogo-Jack I., Shaw A.T. Tumour heterogeneity and resistance to cancer therapies. Nat. Rev. Clin. Oncol. 2018;15:81–94. doi: 10.1038/nrclinonc.2017.166. - DOI - PubMed
    1. Thorsson V., Gibbs D.L., Brown S.D., Wolf D., Bortone D.S., Ou Yang T.H., Porta-Pardo E., Gao G.F., Plaisier C.L., Eddy J.A., et al. The immune landscape of cancer. Immunity. 2018;48:812–830.e14. doi: 10.1016/j.immuni.2018.03.023. - DOI - PMC - PubMed
    1. Chen H., Li C., Peng X., Zhou Z., Weinstein J.N., Cancer Genome Atlas Research Network. Liang H. A pan-cancer analysis of enhancer expression in nearly 9000 patient samples. Cell. 2018;173:386–399.e12. doi: 10.1016/j.cell.2018.03.027. - DOI - PMC - PubMed
    1. Peng X., Chen Z., Farshidfar F., Xu X., Lorenzi P.L., Wang Y., Cheng F., Tan L., Mojumdar K., Du D., et al. Molecular characterization and clinical relevance of metabolic expression subtypes in human cancers. Cell Rep. 2018;23:255–269.e4. doi: 10.1016/j.celrep.2018.03.077. - DOI - PMC - PubMed
    1. Pearson J.D., Huang K., Pacal M., McCurdy S.R., Lu S., Aubry A., Yu T., Wadosky K.M., Zhang L., Wang T., et al. Binary pan-cancer classes with distinct vulnerabilities defined by pro- or anti-cancer YAP/TEAD activity. Cancer Cell. 2021;39:1115–1134.e12. doi: 10.1016/j.ccell.2021.06.016. - DOI - PMC - PubMed

Publication types

MeSH terms

Substances