. 2023 Jan;11(1):e005881.
doi: 10.1136/jitc-2022-005881.

Preclinical optimization of a GPC2-targeting CAR T-cell therapy for neuroblastoma

Affiliations

Preclinical optimization of a GPC2-targeting CAR T-cell therapy for neuroblastoma

Ming Sun et al. J Immunother Cancer. 2023 Jan.

Abstract

Background: Although most patients with newly diagnosed high-risk neuroblastoma (NB) achieve remission after initial therapy, more than 50% experience late relapses caused by minimal residual disease (MRD) and succumb to their cancer. Therapeutic strategies to target MRD may benefit these children. We developed a new chimeric antigen receptor (CAR) targeting glypican-2 (GPC2) and conducted iterative preclinical engineering of the CAR structure to maximize its anti-tumor efficacy before clinical translation.

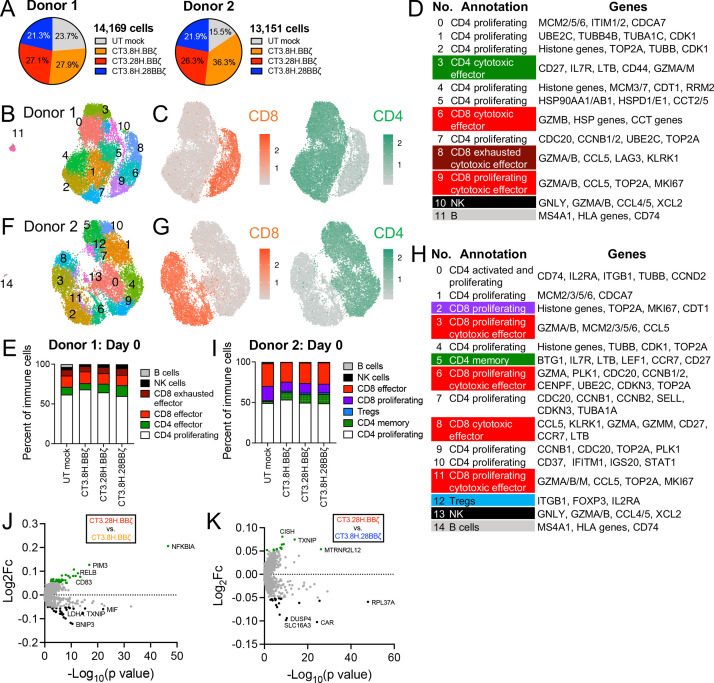
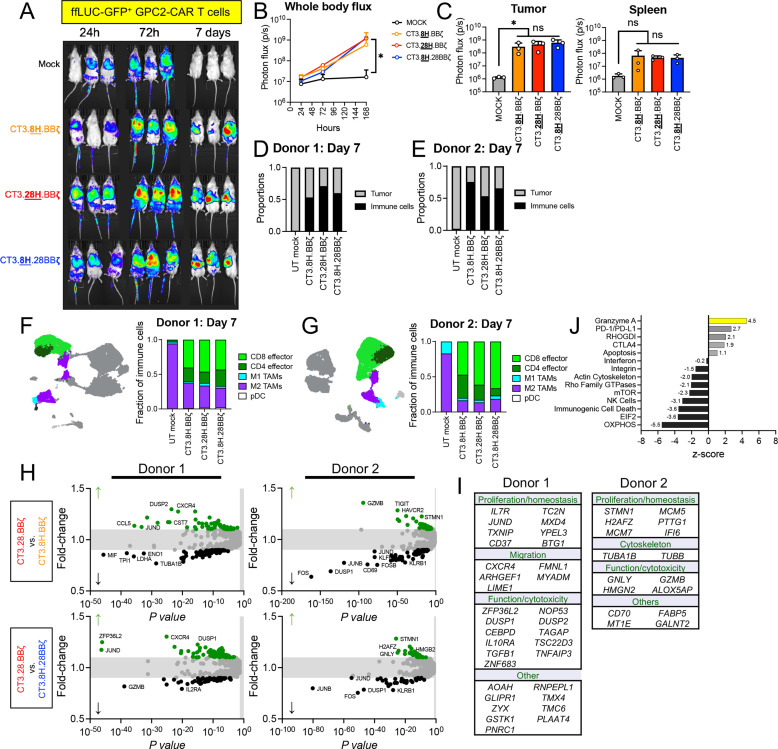
Methods: We evaluated different GPC2-CAR constructs by measuring the CAR activity in vitro. NOD-SCID mice engrafted orthotopically with human NB cell lines or patient-derived xenografts and treated with human CAR T cells served as in vivo models. Mechanistic studies were performed using single-cell RNA-sequencing.

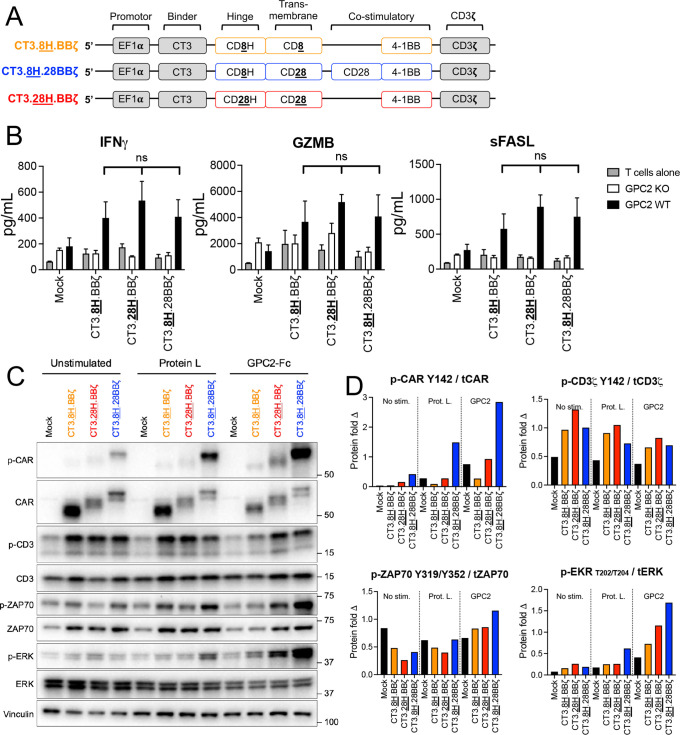
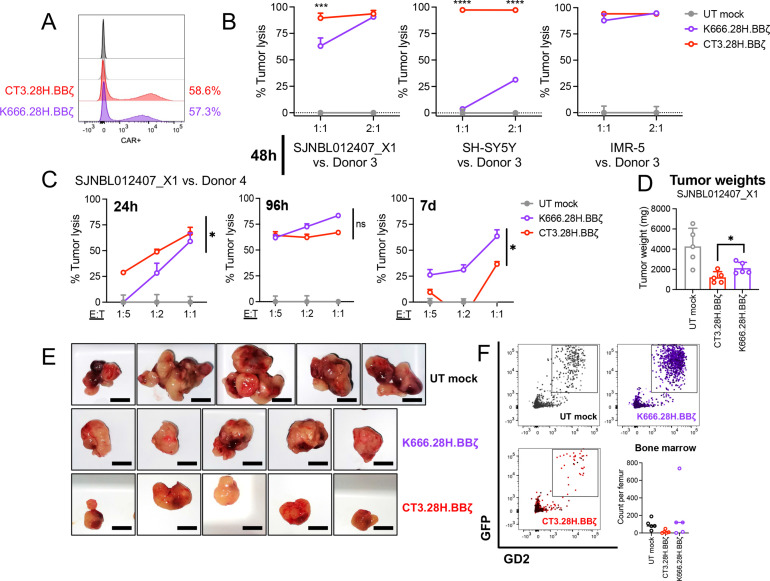
Results: Applying stringent in vitro assays and orthotopic in vivo NB models, we demonstrated that our single-chain variable fragment, CT3, integrated into a CAR vector with a CD28 hinge, CD28 transmembrane, and 4-1BB co-stimulatory domain (CT3.28H.BBζ) elicits the best preclinical anti-NB activity compared with other tested CAR constructs. This enhanced activity was associated with an enrichment of CD8+ effector T cells in the tumor-microenvironment and upregulation of several effector molecules such as GNLY, GZMB, ZNF683, and HMGN2. Finally, we also showed that the CT3.28H.BBζ CAR we developed was more potent than a recently clinically tested GD2-targeted CAR to control NB growth in vivo.

Conclusion: Given the robust preclinical activity of CT3.28H.BBζ, these results form a promising basis for further clinical testing in children with NB.

Keywords: immunotherapy; neuroblastoma; pediatrics; receptors, chimeric antigen.


Conflict of interest statement

Competing interests: None declared.

Figures

Figure 1
Figure 1
Comparison of three GPC2-CAR constructs in vitro. (A) Schema of the three CAR constructs used for preclinical studies with variable hinge, TM, and co-stimulatory domains. (B) Cytokine secretion profile of GPC2-CAR T cells at 24 hours in co-culture with tumor cells. Human T cells transduced with the three different GPC2-CARs were grown with GPC2-KO or GPC2-WT IMR-5 tumor cells. The levels of IFNγ, GZMB, and sFASL were significantly increased in the presence of GPC2 but comparable across the three tested CARs. (C) Western blot analysis to demonstrate CAR signaling in resting and CAR-crosslinked T cells. (D) Densiometric quantification of western blot signals from (C). CT3.8H.28BBζ shows prominent tonic signaling of the CAR at rest and a lack thereof in CT3.28H.BBζ and CT3.8H.BBζ. However, antigen-specific CAR activation induces higher phosphorylation levels in CT3.28H.BBζ compared with CT3.8H.BBζ. CAR, chimeric antigen receptor; GPC2, glypican-2; GZMB, granzyme B; IFN, interferon; KO, knock out; sFASL, soluble Fas ligand; TM, transmembrane; WT, wildtype
Figure 2
Figure 2
CT3.28H.BBζ outperforms CT3.8H.CD28BBζ in vivo. (A) Tumor weights on Day 50 post tumor injection. CT3.28H.BBζ induced the most significant tumor regression across all therapy groups. (B) Model system and experimental regimen. (C) Longitudinal BLI signals of mice treated with UT mock T cells or untreated controls and GPC2-targeted CAR T cells. Weekly BLI revealed that CT3.28H.BBζ-CAR T–treated animals demonstrated a profound decline in their BLI signal that was sustained for the duration of the study. In contrast, mice treated with CT3.8H.28BBζ or lower cell doses of each of the GPC2-targeted CAR T cells showed a temporary response but ultimately progressed. (D) Survival curves of mice from (C). (E) Persistence of CAR+ T cells isolated from the tumor of treated mice in (C) on Day 80 by flow cytometry analysis. BLI, bioluminescence imaging; CAR, chimeric antigen receptor; GPC2, glypican-2; IV, intravenous; PBS, phosphate-buffered saline; UT, untransduced.
Figure 3
Figure 3
GPC2-CAR T cell manufacturing yields proliferating and cytotoxic effector T cells. (A) Proportions of captured immune cells on Day 8 of CAR T manufacturing. (B) UMAP, (C) CD8 and CD4 protein expression levels detected by TotalSeq, (D) cluster annotations, and (E) fractions of subsets of manufactured cells from Donor 1. (F) UMAP, (G) CD8 and CD4 protein expression levels, (H) cluster annotations, and (I) fractions of subsets of manufactured cells from Donor 2. (J) and (K) DEG analysis of the produced cells. CAR, chimeric antigen receptor; DEG, differentially expressed genes; GPC2, glypican-2; NK, natural killer; UMAP, uniform manifold approximation and projection; UT, untransduced
Figure 4
Figure 4
GPC2-CAR T cells home to the TME and enrich as cytotoxic effector population in vivo. (A) GPC2-targeted CAR T cell tracking using BLI in vivo. T cells were transduced to express ffLUC-GFP and were monitored serially for homing and expansion. (B–C) All three CARs enrich and expand in the TME compared with UT mock cells. *p<0.05; Student’s t-test. (D–E) IMR-5–bearing mice underwent T cell injection. Eight days later, we isolated the tumors and performed single-cell RNA-seq. Quantifications of tumor and immune cells derived from the tumor are shown. (F–G) UMAP plots showing tumor cells (gray) and five immune subsets. The bar graphs quantify the immune proportions. (H) Volcano plots of differentially expressed genes comparing CT3.28H.BBζ vs CT3.8H.BBζ (top panels) and CT3.28H.BBζ vs CT3.8H.28BBζ (bottom panels). Green dots represent upregulated, black downregulated, and gray unchanged genes. (I) Differentially expressed genes grouped by function and extracted from both comparisons made in (H). (J) Compound pathway analysis reveals that CT3.28H.BBζ CAR T cells upregulate the granzyme A pathway but downregulate pathways related to mitochondrial oxidative phosphorylation (OXPHOS) and EIF2. BLI, bioluminescence imaging; CAR, chimeric antigen receptor; CTLA-4, cytotoxic T-lymphocytes-associated protein 4; EIF2, eukaryotic initiation factor 2; ffLUC, firefly luciferase; GFP, green fluorescent protein; GPC2, glypican-2; mTOR, mammalian target of rapamycin; NK, natural killer; TAM, tumor-associated macrophage; TME, tumor microenvironment; pDC, plasmacytoid dendritic cells; PD-1; programmed cell death protein-1; PD-L1, programmed death-ligand 1; seq, sequencing; UMAP, uniform manifold approximation and projection; UT, untransduced.
Figure 5
Figure 5
Head-to-head comparison of the GPC2-CAR (CT3.28H.BBζ) versus a GD2-CAR (K666.28H.BBζ). (A) Transduction efficiencies of CT3.28H.BBζ and K666.28H.BBζ CAR T cells. (B) In vitro cytotoxicity assays testing both CARs against three NB lines at varying E:T ratios. ***p<0.001; ****p<0.0001; two-way analysis of variance. (C) In vitro tumor rechallenge assay. CAR T cells are rechallenged every 24 hours. The cytotoxic activity is measured at 24 hours, 96 hours, and 7 days. *p<0.05; paired t-test. (D) Tumor weights on Day 50 post tumor implantation. *p<0.05; Student’s t-test. (E) Images of harvested tumors on Day 50 post-implantation. Scale bar=1.0 cm. (F) Flow analysis of bone marrow cells derived from one femur. Tumor cells are identified as hCD45 mCD45 GD2+ GFP+ cells. The total cell number per femur is plotted, and each dot represents one mouse. CAR, chimeric antigen receptor; d, days; E:T, effector-to-tumor; GFP, green fluorescent protein; GPC2, glypican-2; h, hours; NB, neuroblastoma; UT, untransduced.

References

    1. Ries LAG SM, Gurney JG, Linet M, et al. . Cancer incidence and survival among children and adolescents: United States seer program 1975-1995. Bethesda, MD, NIH: National Cancer Institute, SEER Program, n.d.
    1. Matthay KK, Villablanca JG, Seeger RC, et al. . Treatment of high-risk neuroblastoma with intensive chemotherapy, radiotherapy, autologous bone marrow transplantation, and 13-cis-retinoic acid. children's cancer group. N Engl J Med 1999;341:1165–73. 10.1056/NEJM199910143411601 - DOI - PubMed
    1. Yu AL, Gilman AL, Ozkaynak MF, et al. . Long-Term follow-up of a phase III study of ch14.18 (Dinutuximab) + cytokine immunotherapy in children with high-risk neuroblastoma: COG study ANBL0032. Clin Cancer Res 2021;27:2179-2189. 10.1158/1078-0432.CCR-20-3909 - DOI - PMC - PubMed
    1. Maude SL, Frey N, Shaw PA, et al. . Chimeric antigen receptor T cells for sustained remissions in leukemia. N Engl J Med 2014;371:1507–17. 10.1056/NEJMoa1407222 - DOI - PMC - PubMed
    1. Maude SL, Laetsch TW, Buechner J, et al. . Tisagenlecleucel in children and young adults with B-cell lymphoblastic leukemia. N Engl J Med 2018;378:439–48. 10.1056/NEJMoa1709866 - DOI - PMC - PubMed

Publication types