

A generalization performance study on the boosting radiotherapy dose calculation engine based on super-resolution
- PMID: 36631314
- PMCID: PMC11639714
- DOI: 10.1016/j.zemedi.2022.10.006
A generalization performance study on the boosting radiotherapy dose calculation engine based on super-resolution
Abstract
Purpose: During the radiation treatment planning process, one of the time-consuming procedures is the final high-resolution dose calculation, which obstacles the wide application of the emerging online adaptive radiotherapy techniques (OLART). There is an urgent desire for highly accurate and efficient dose calculation methods. This study aims to develop a dose super resolution-based deep learning model for fast and accurate dose prediction in clinical practice.
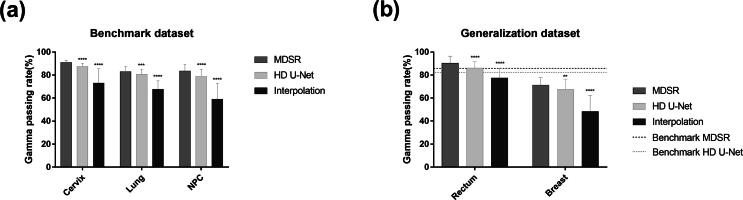
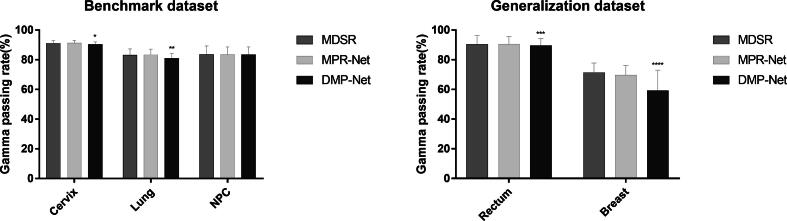
Method: A Multi-stage Dose Super-Resolution Network (MDSR Net) architecture with sparse masks module and multi-stage progressive dose distribution restoration method were developed to predict high-resolution dose distribution using low-resolution data. A total of 340 VMAT plans from different disease sites were used, among which 240 randomly selected nasopharyngeal, lung, and cervix cases were used for model training, and the remaining 60 cases from the same sites for model benchmark testing, and additional 40 cases from the unseen site (breast and rectum) was used for model generalizability evaluation. The clinical calculated dose with a grid size of 2 mm was used as baseline dose distribution. The input included the dose distribution with 4 mm grid size and CT images. The model performance was compared with HD U-Net and cubic interpolation methods using Dose-volume histograms (DVH) metrics and global gamma analysis with 1%/1 mm and 10% low dose threshold. The correlation between the prediction error and the dose, dose gradient, and CT values was also evaluated.
Results: The prediction errors of MDSR were 0.06-0.84% of Dmean indices, and the gamma passing rate was 83.1-91.0% on the benchmark testing dataset, and 0.02-1.03% and 71.3-90.3% for the generalization dataset respectively. The model performance was significantly higher than the HD U-Net and interpolation methods (p < 0.05). The mean errors of the MDSR model decreased (monotonously by 0.03-0.004%) with dose and increased (by 0.01-0.73%) with the dose gradient. There was no correlation between prediction errors and the CT values.
Conclusion: The proposed MDSR model achieved good agreement with the baseline high-resolution dose distribution, with small prediction errors for DVH indices and high gamma passing rate for both seen and unseen sites, indicating a robust and generalizable dose prediction model. The model can provide fast and accurate high-resolution dose distribution for clinical dose calculation, particularly for the routine practice of OLART.
Keywords: adaptive radiotherapy; deep learning; dose calculation; generalization performance; super resolution.
Copyright © 2022. Published by Elsevier GmbH.
Conflict of interest statement
Declaration of Competing Interest The authors declare that they have no known competing financial interests or personal relationships that could have appeared to influence the work reported in this paper.
Figures


References
-
- Hughes J., Lye J.E., Kadeer F., Alves A., Shaw M., Supple J., et al. Calculation algorithms and penumbra: Underestimation of dose in organs at risk in dosimetry audits. Med Phys. 2021;48:6184–6197. - PubMed
-
- Gotz T.I., Schmidkonz C., Chen S., Al-Baddai S., Kuwert T., Lang E.W. A deep learning approach to radiation dose estimation. Phys Med Biol. 2020;65 - PubMed
-
- Zhu J., Liu X., Chen L. A preliminary study of a photon dose calculation algorithm using a convolutional neural network. Phys Med Biol. 2020;65:20NT02. - PubMed
MeSH terms
LinkOut - more resources
Full Text Sources
